D.6 Brown Swiss: ECM Yield
D.6.1: Full Period: 1982-2023
Model Summary
v
| A. parametric coefficients | Estimate | Std. Error | t-value | p-value |
|---|---|---|---|---|
| (Intercept) | 14.5118 | 0.8535 | 17.0028 | \( < 0.0001 \) |
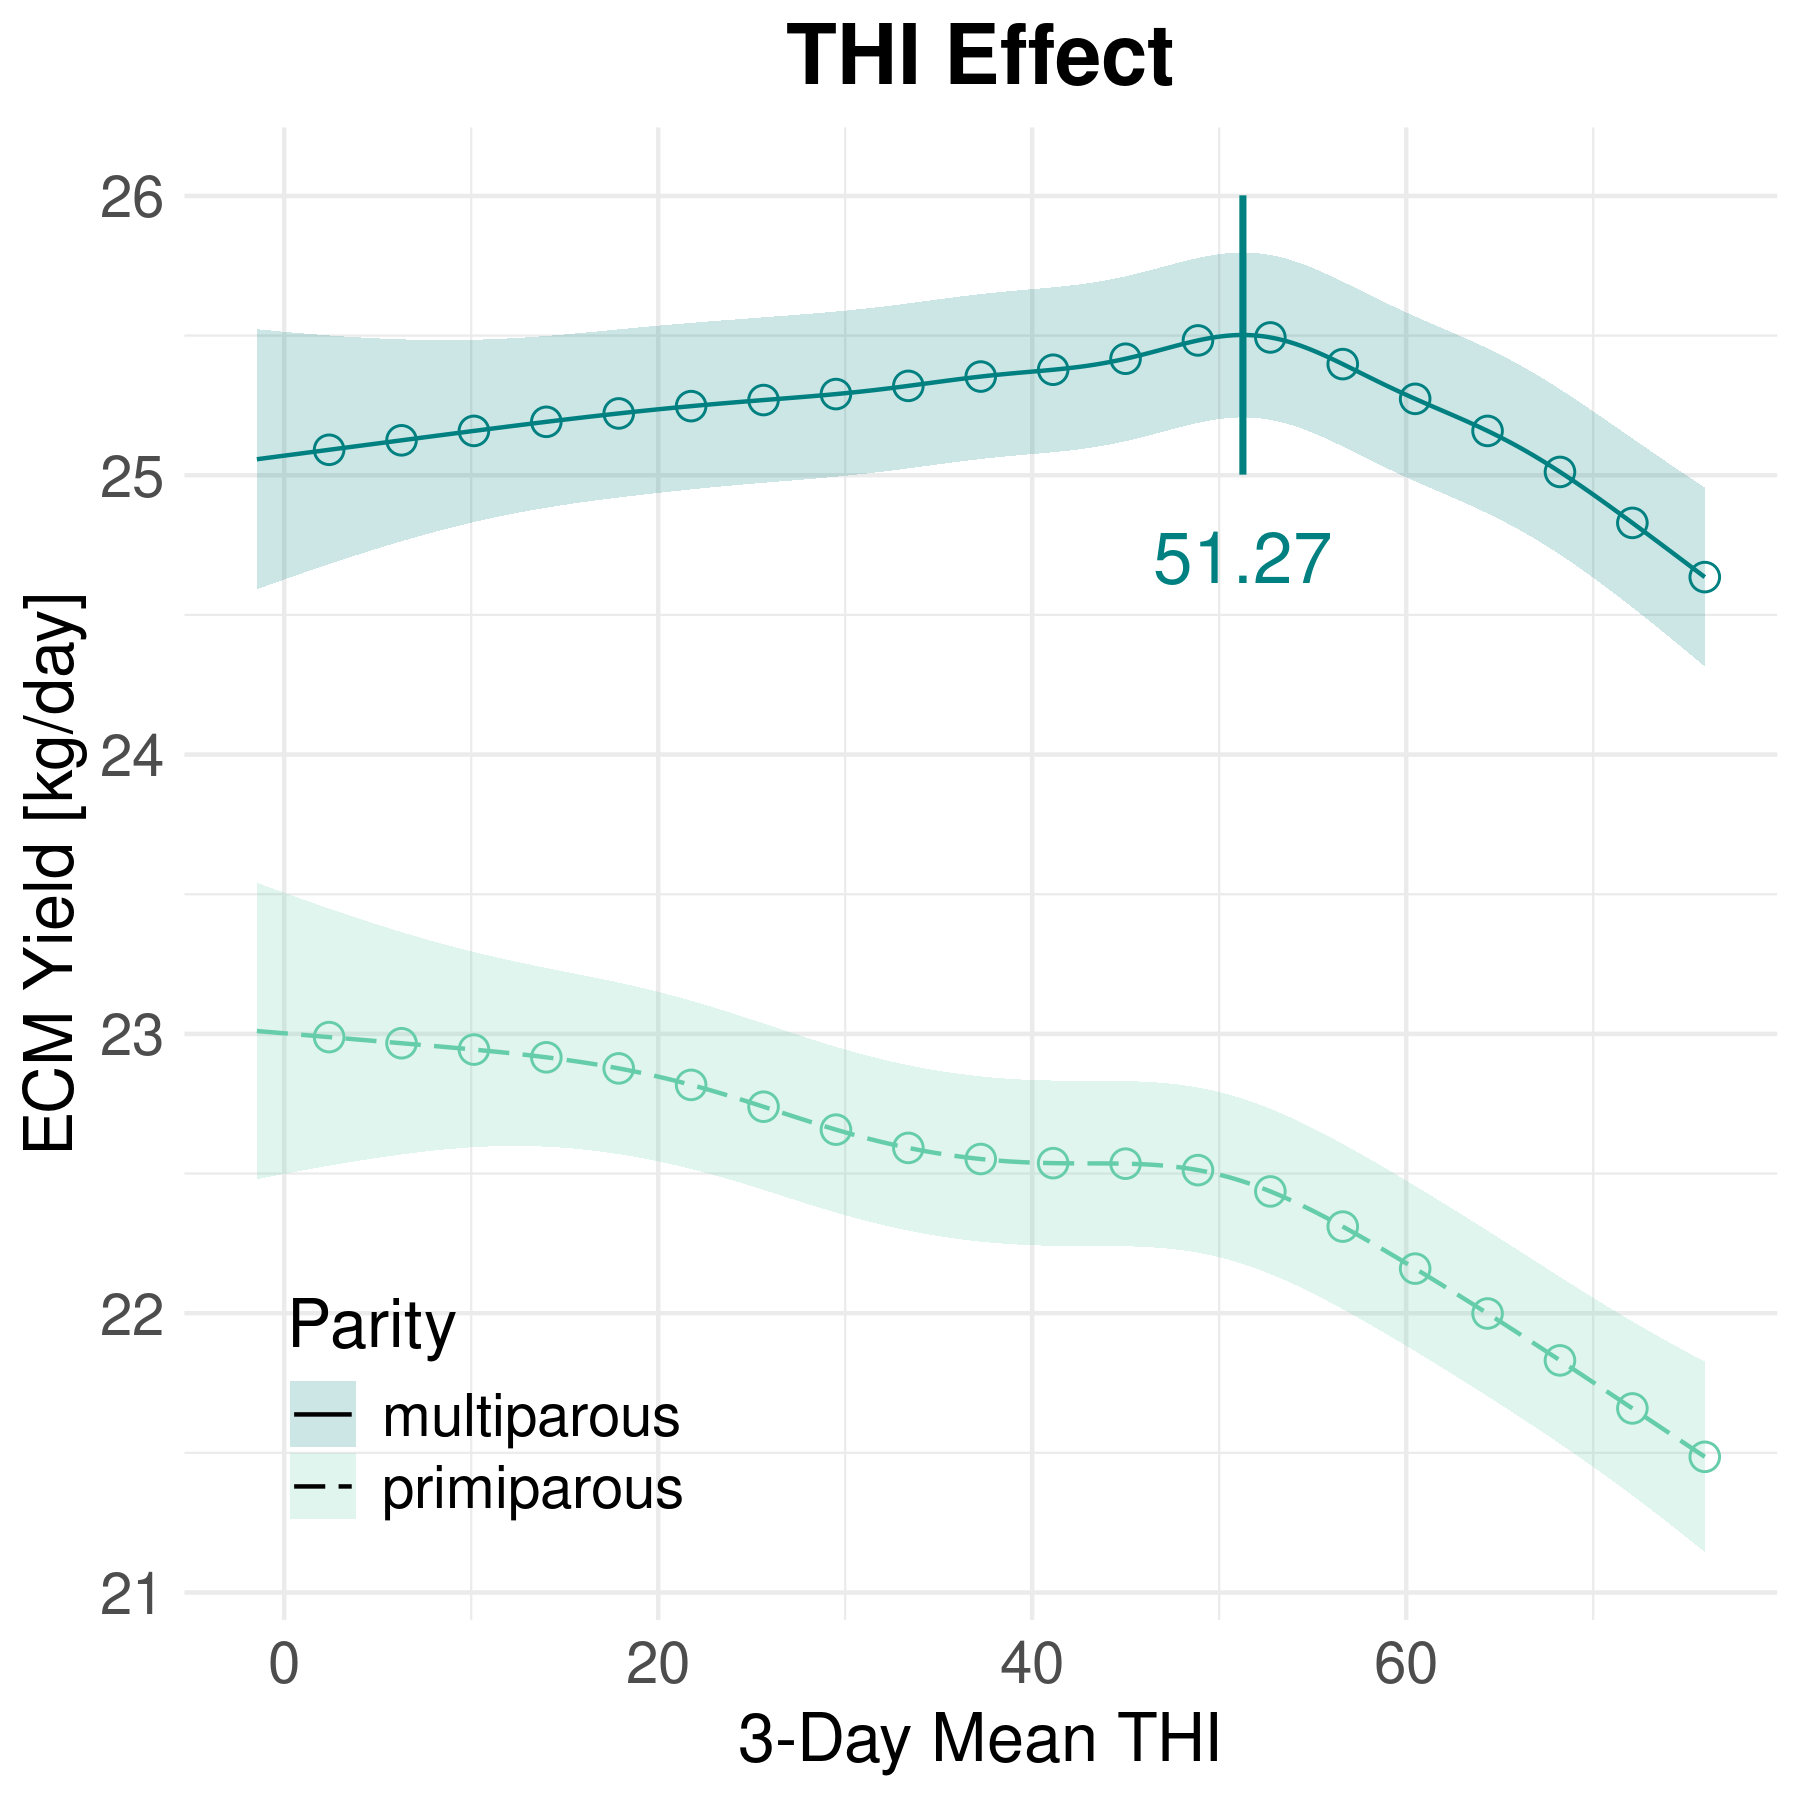
| parityprimiparous | -2.9261 | 0.0097 | -302.9145 | \( < 0.0001 \) |
| year1983 | 2.1332 | 0.6325 | 3.3729 | 0.0007 |
| year1984 | 2.6187 | 0.7871 | 3.3272 | 0.0009 |
| year1985 | 3.1363 | 0.8022 | 3.9096 | 0.0001 |
| year1986 | 3.0575 | 0.8070 | 3.7887 | 0.0002 |
| year1987 | 2.8836 | 0.8204 | 3.5151 | 0.0004 |
| year1988 | 2.8943 | 0.8284 | 3.4937 | 0.0005 |
| year1989 | 3.5360 | 0.8366 | 4.2266 | \( < 0.0001 \) |
| year1990 | 3.8219 | 0.8595 | 4.4468 | \( < 0.0001 \) |
| year1991 | 4.1067 | 0.8646 | 4.7501 | \( < 0.0001 \) |
| year1992 | 4.2306 | 0.8658 | 4.8865 | \( < 0.0001 \) |
| year1993 | 4.2739 | 0.8685 | 4.9207 | \( < 0.0001 \) |
| year1994 | 4.0330 | 0.8796 | 4.5849 | \( < 0.0001 \) |
| year1995 | 4.2135 | 0.8966 | 4.6996 | \( < 0.0001 \) |
| year1996 | 4.2852 | 0.9007 | 4.7578 | \( < 0.0001 \) |
| year1997 | 4.8949 | 0.9033 | 5.4190 | \( < 0.0001 \) |
| year1998 | 5.8103 | 0.9031 | 6.4340 | \( < 0.0001 \) |
| year1999 | 5.5766 | 0.9031 | 6.1749 | \( < 0.0001 \) |
| year2000 | 5.5808 | 0.9036 | 6.1764 | \( < 0.0001 \) |
| year2001 | 6.5297 | 0.9042 | 7.2213 | \( < 0.0001 \) |
| year2002 | 6.6744 | 0.8989 | 7.4254 | \( < 0.0001 \) |
| year2003 | 6.8026 | 0.8992 | 7.5648 | \( < 0.0001 \) |
| year2004 | 7.4423 | 0.9029 | 8.2427 | \( < 0.0001 \) |
| year2005 | 7.4488 | 0.9029 | 8.2496 | \( < 0.0001 \) |
| year2006 | 7.5081 | 0.9031 | 8.3140 | \( < 0.0001 \) |
| year2007 | 7.4430 | 0.9024 | 8.2480 | \( < 0.0001 \) |
| year2008 | 7.9538 | 0.9030 | 8.8083 | \( < 0.0001 \) |
| year2009 | 8.0856 | 0.9036 | 8.9479 | \( < 0.0001 \) |
| year2010 | 8.0415 | 0.9072 | 8.8641 | \( < 0.0001 \) |
| year2011 | 8.3067 | 0.9179 | 9.0496 | \( < 0.0001 \) |
| year2012 | 8.7580 | 0.9302 | 9.4156 | \( < 0.0001 \) |
| year2013 | 8.4529 | 0.9378 | 9.0131 | \( < 0.0001 \) |
| year2014 | 8.8439 | 0.9298 | 9.5112 | \( < 0.0001 \) |
| year2015 | 8.9348 | 0.9238 | 9.6715 | \( < 0.0001 \) |
| year2016 | 9.2377 | 0.9234 | 10.0036 | \( < 0.0001 \) |
| year2017 | 9.7481 | 0.9290 | 10.4931 | \( < 0.0001 \) |
| year2018 | 10.1761 | 0.9294 | 10.9496 | \( < 0.0001 \) |
| year2019 | 10.2181 | 0.9391 | 10.8810 | \( < 0.0001 \) |
| year2020 | 10.3778 | 0.9435 | 10.9995 | \( < 0.0001 \) |
| year2021 | 10.6682 | 0.9527 | 11.1979 | \( < 0.0001 \) |
| year2022 | 10.4038 | 0.9597 | 10.8405 | \( < 0.0001 \) |
| year2023 | 10.8333 | 0.9643 | 11.2343 | \( < 0.0001 \) |
| B. smooth terms | ||||
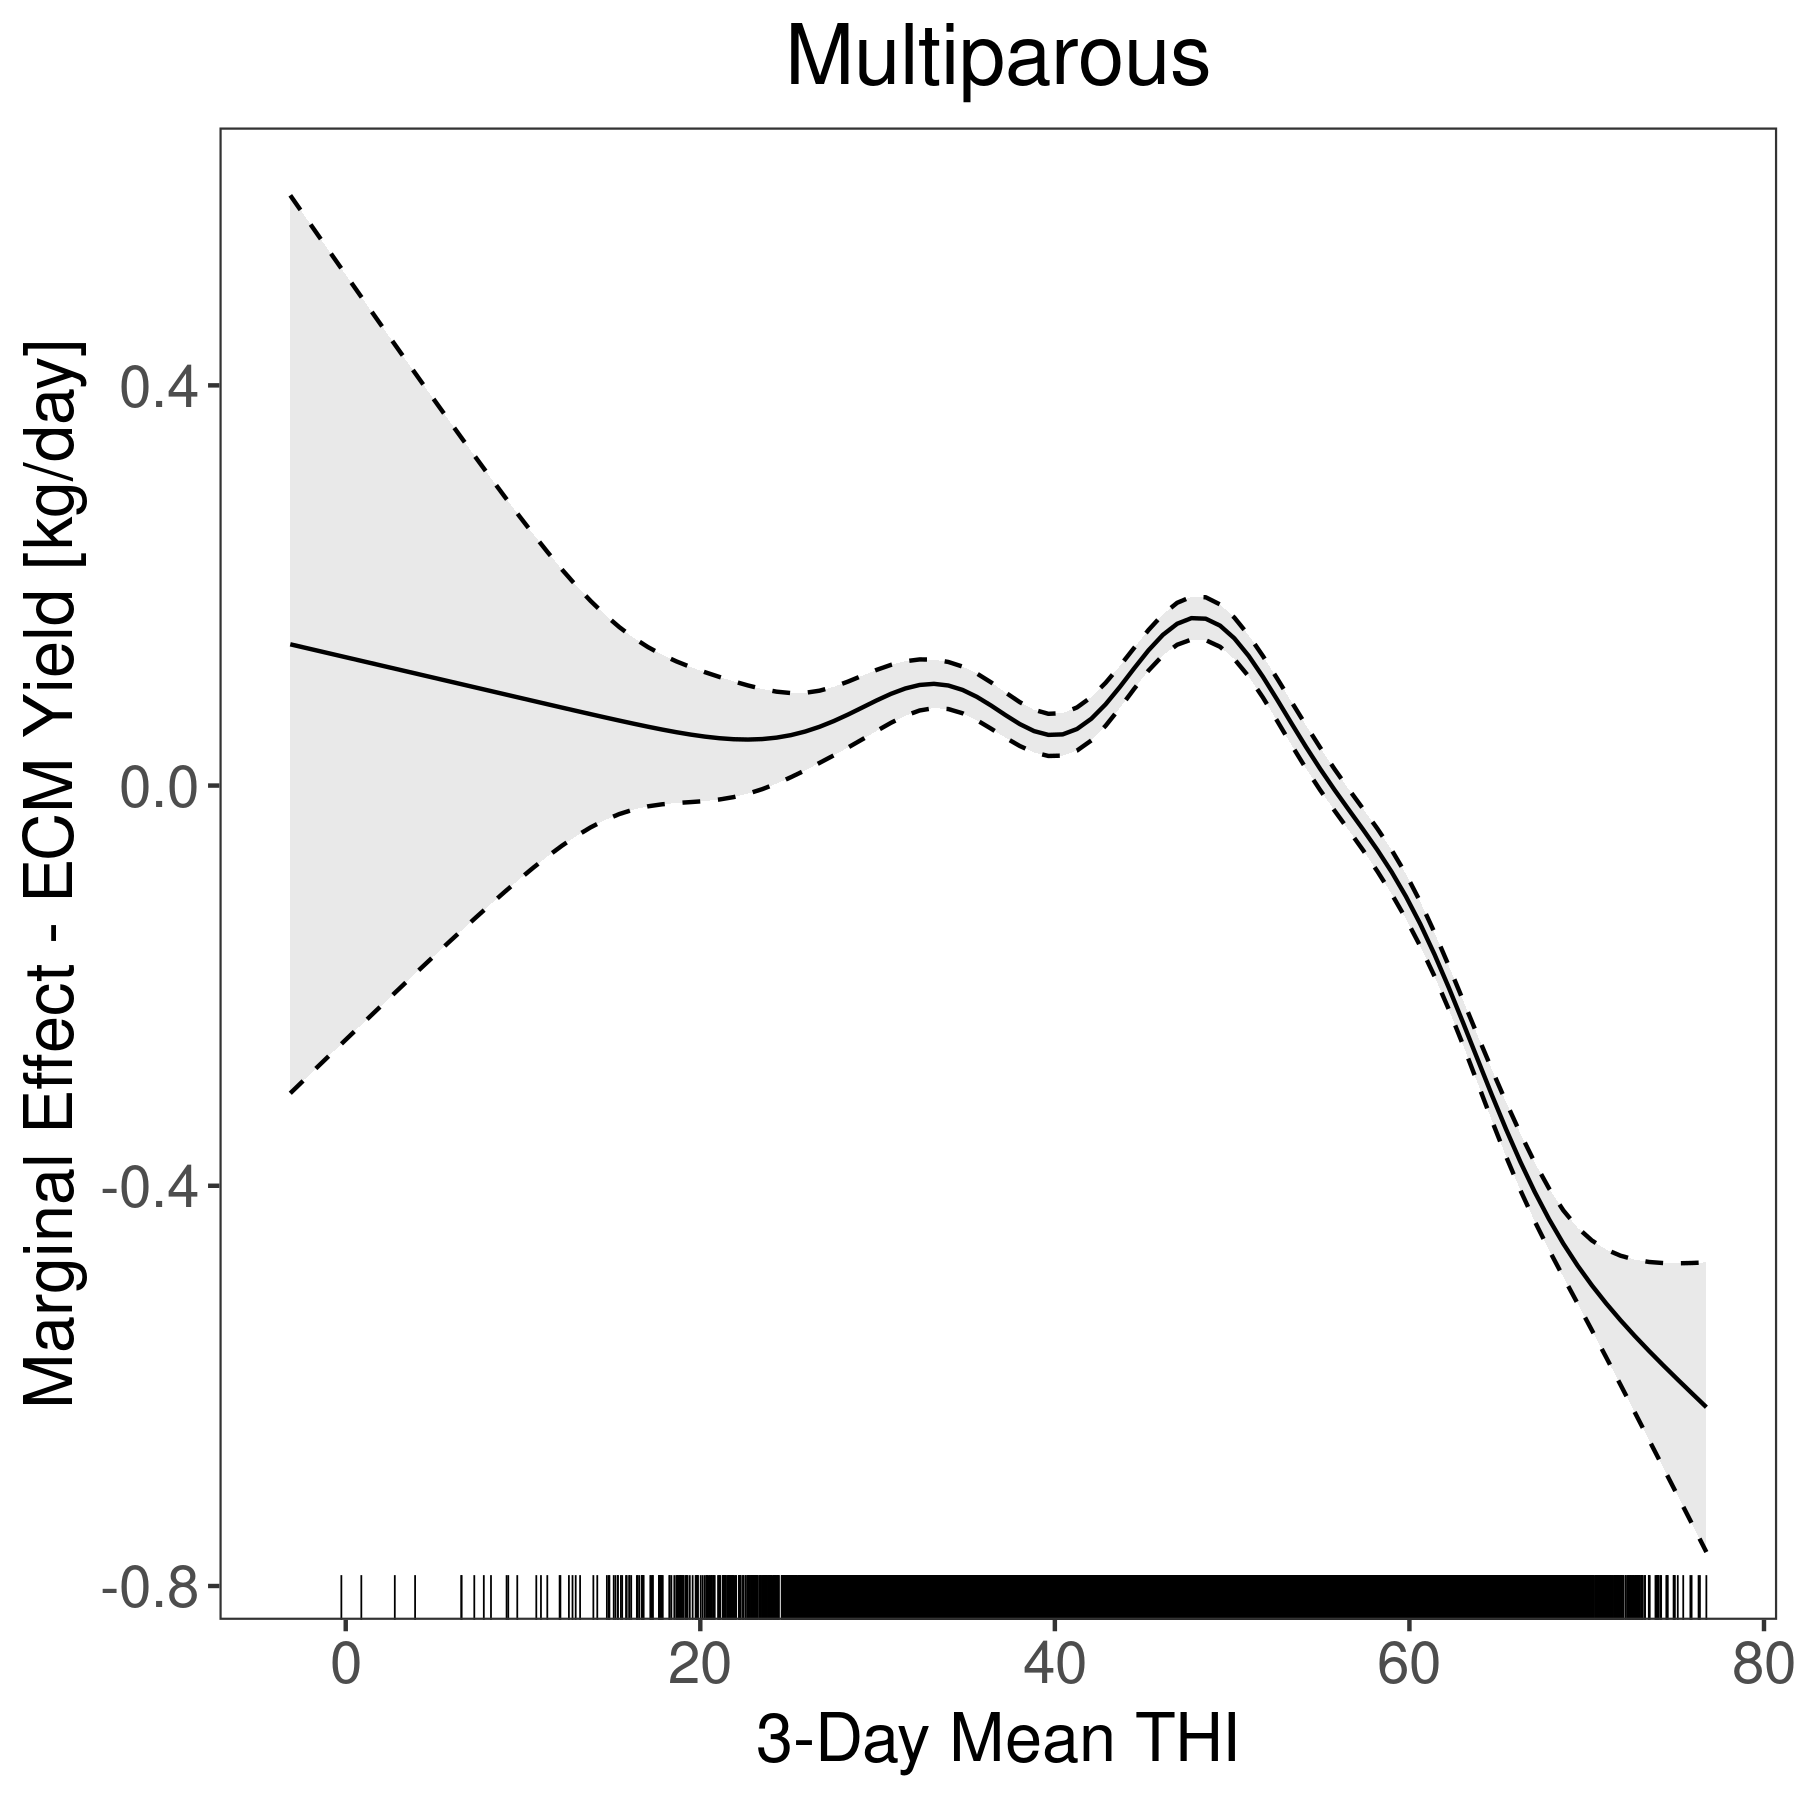
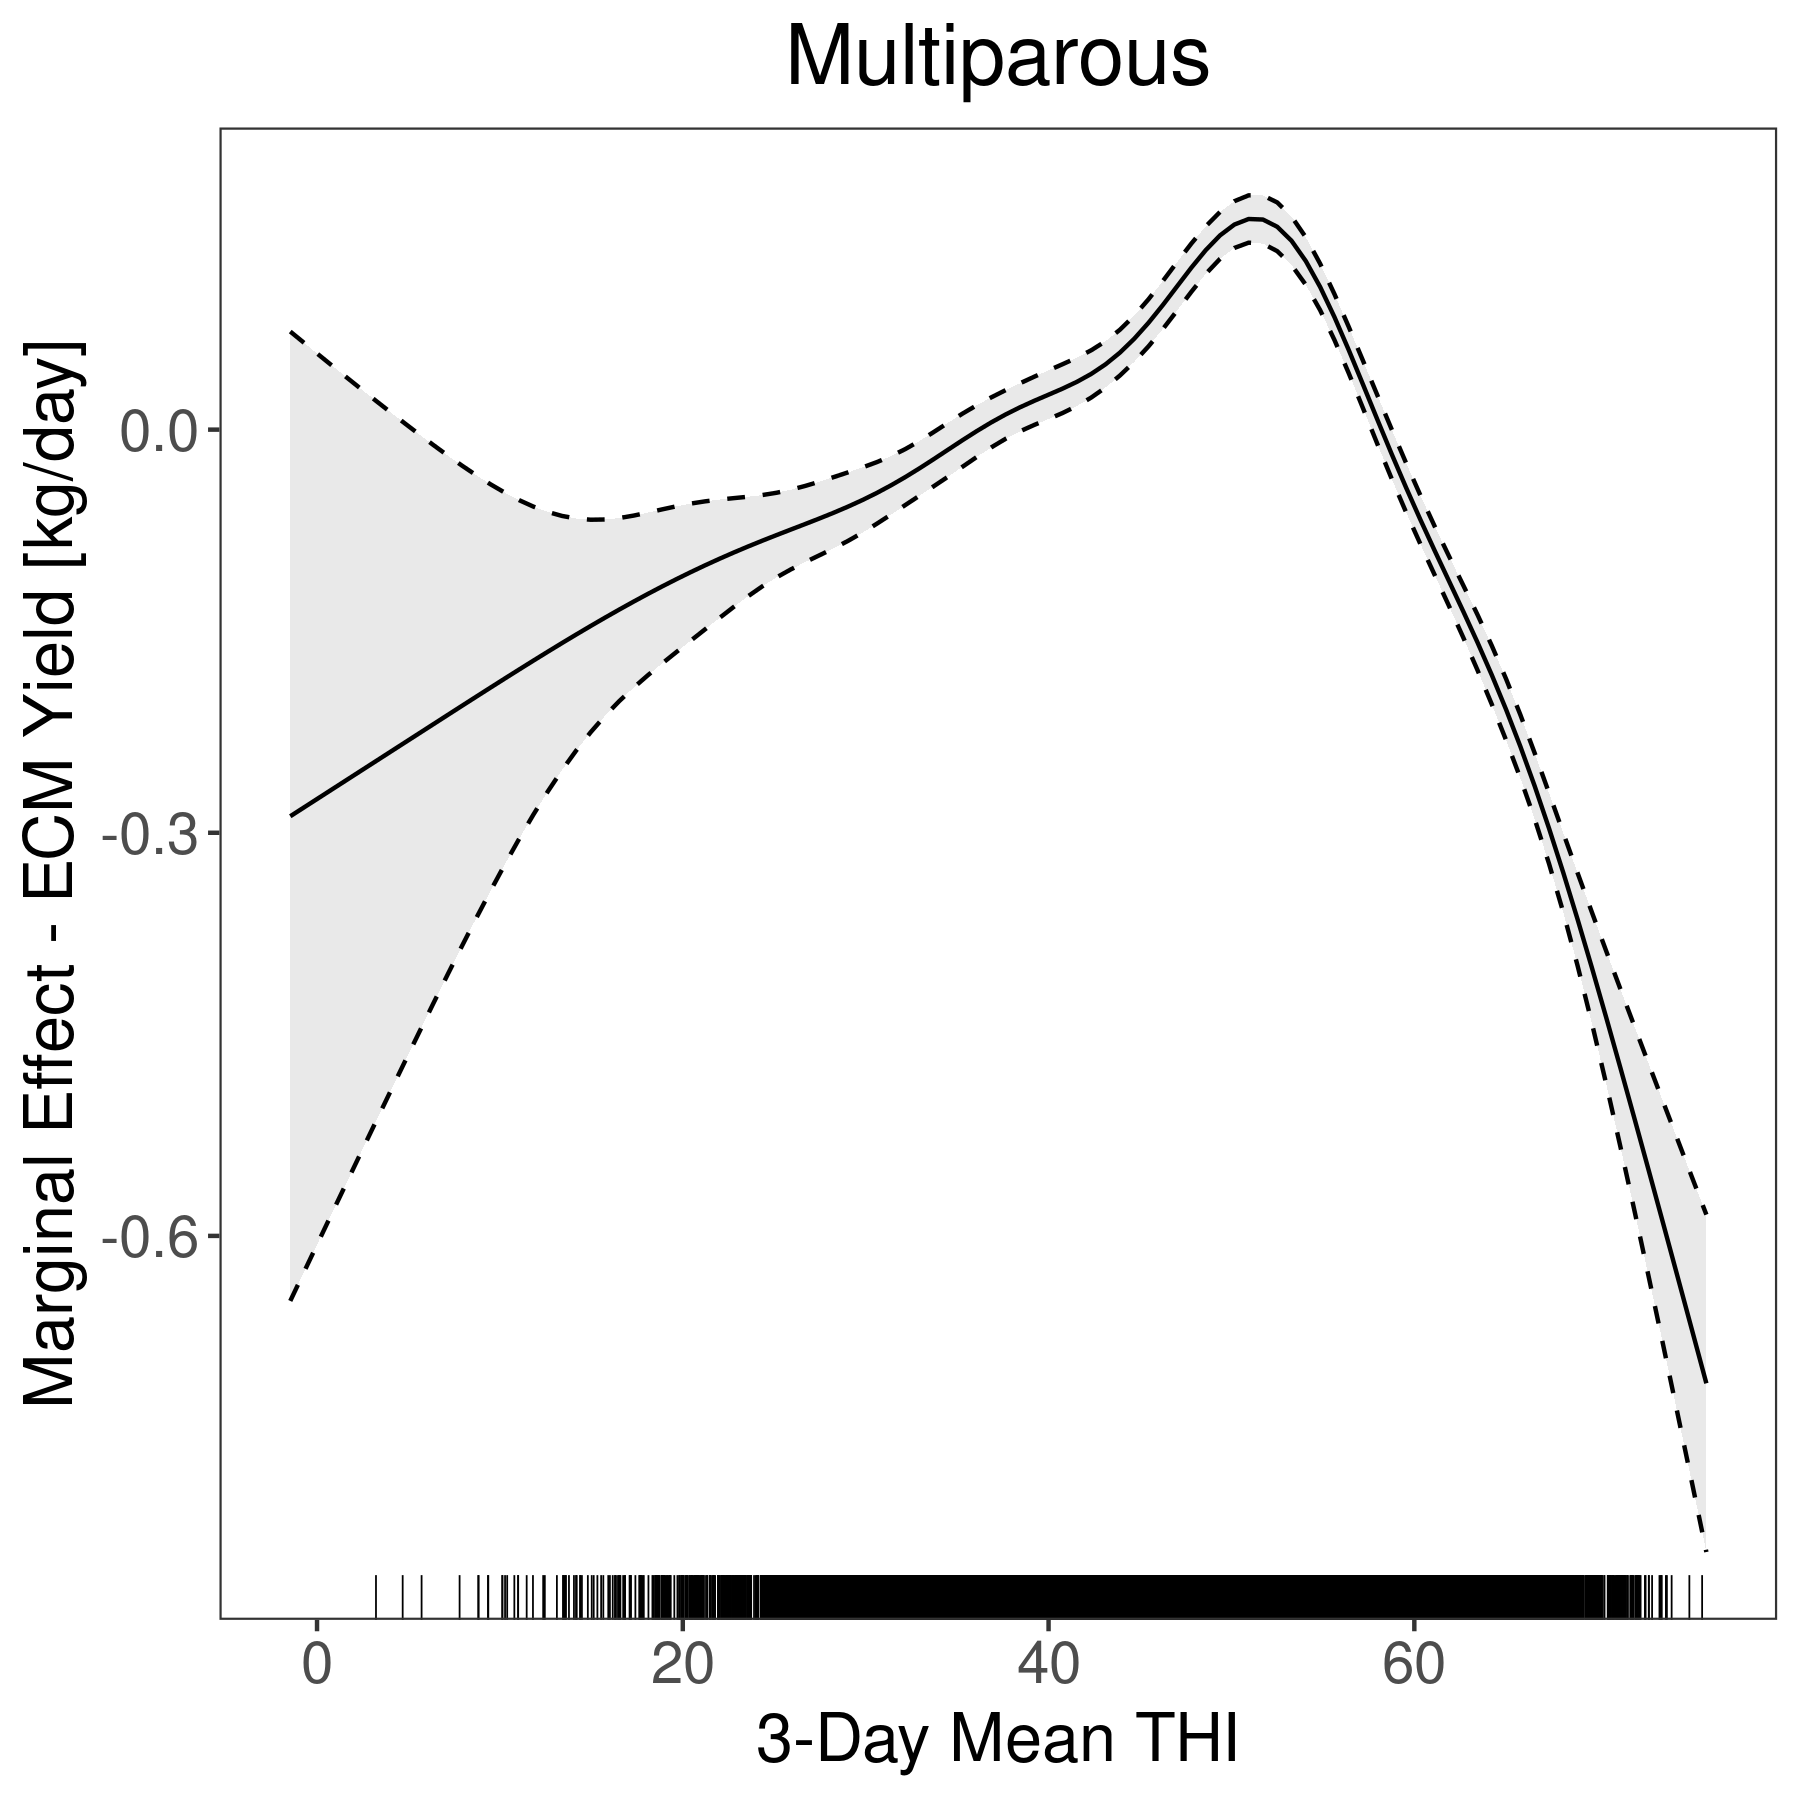
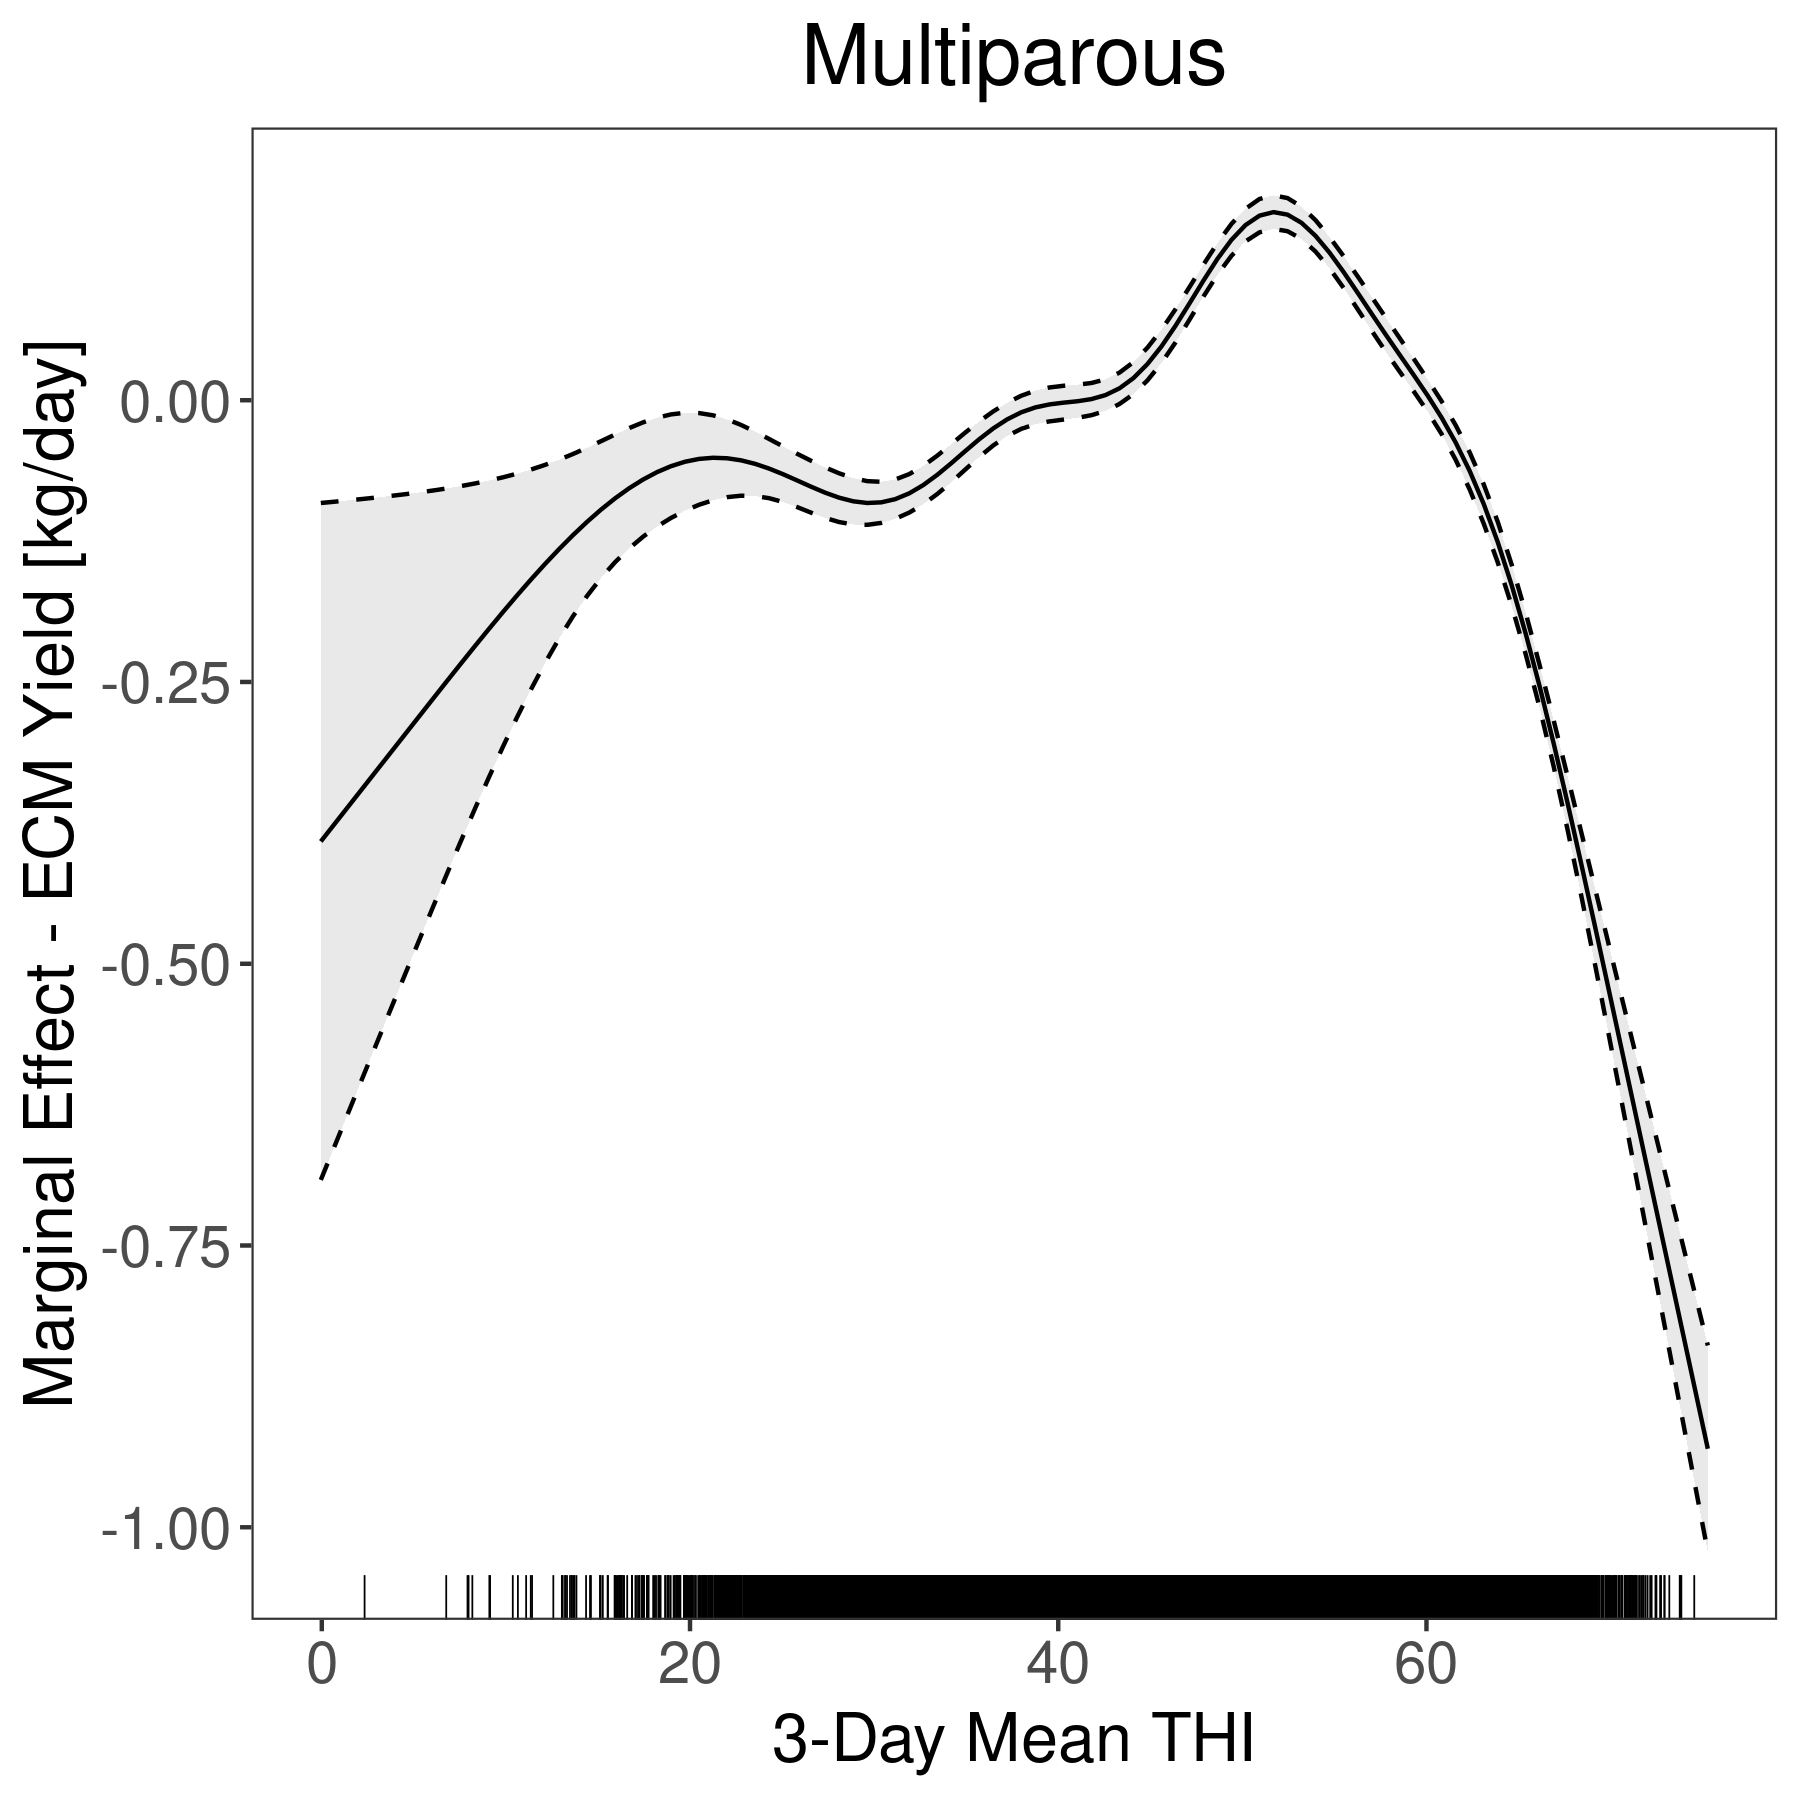
| s(thi_mean_t0_3d):paritymultiparous | 7.8150 | 7.8150 | 109.8428 | \( < 0.0001 \) |
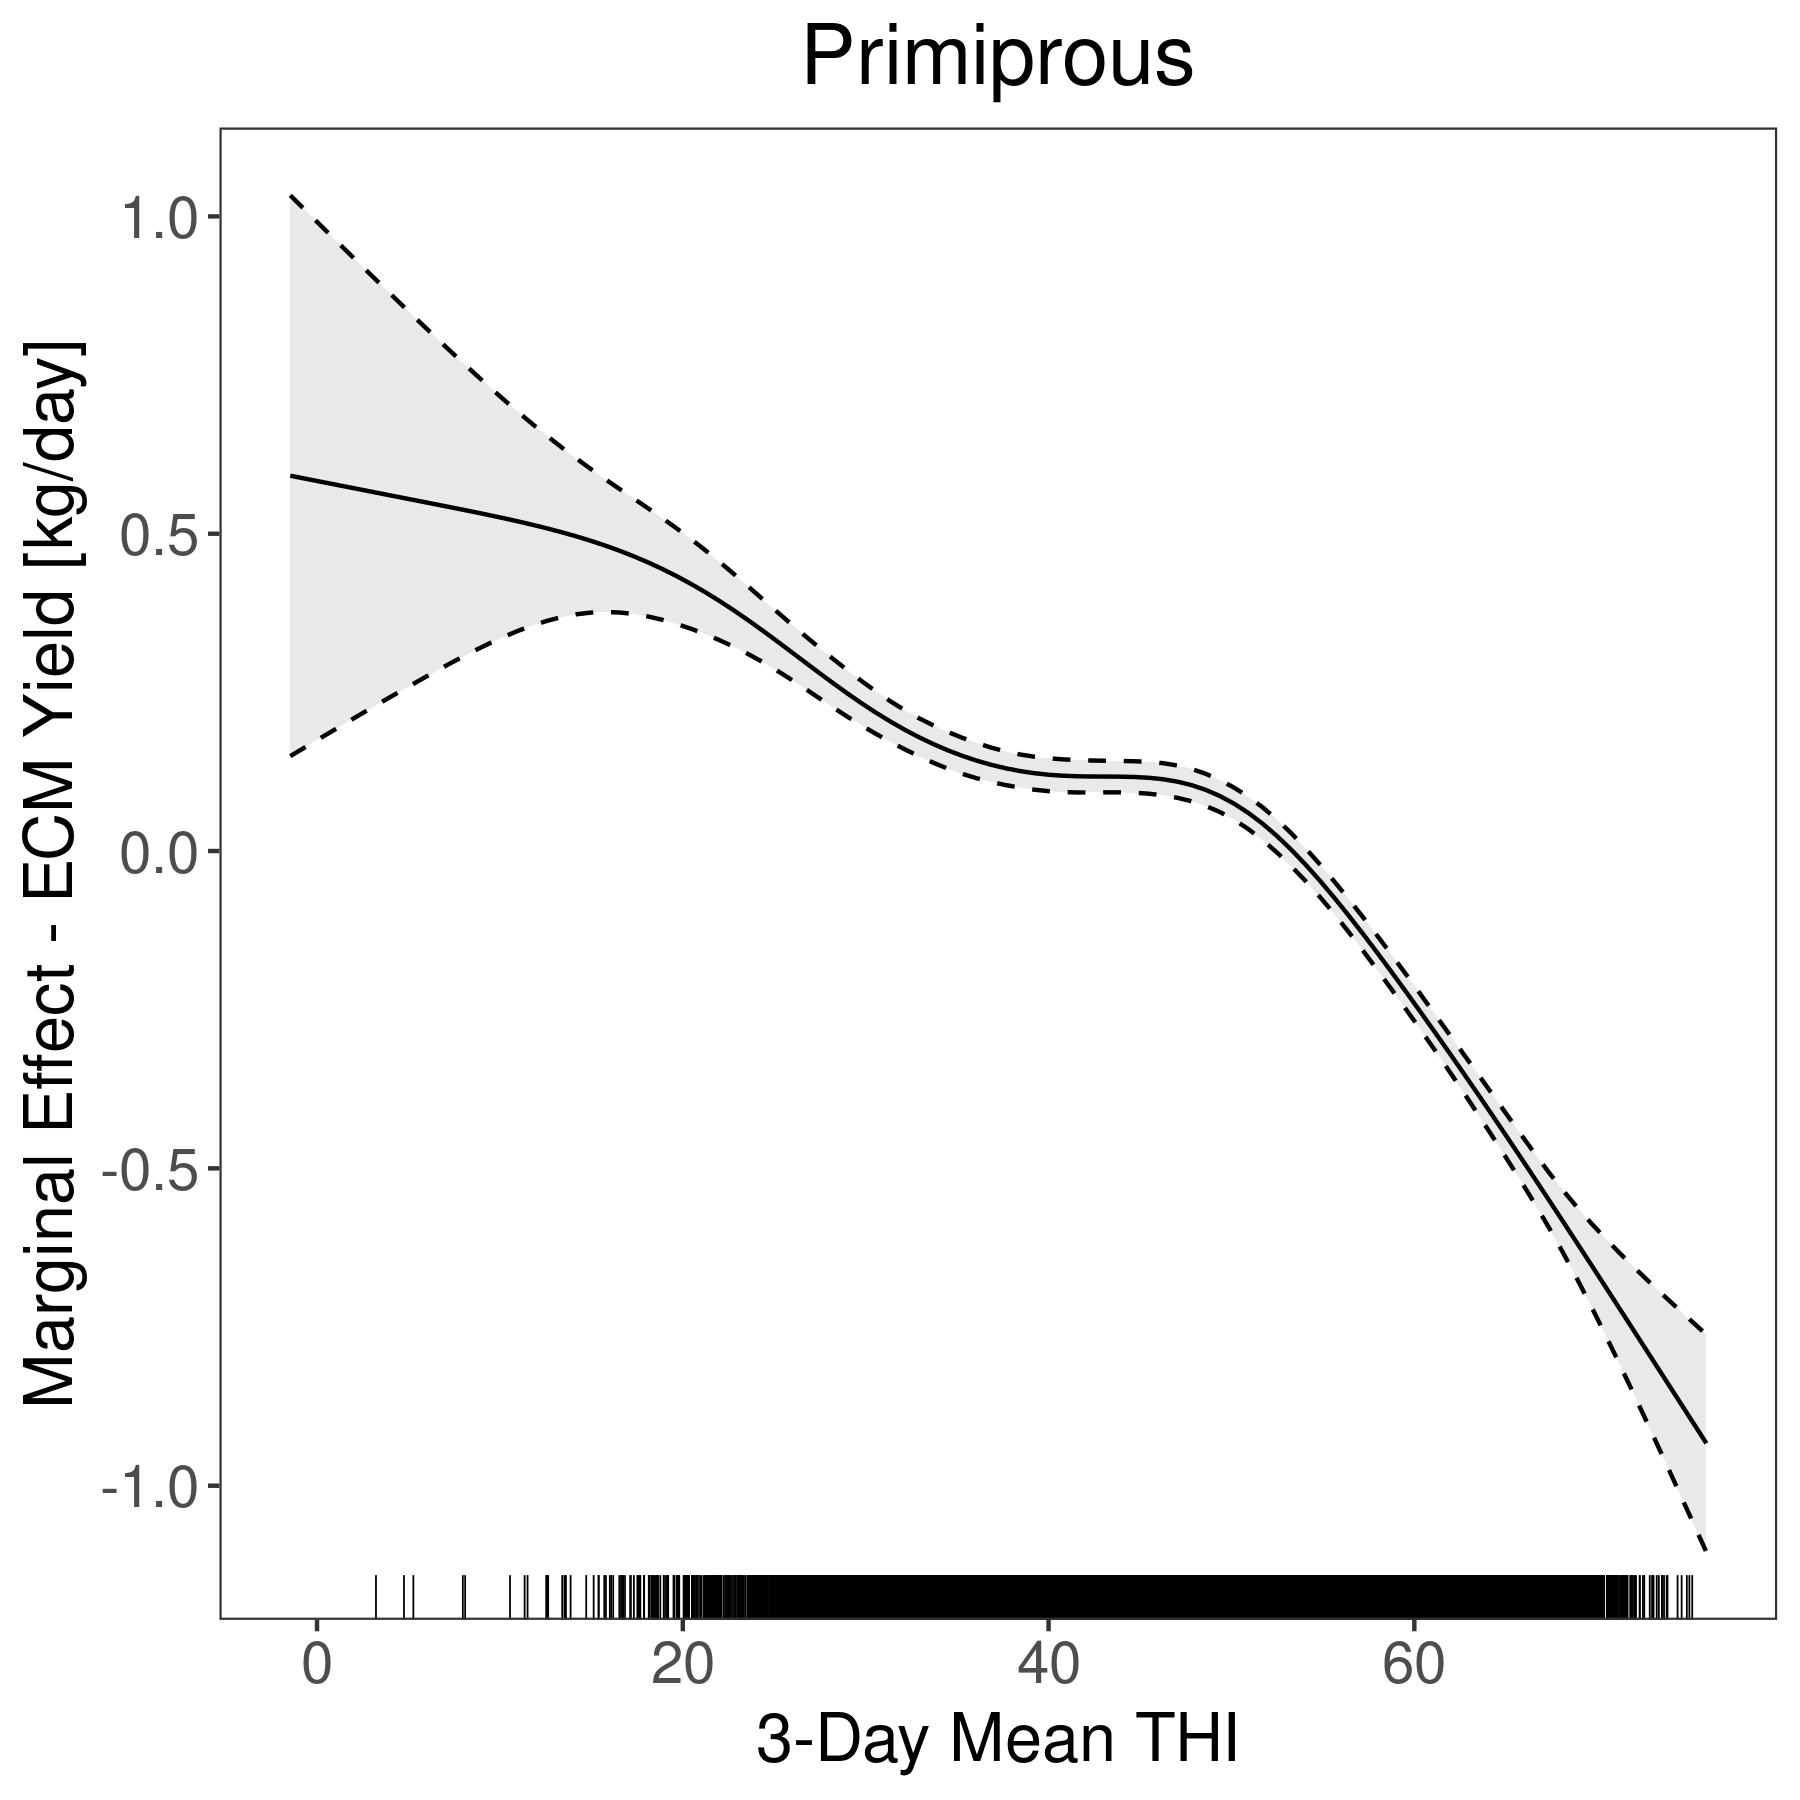
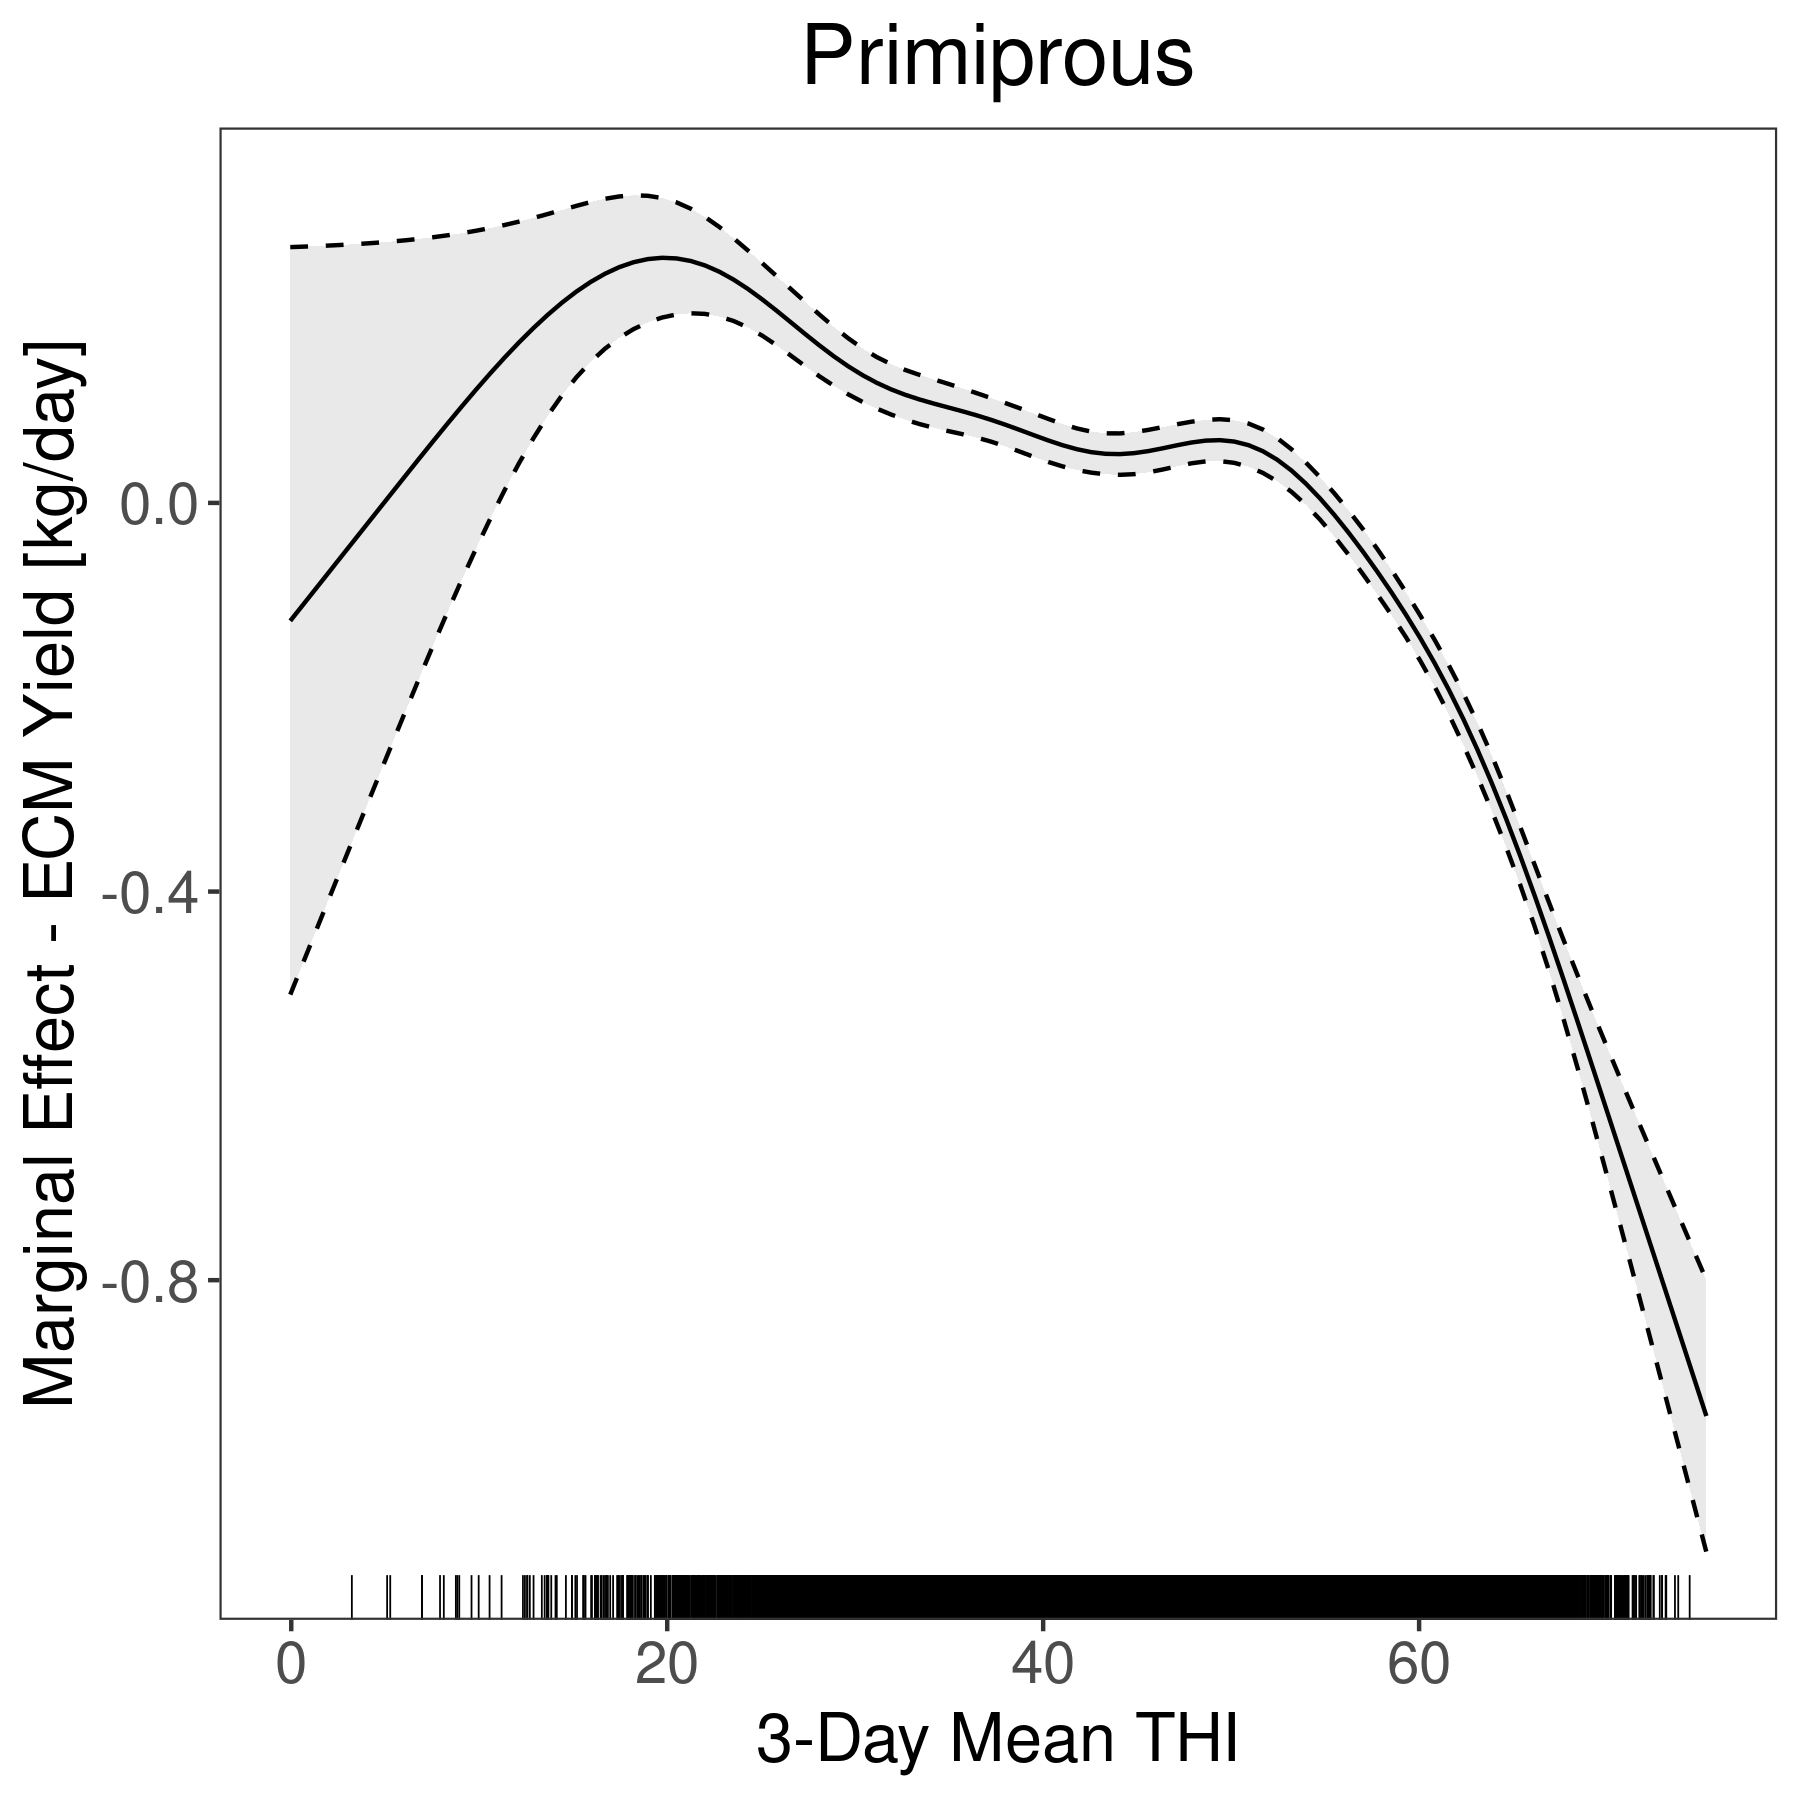
| s(thi_mean_t0_3d):parityprimiparous | 6.1480 | 6.1480 | 164.9388 | \( < 0.0001 \) |
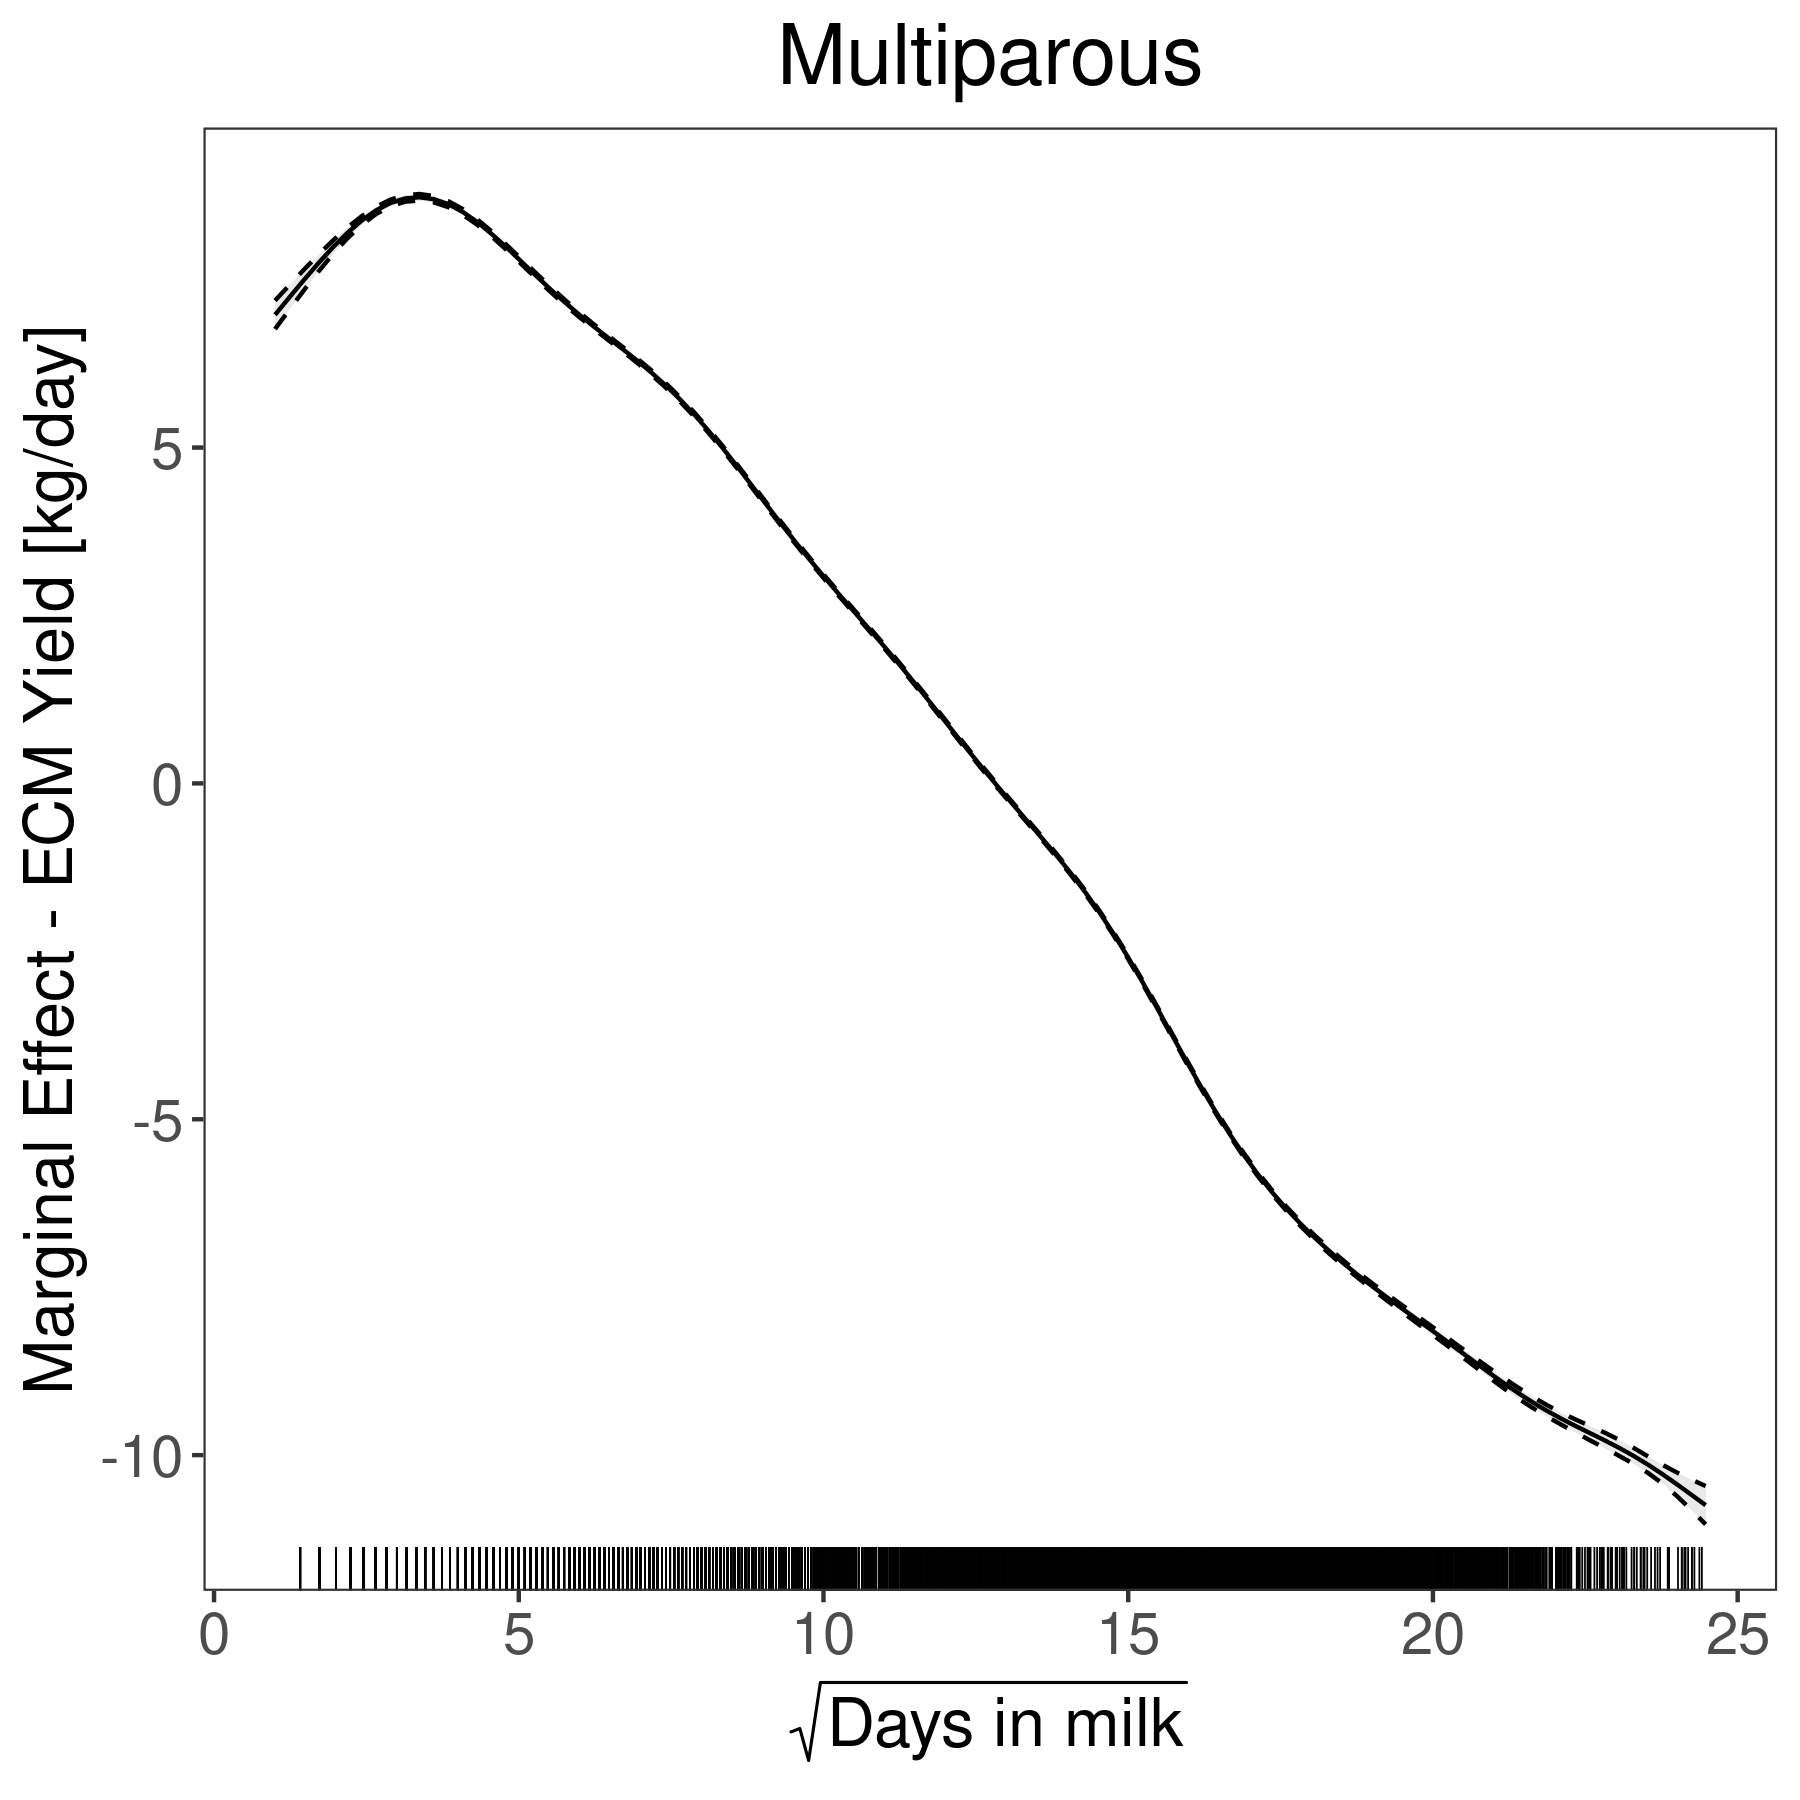
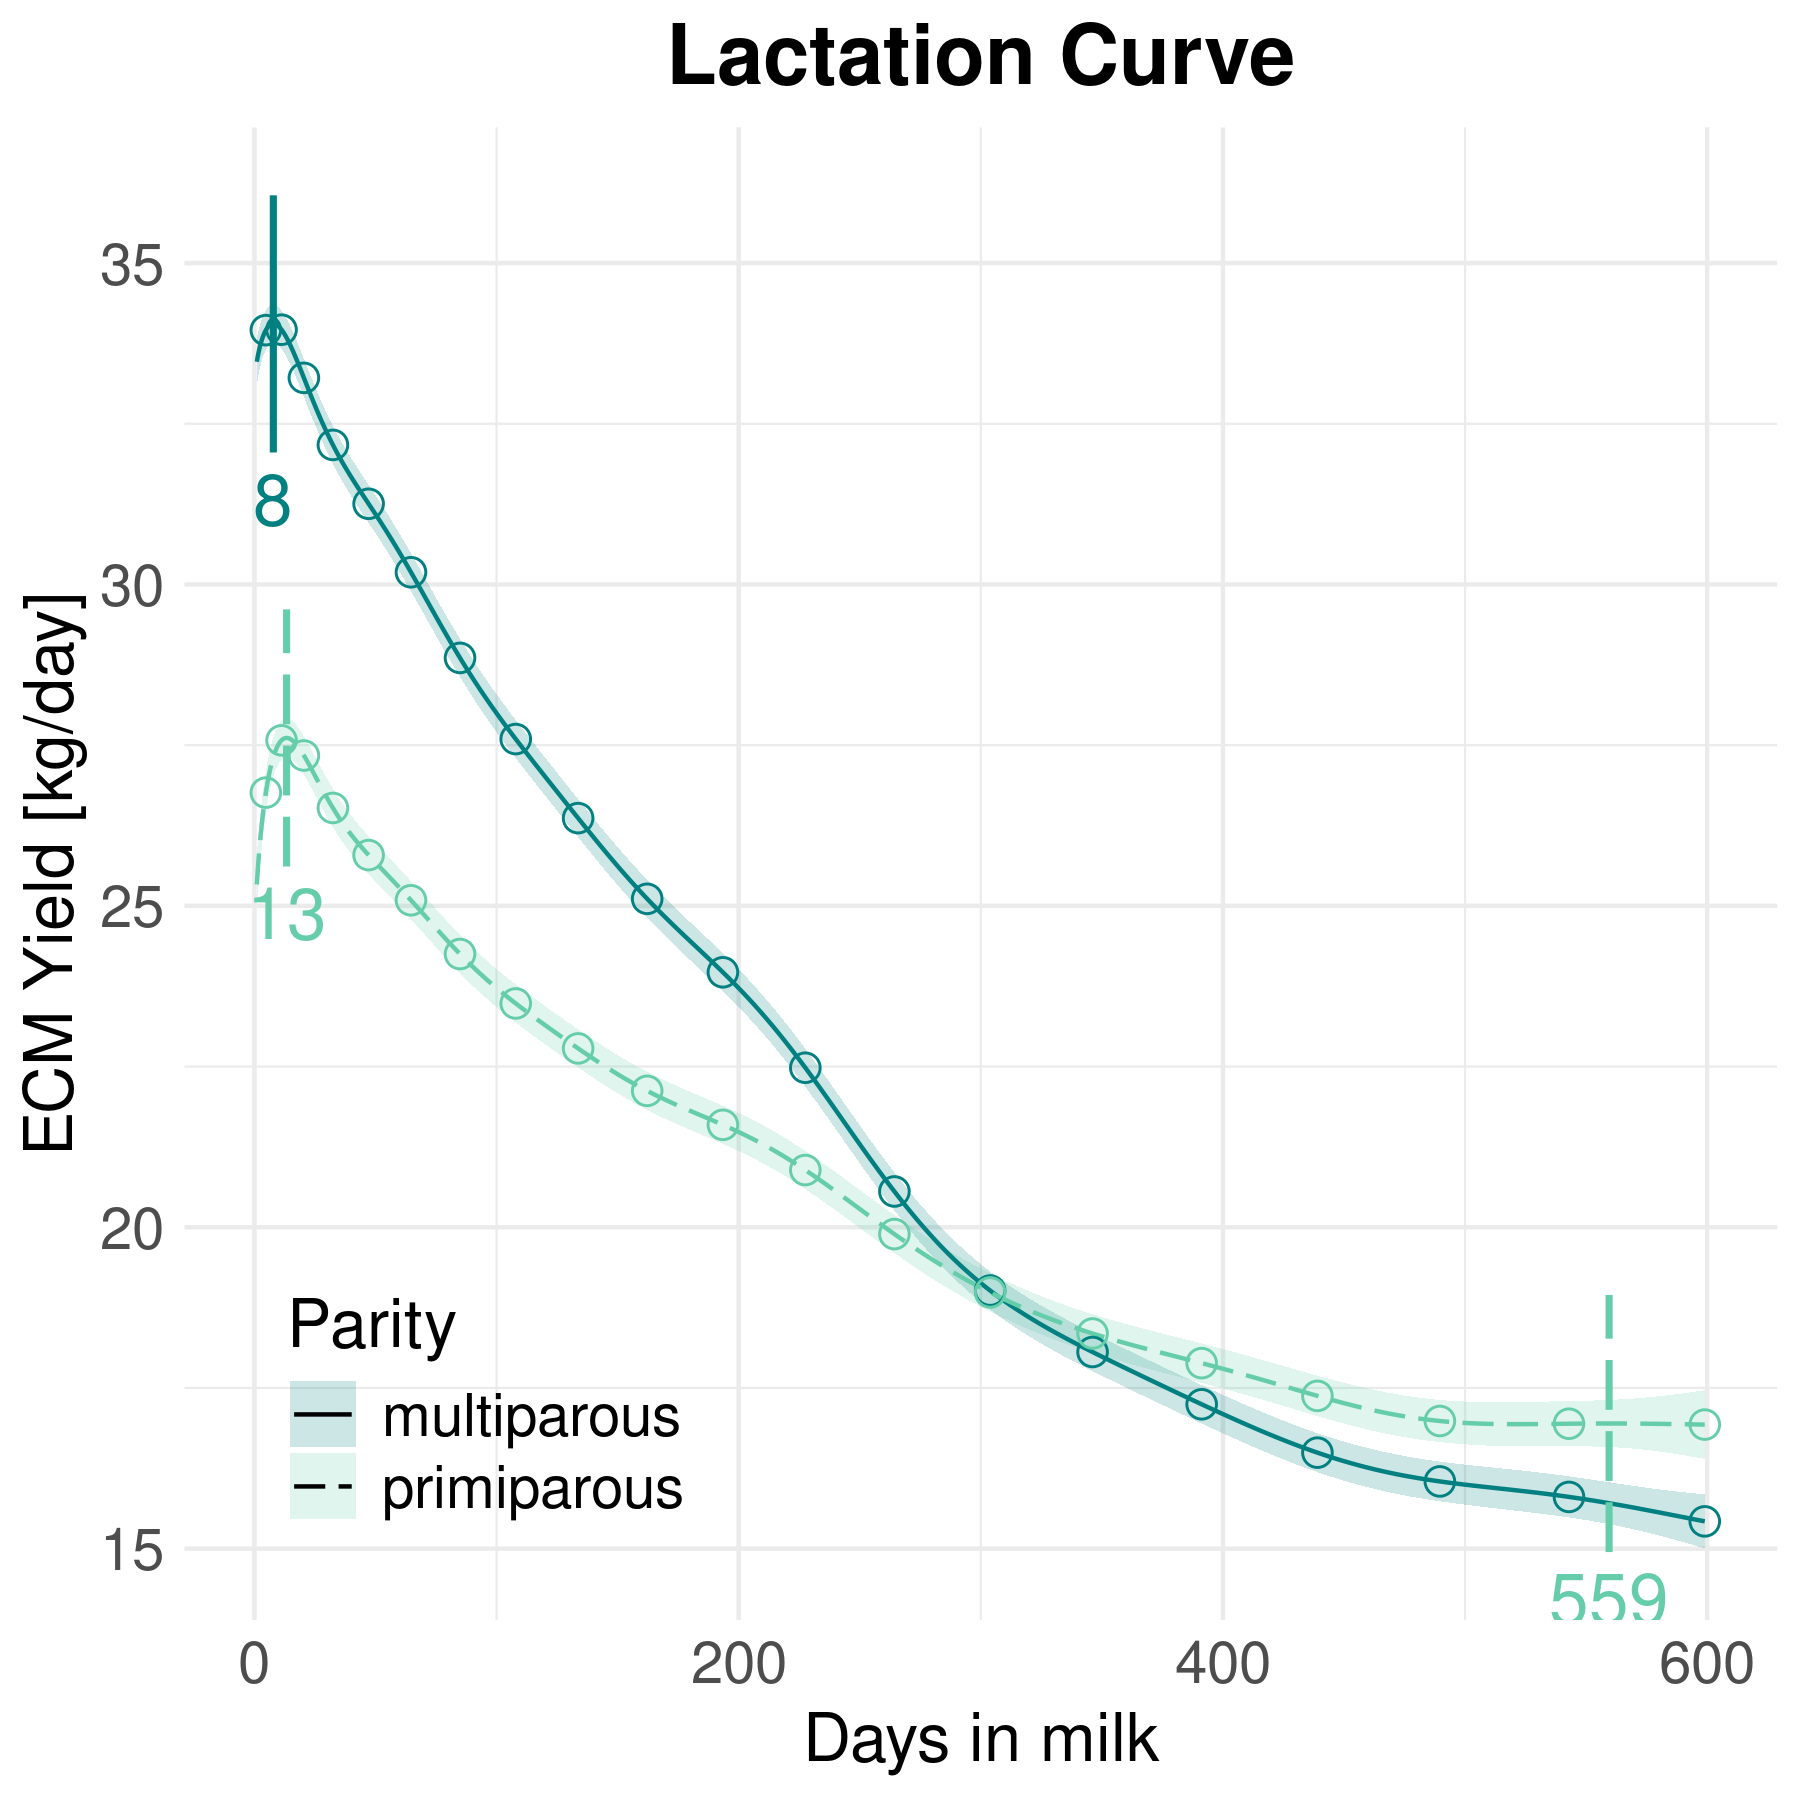
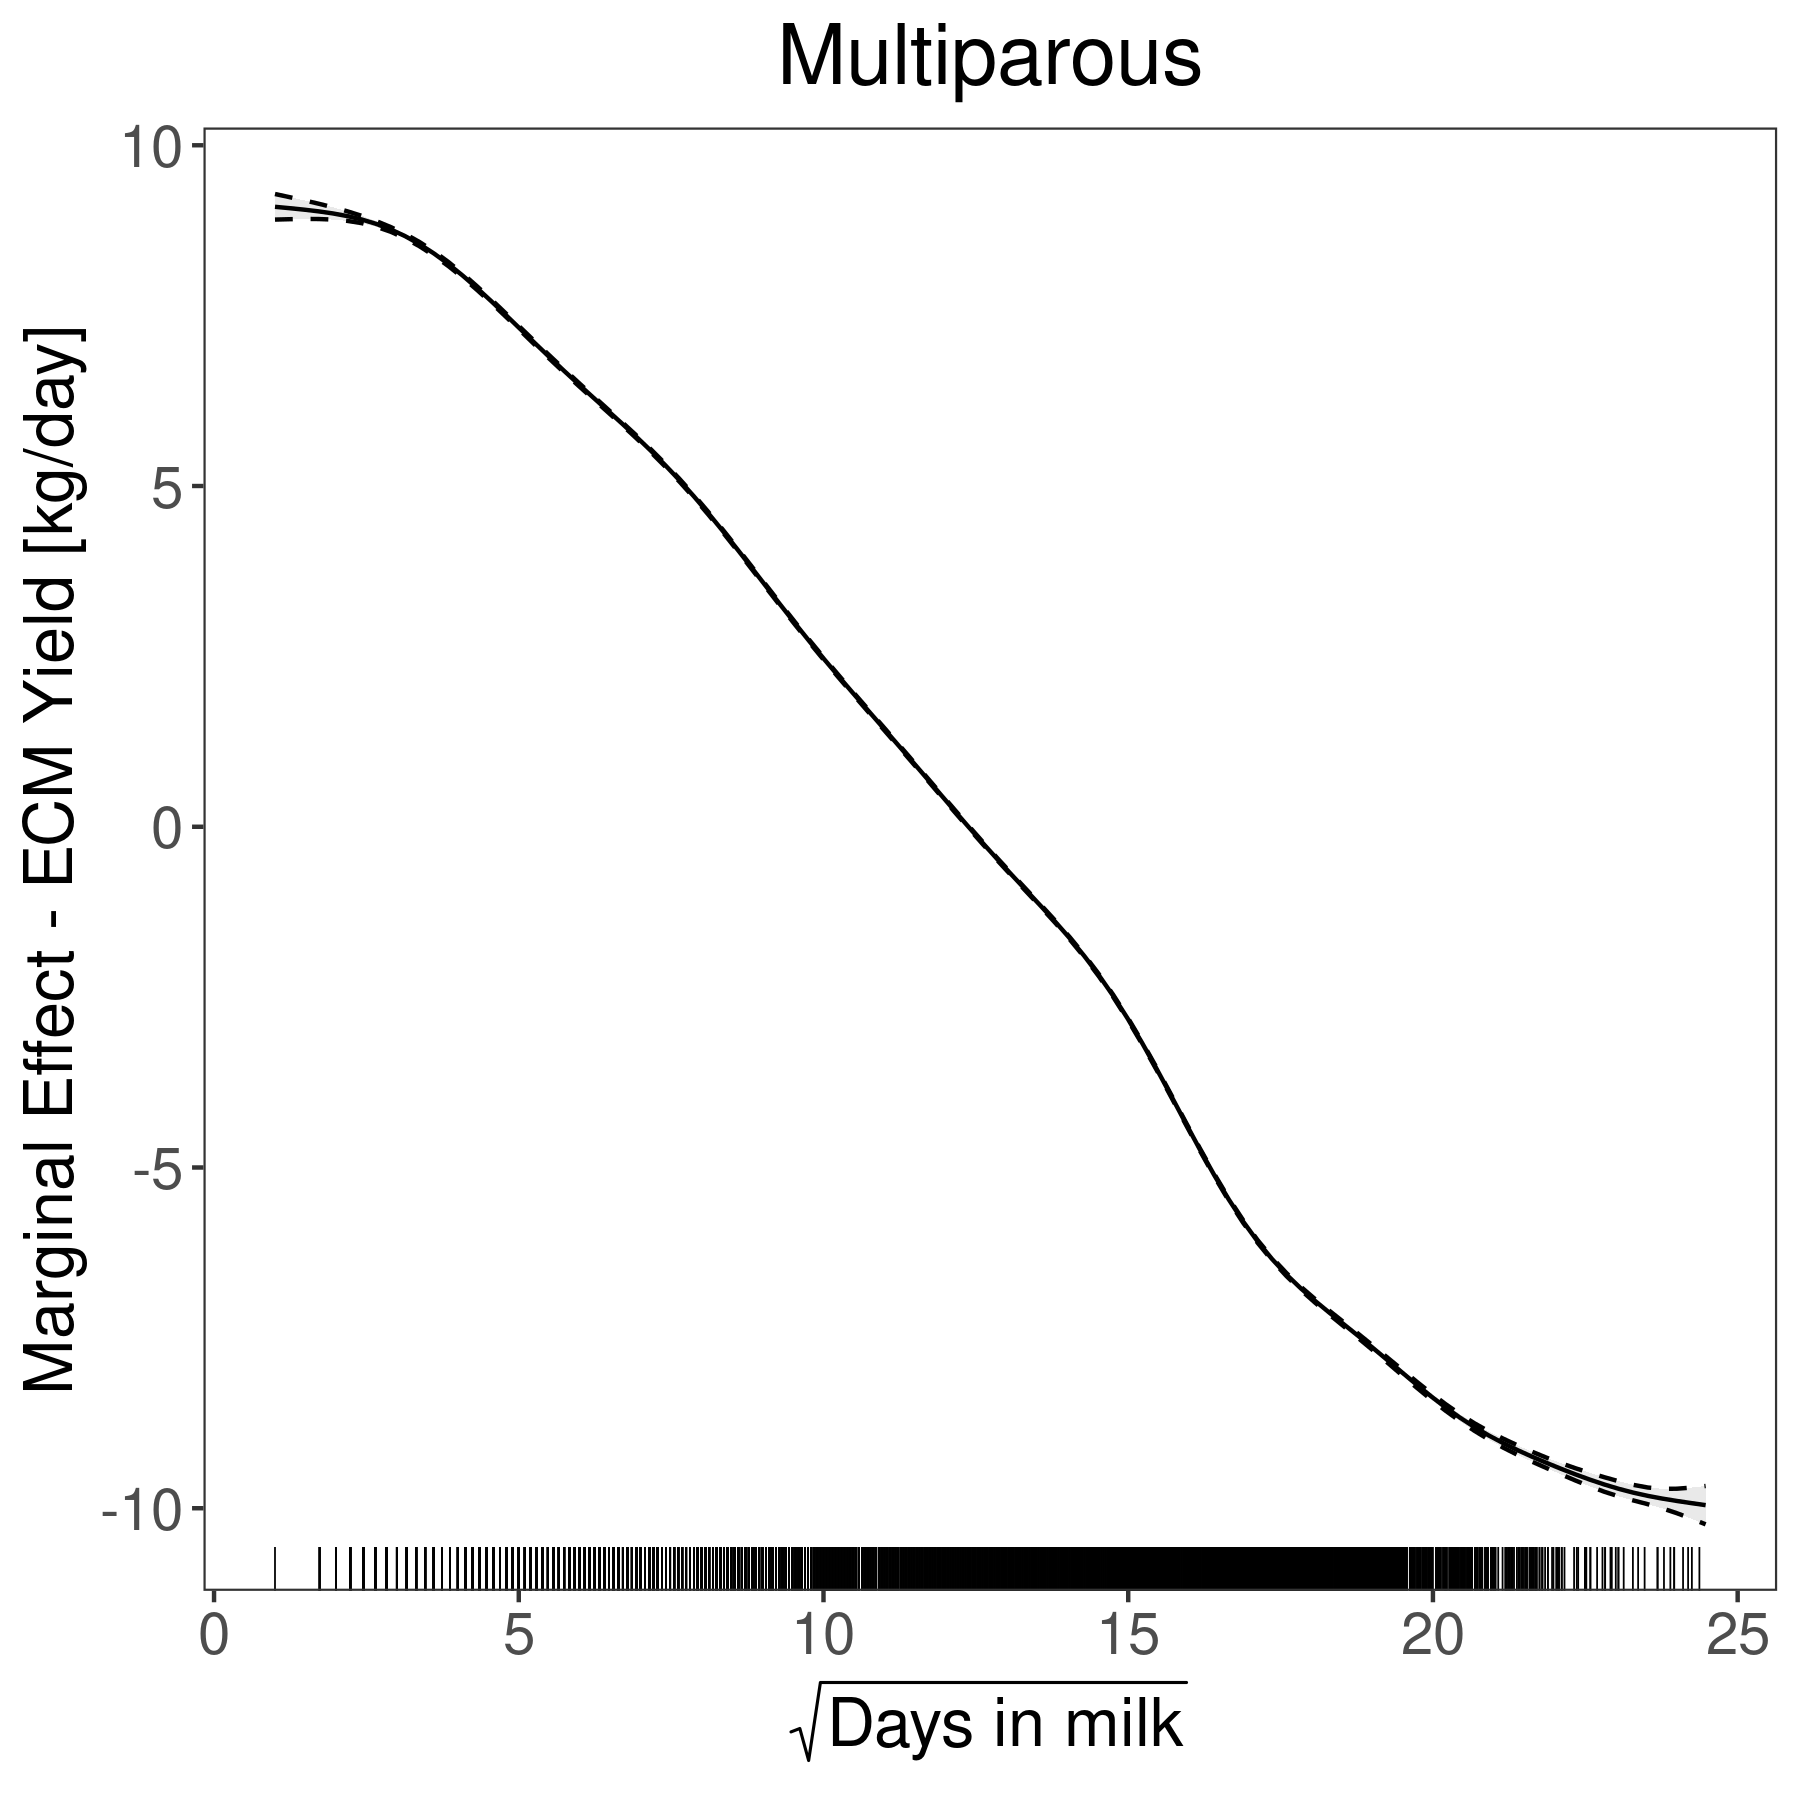
| s(days_in_milk_t):paritymultiparous | 13.6324 | 13.6324 | 91224.2937 | \( < 0.0001 \) |
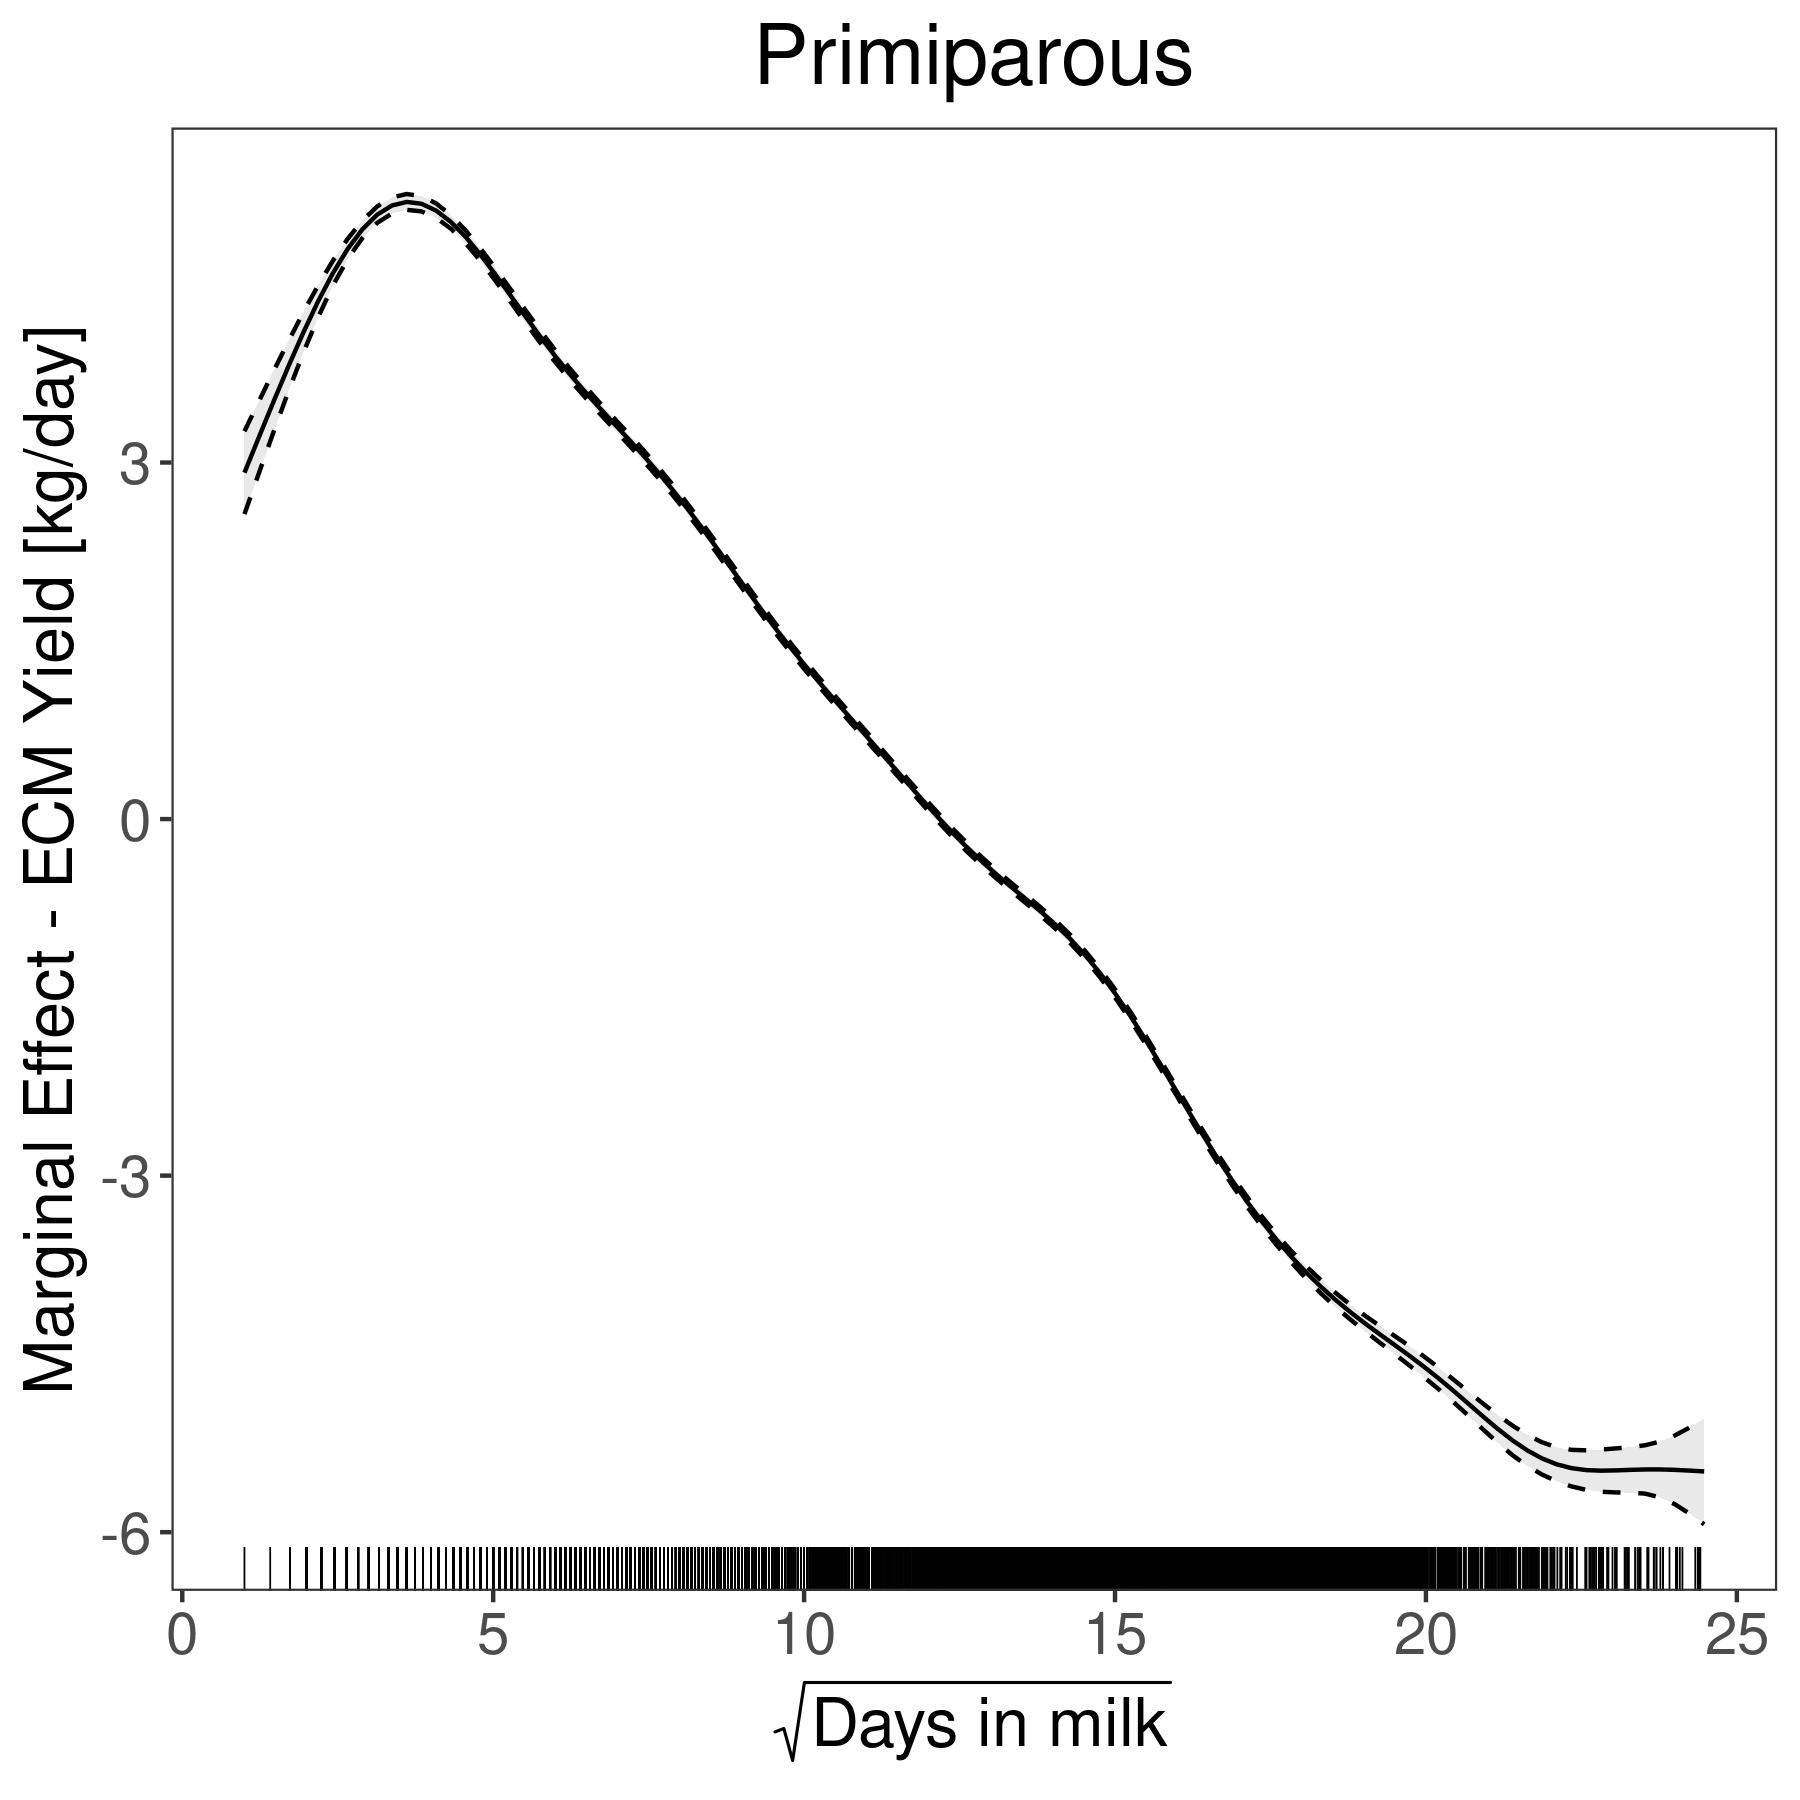
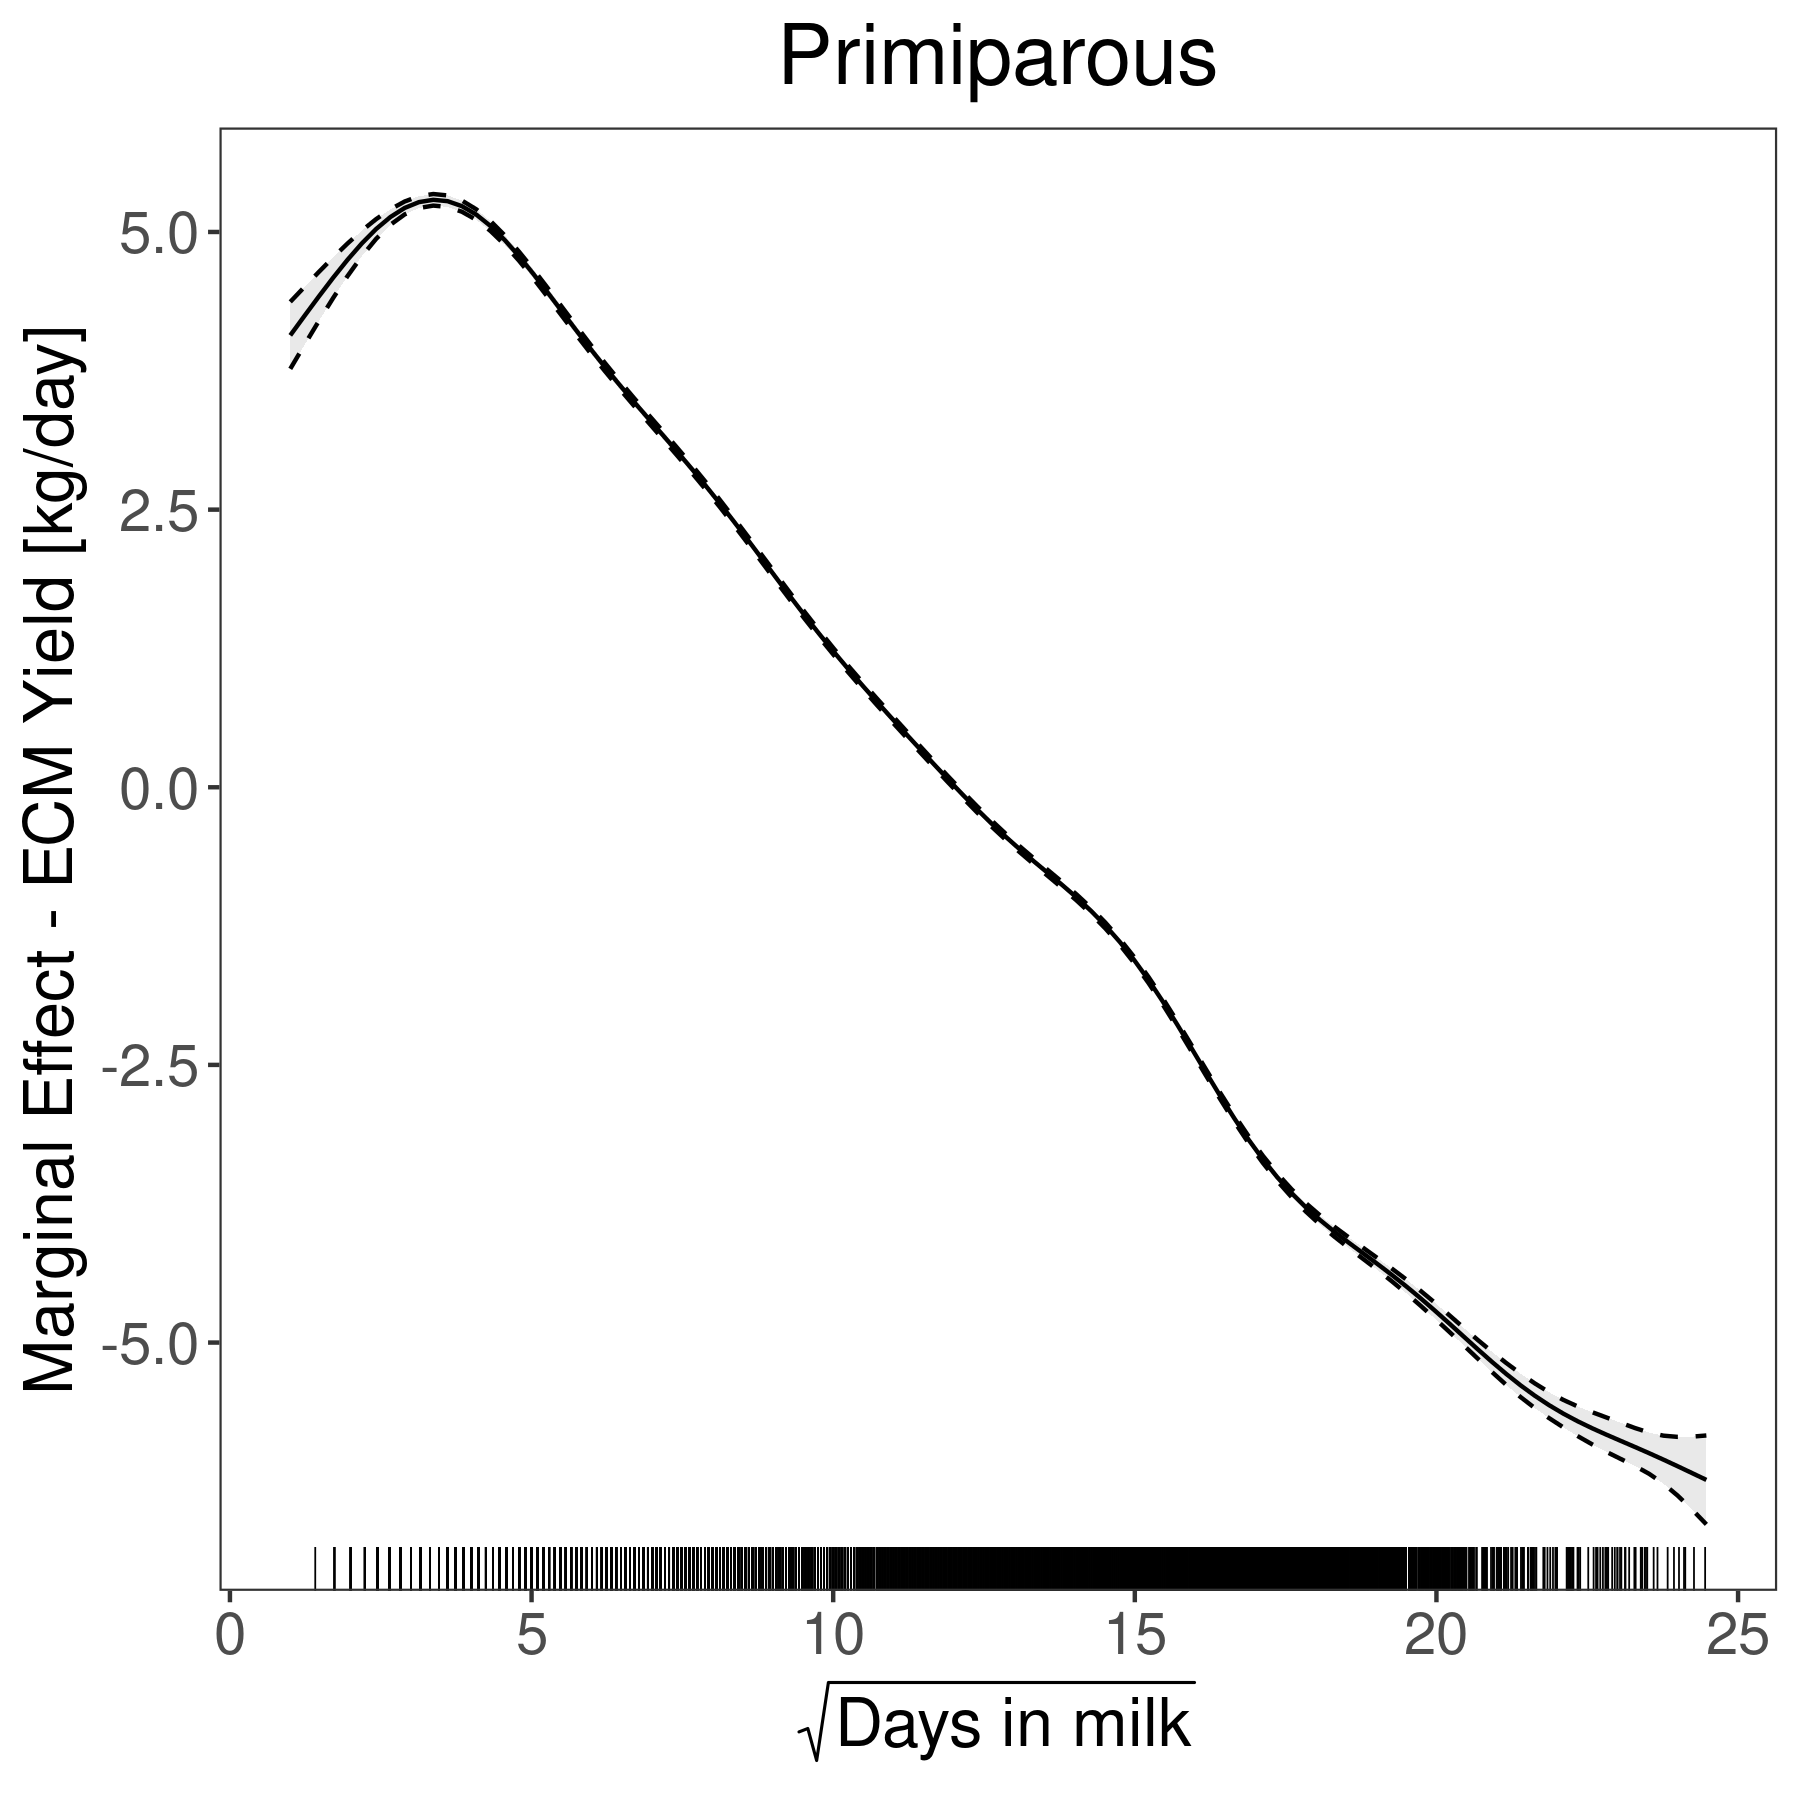
| s(days_in_milk_t):parityprimiparous | 13.2448 | 13.2448 | 9763.6690 | \( < 0.0001 \) |
| Smooth Term Fixed Effect | Est. | SE | z | p |
|---|---|---|---|---|
| s(thi_mean_t0_3d):multiFx1 | -0.2537 | 0.0841 | -3.02 | 0.0026 |
| s(thi_mean_t0_3d):primiFx1 | -0.3068 | 0.0985 | -3.12 | 0.0018 |
| s(days_in_milk_):multiFx1 | 0.2544 | 0.3388 | 0.75 | 0.4528 |
| s(days_in_milk_):primiFx1 | 2.7607 | 0.4988 | 5.53 | \( < 1e-07 \) |
| Variance Component | ||||
| \( \sigma_\alpha \) | 2.6789 | |||
| \( \sigma_\iota \) | 1.1420 | |||
| \( \sigma_\phi \) | 3.0825 | |||
| s(thi_mean_t0_3d):multi | 1.3120 | |||
| s(days_in_milk_):primi | 7.4999 | |||
| s(days_in_milk_):multi | 7.2936 | |||
| s(thi_mean_t0_3d):primi | 0.9745 | |||
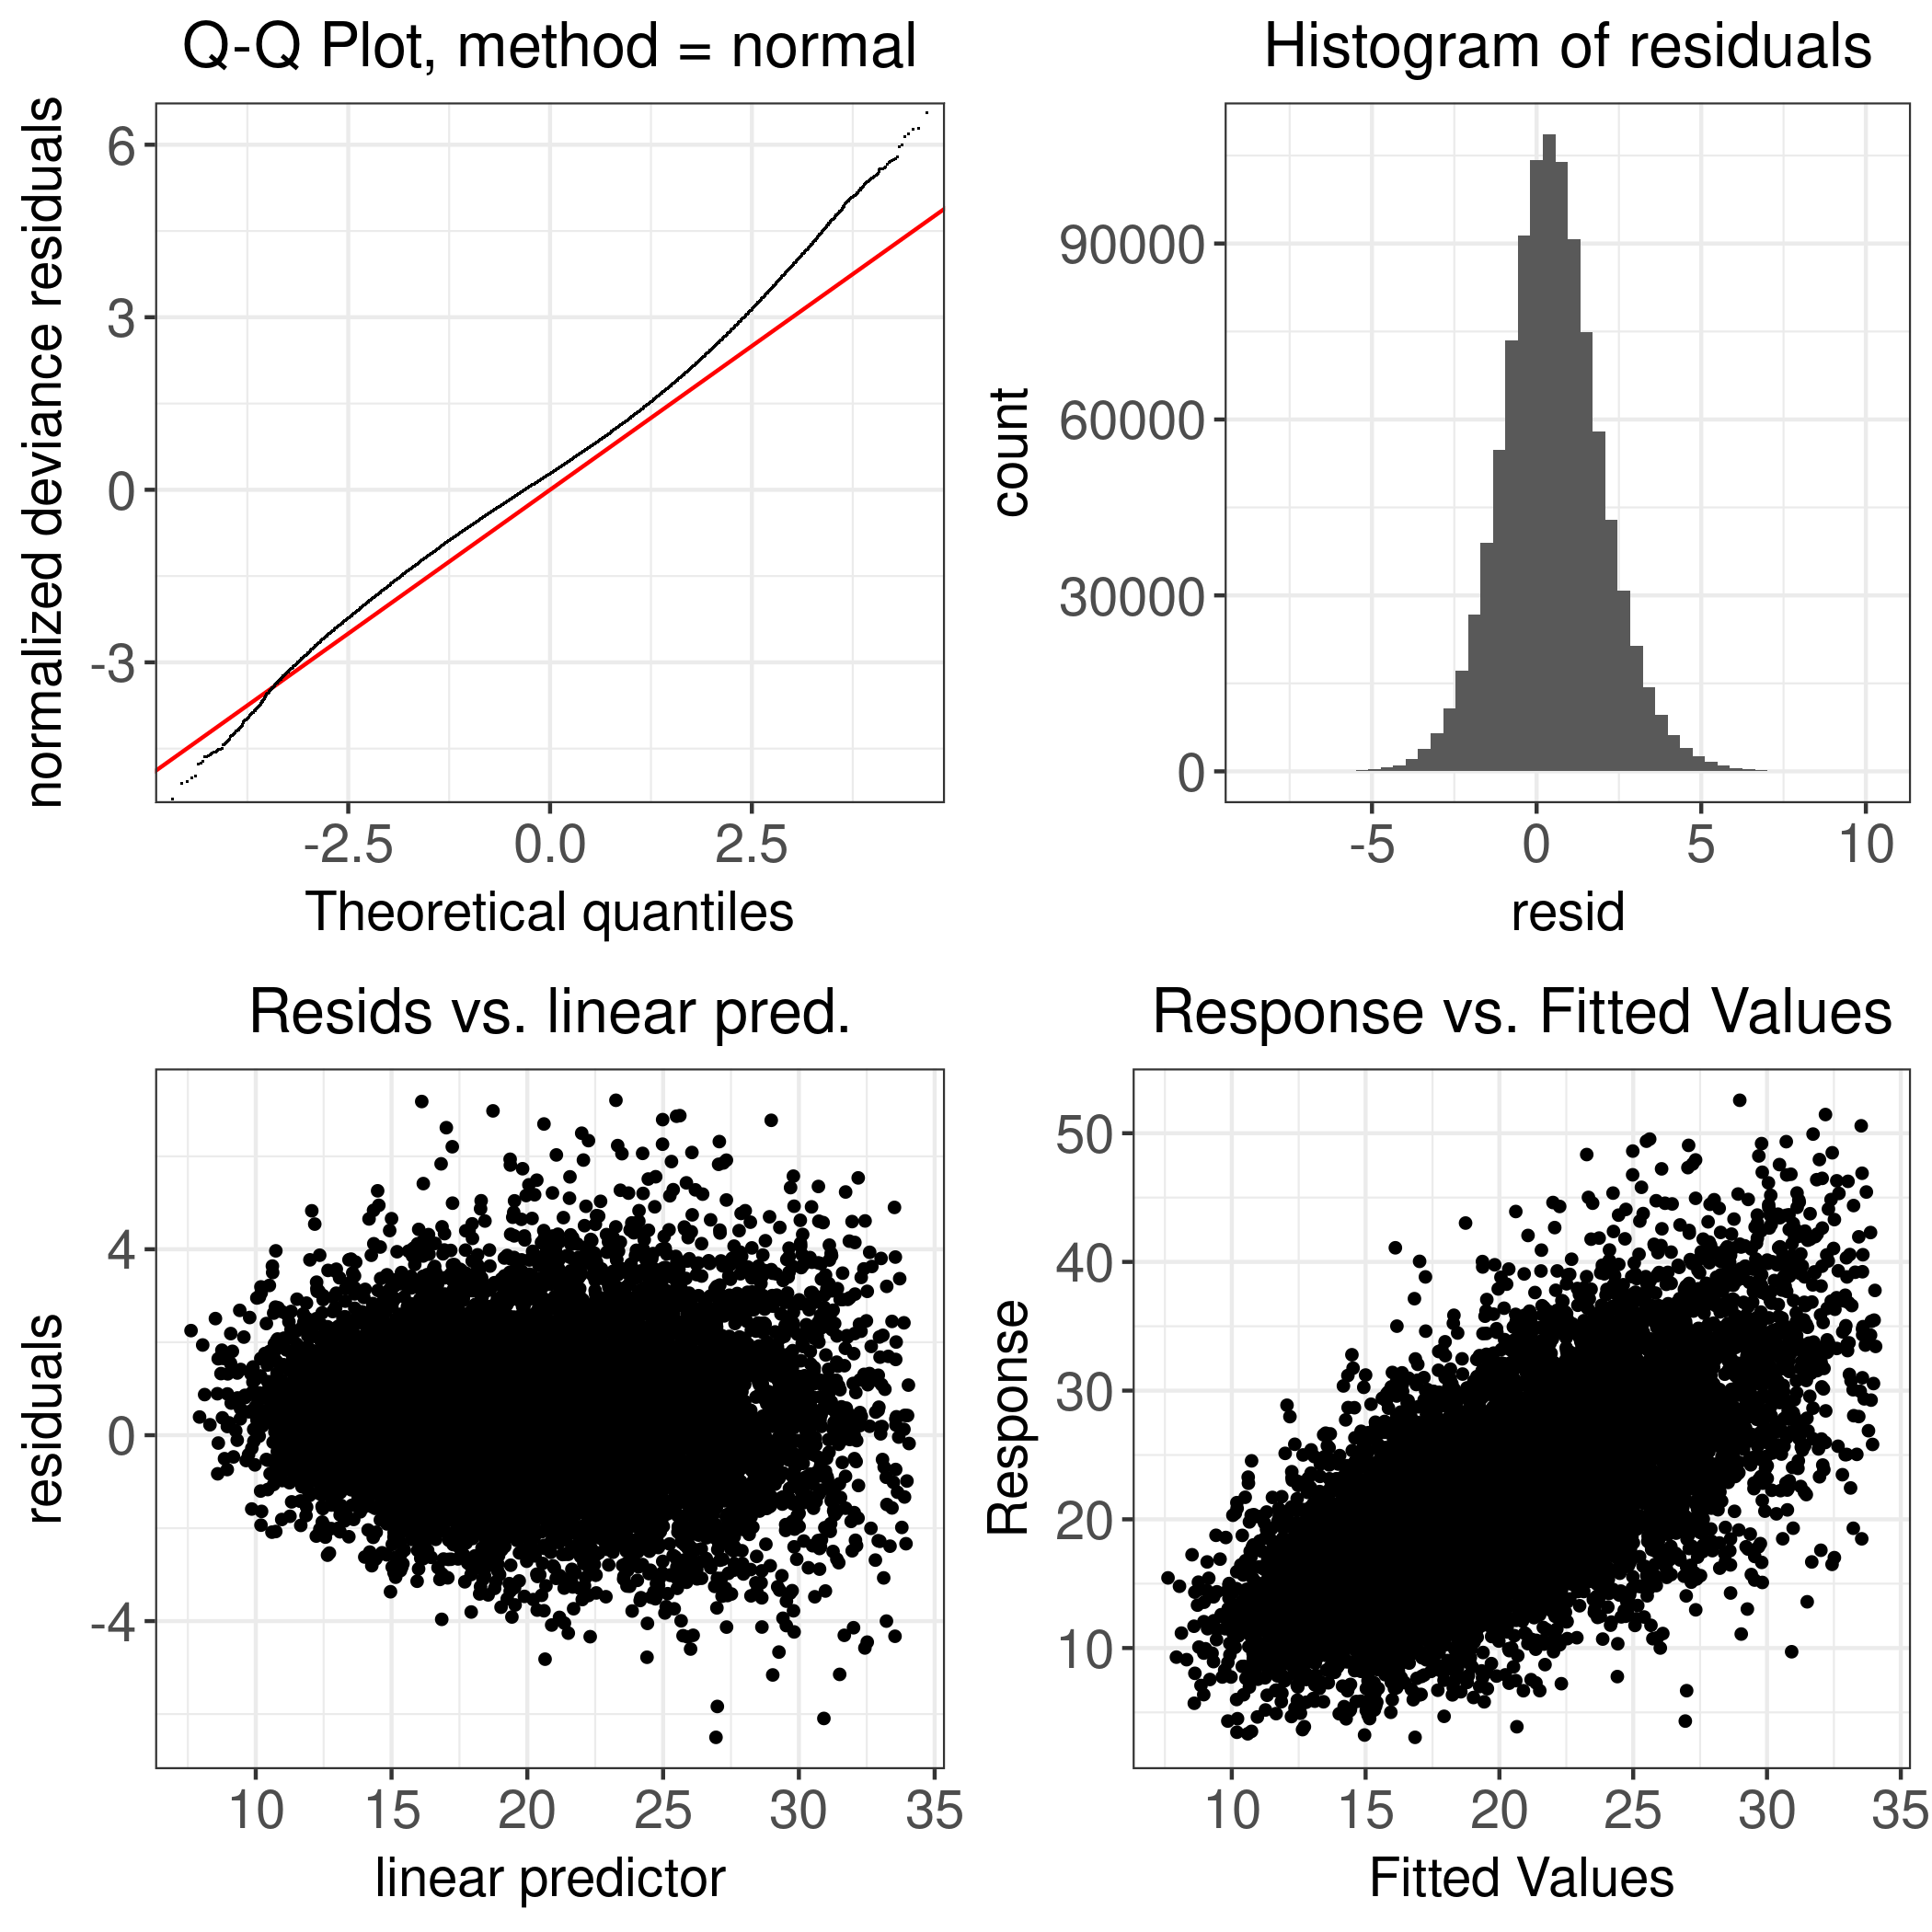
| Residual | 3.4801 | |||
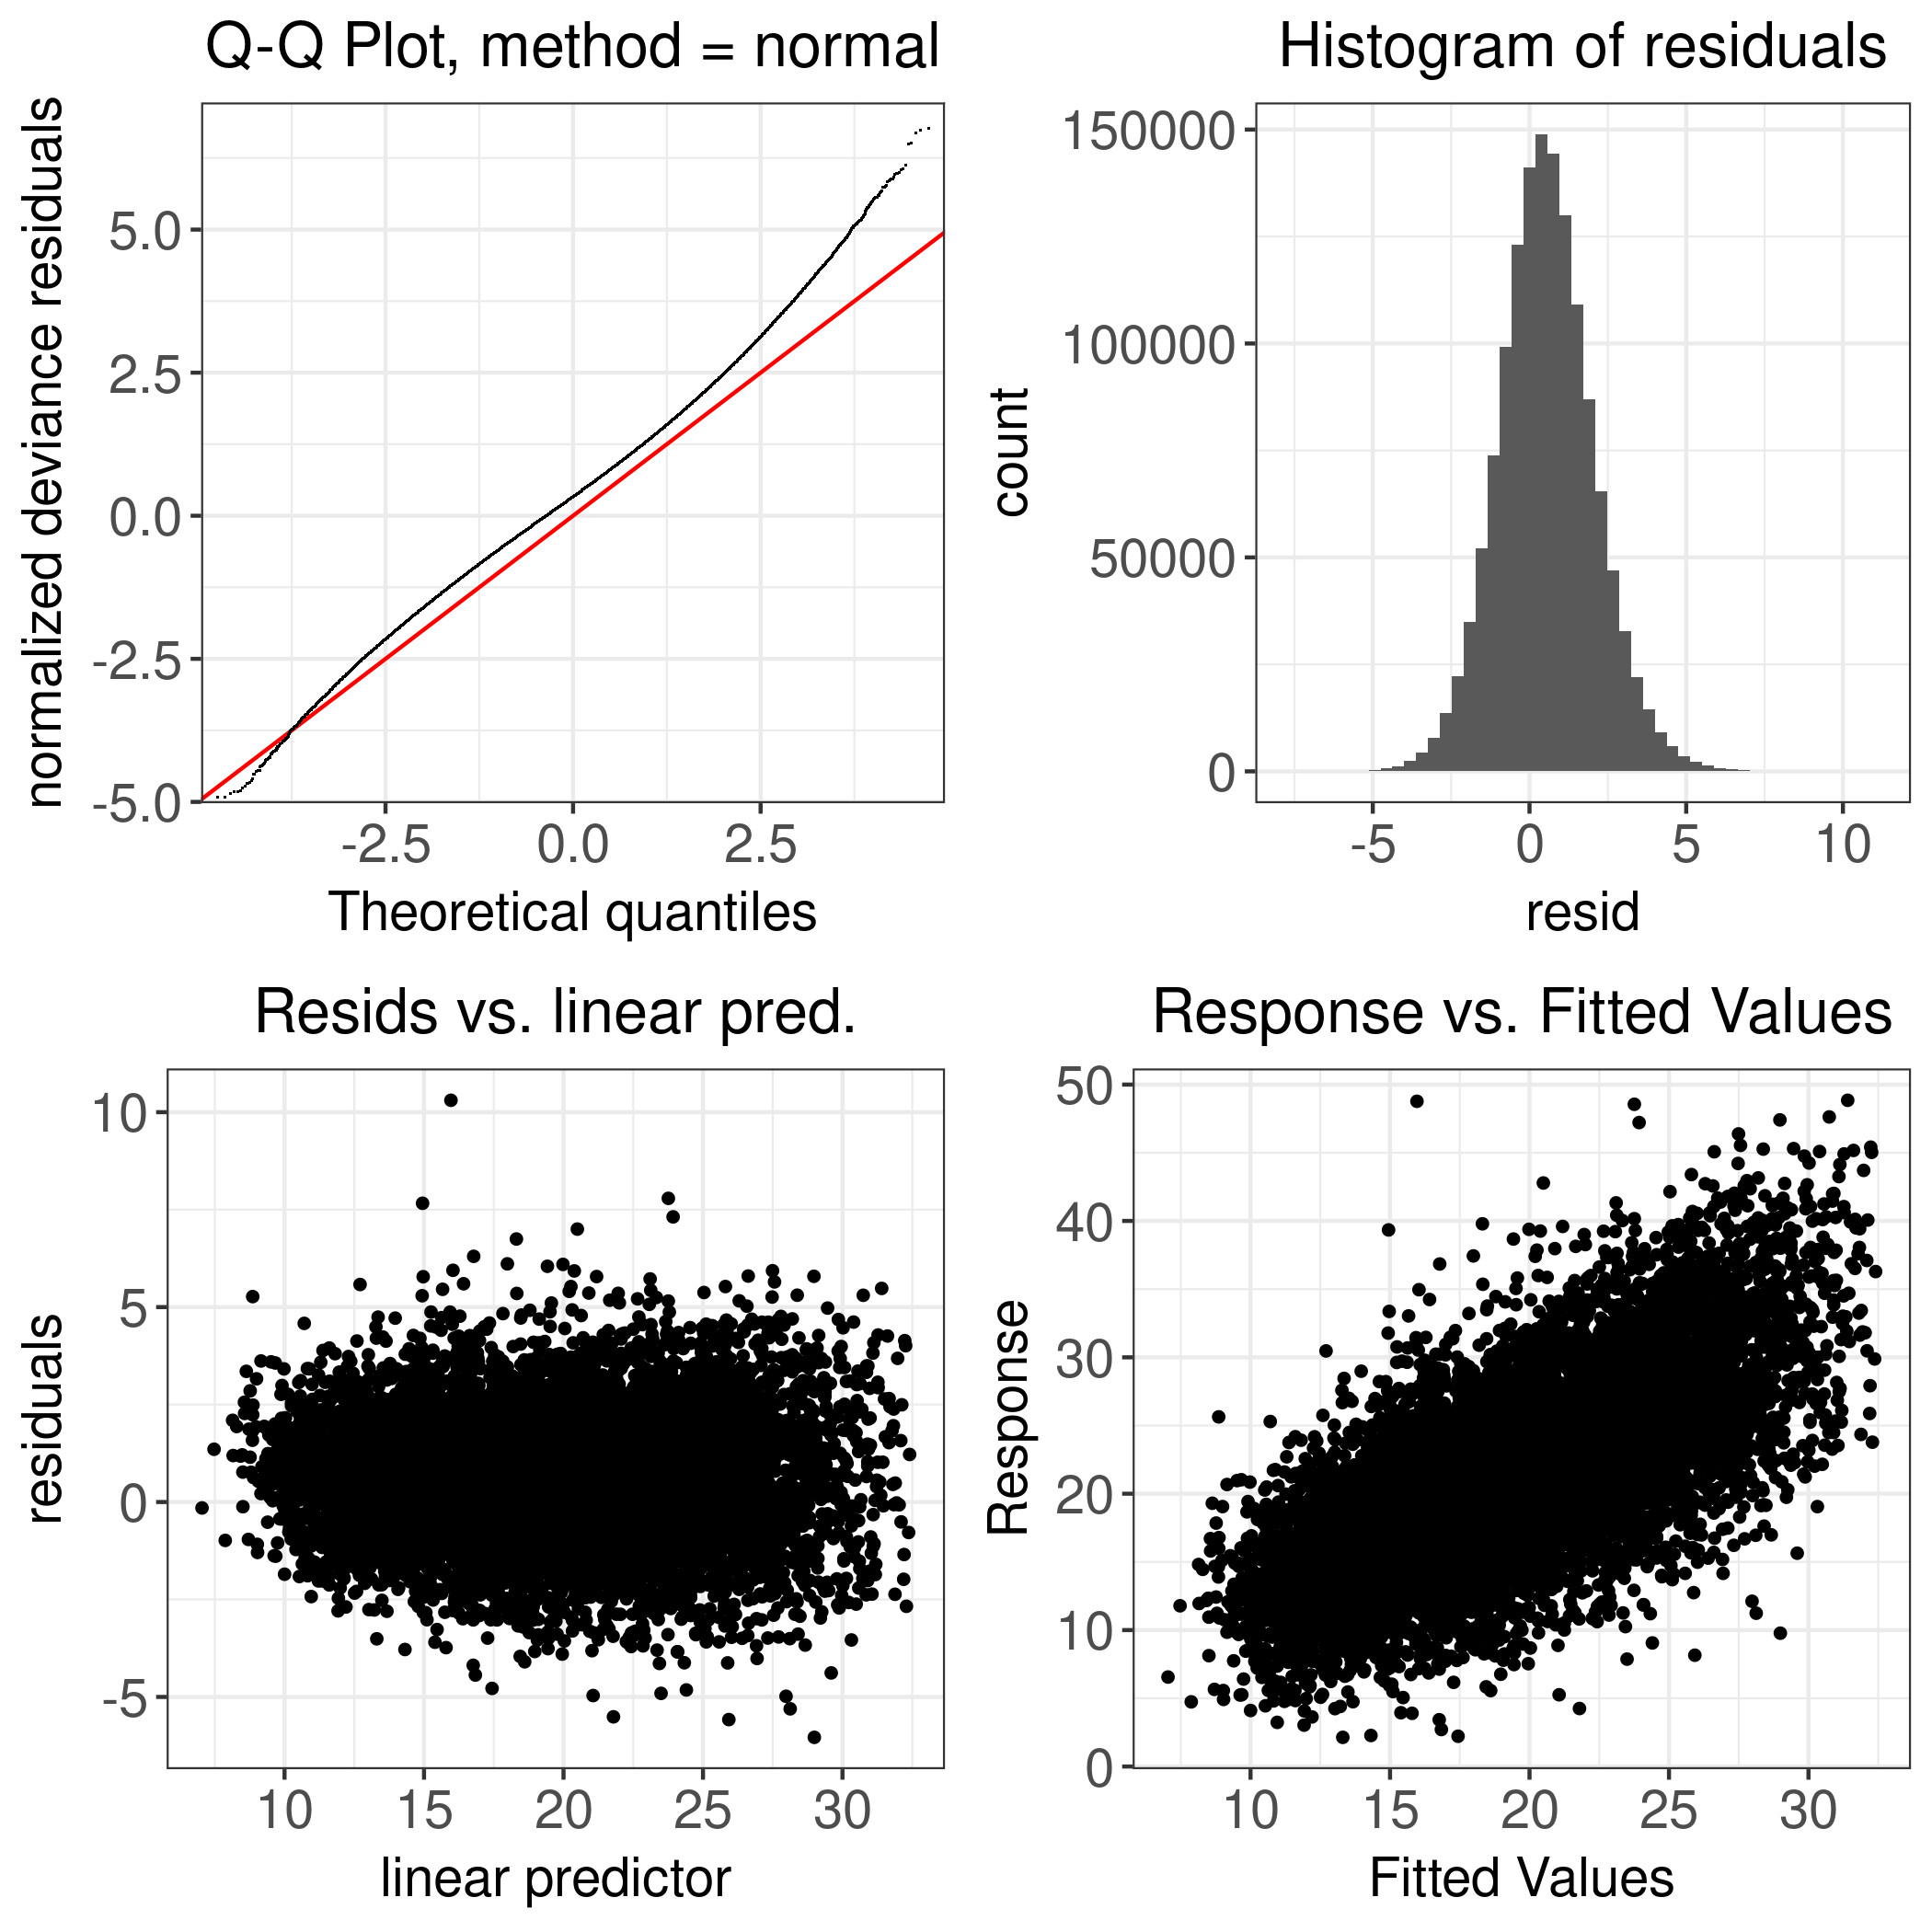
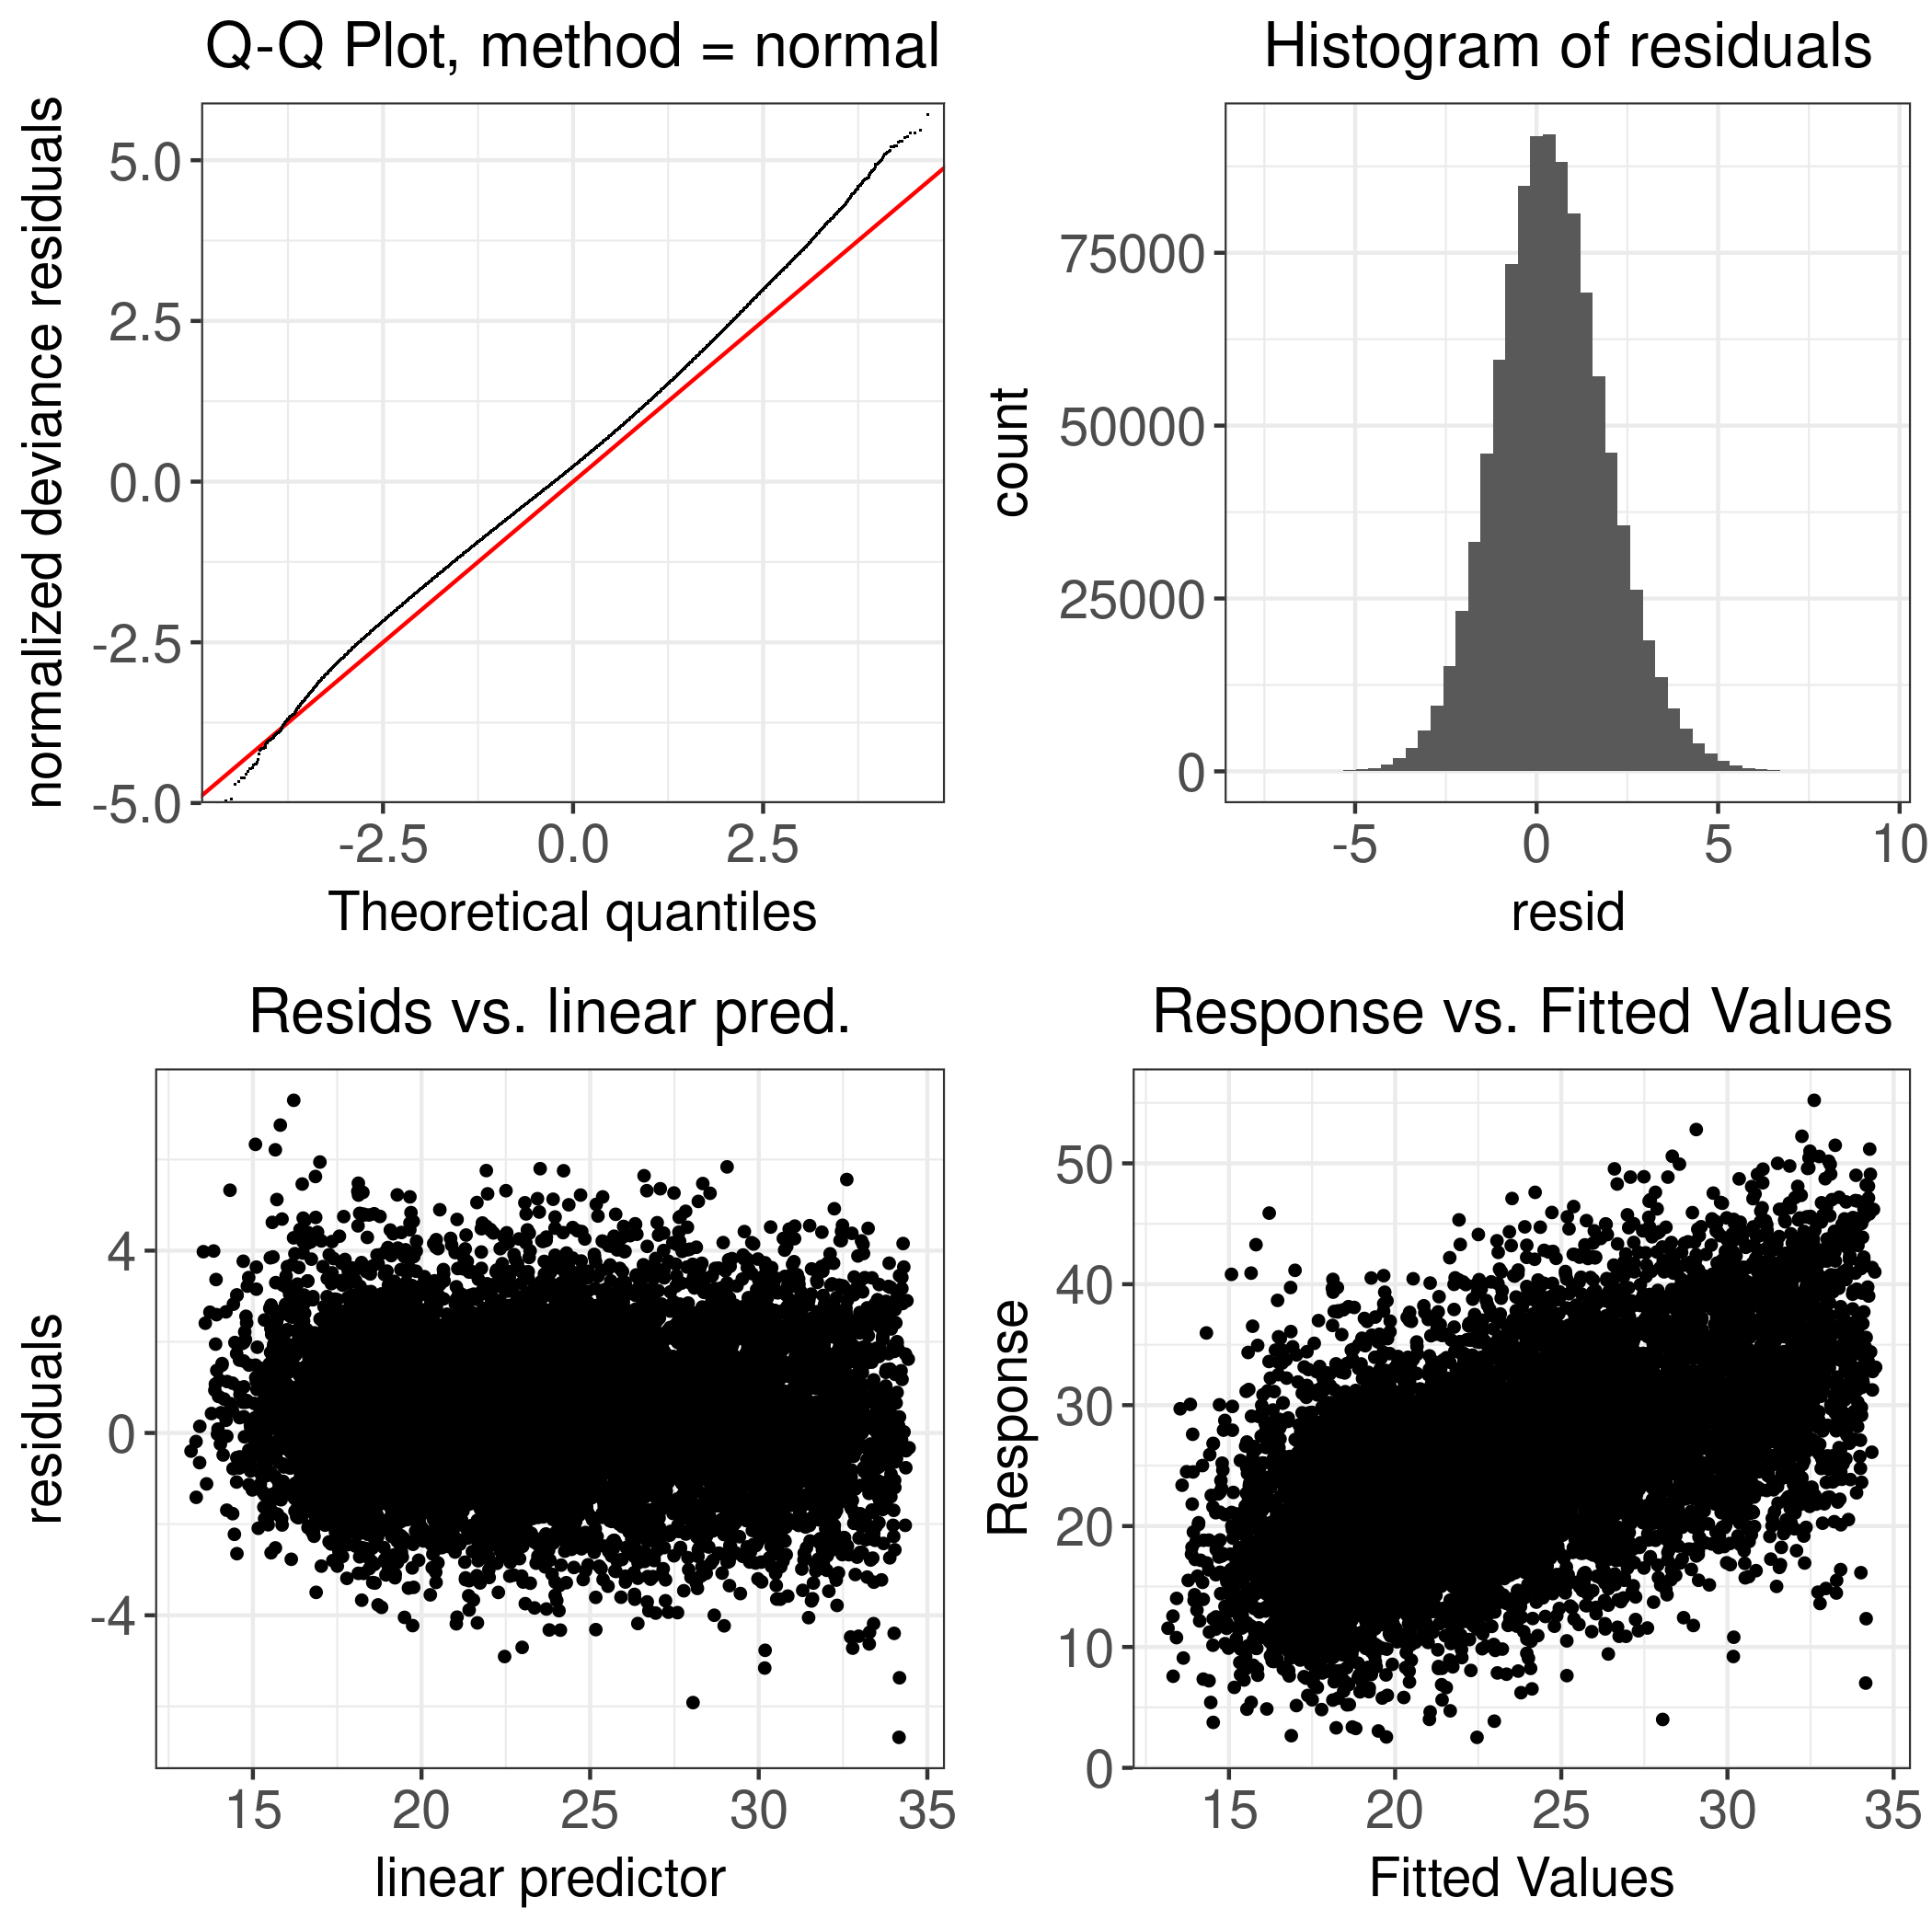
Model Diagnostics
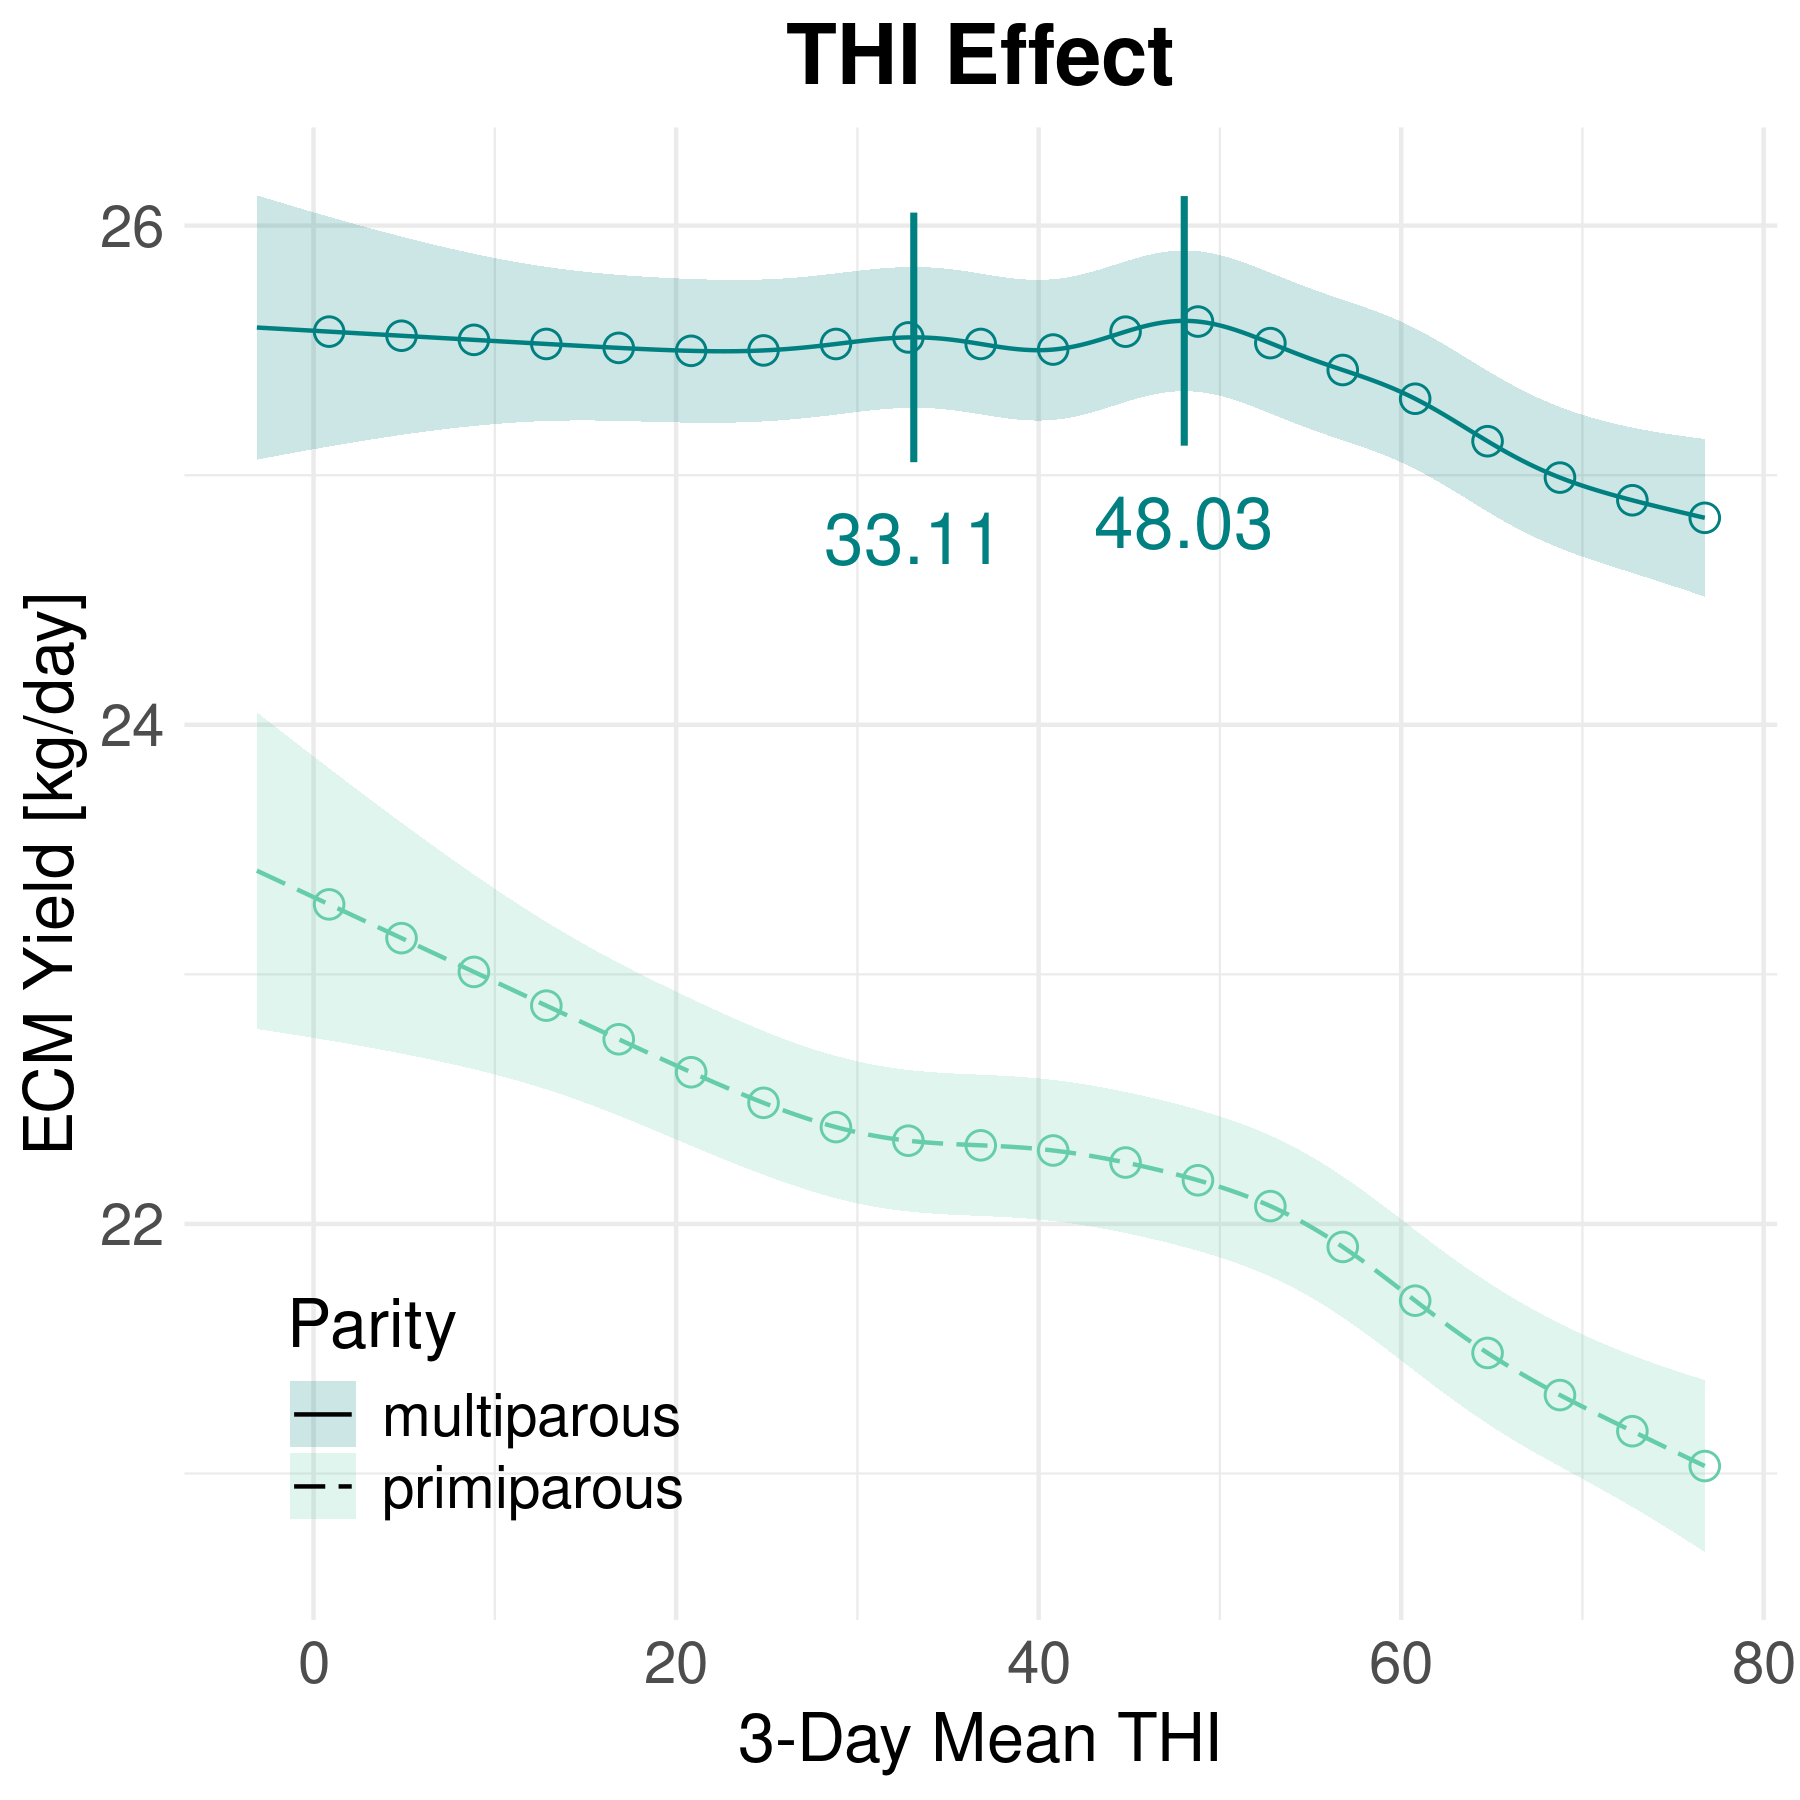
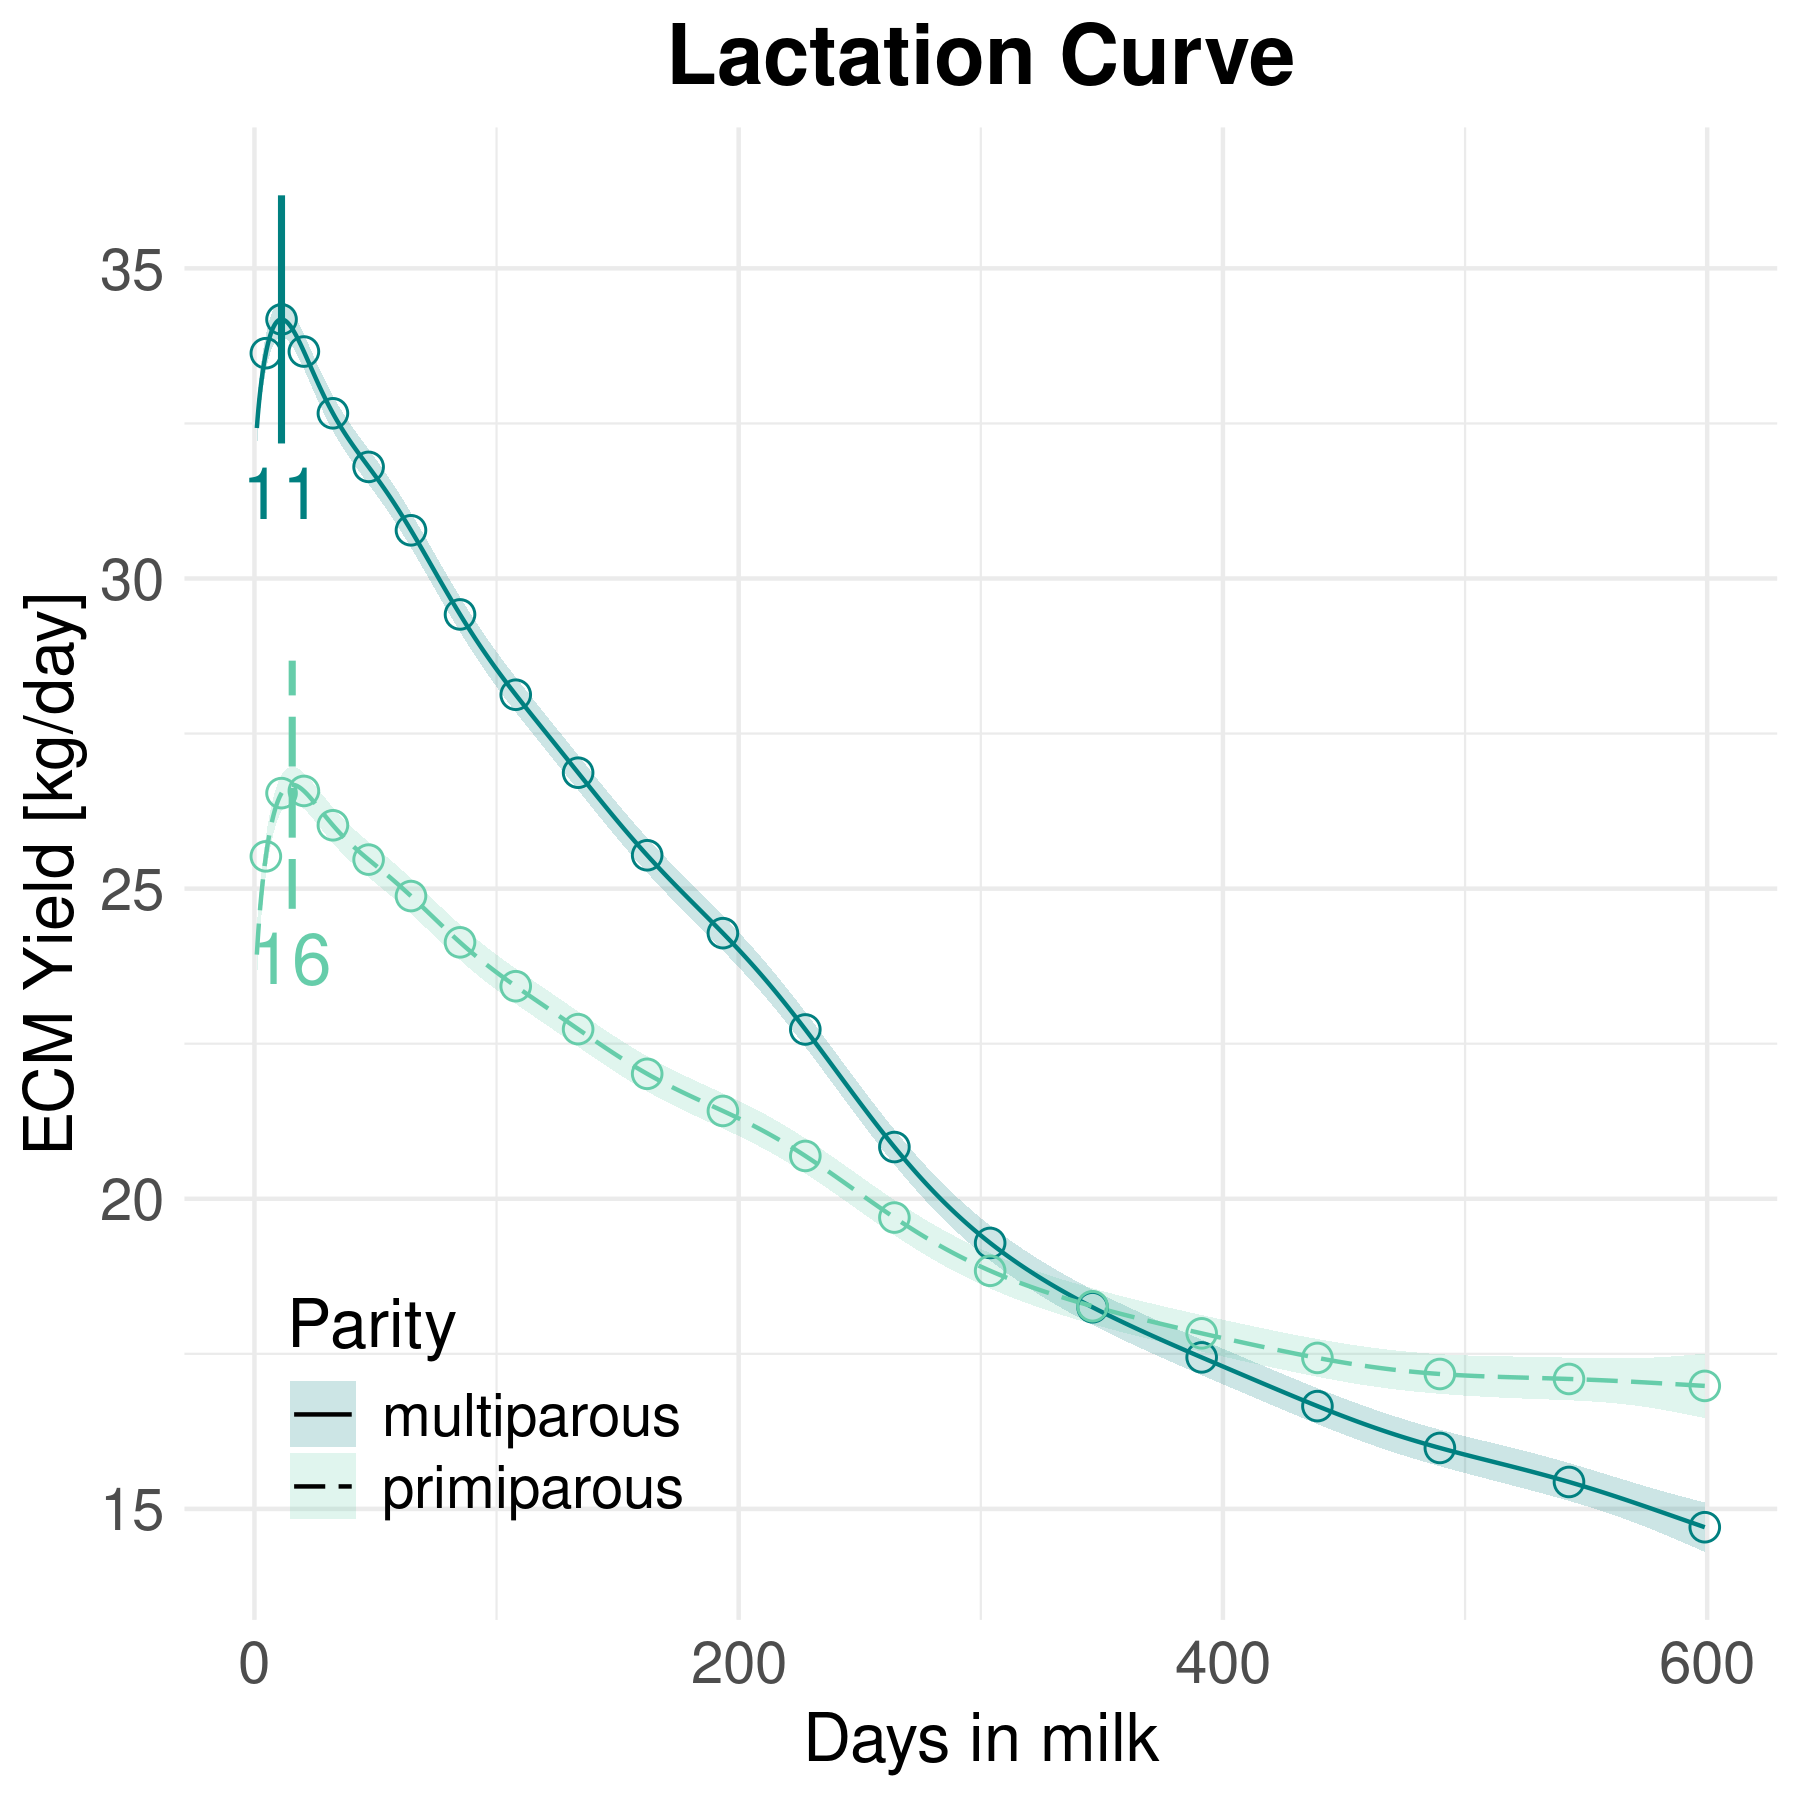
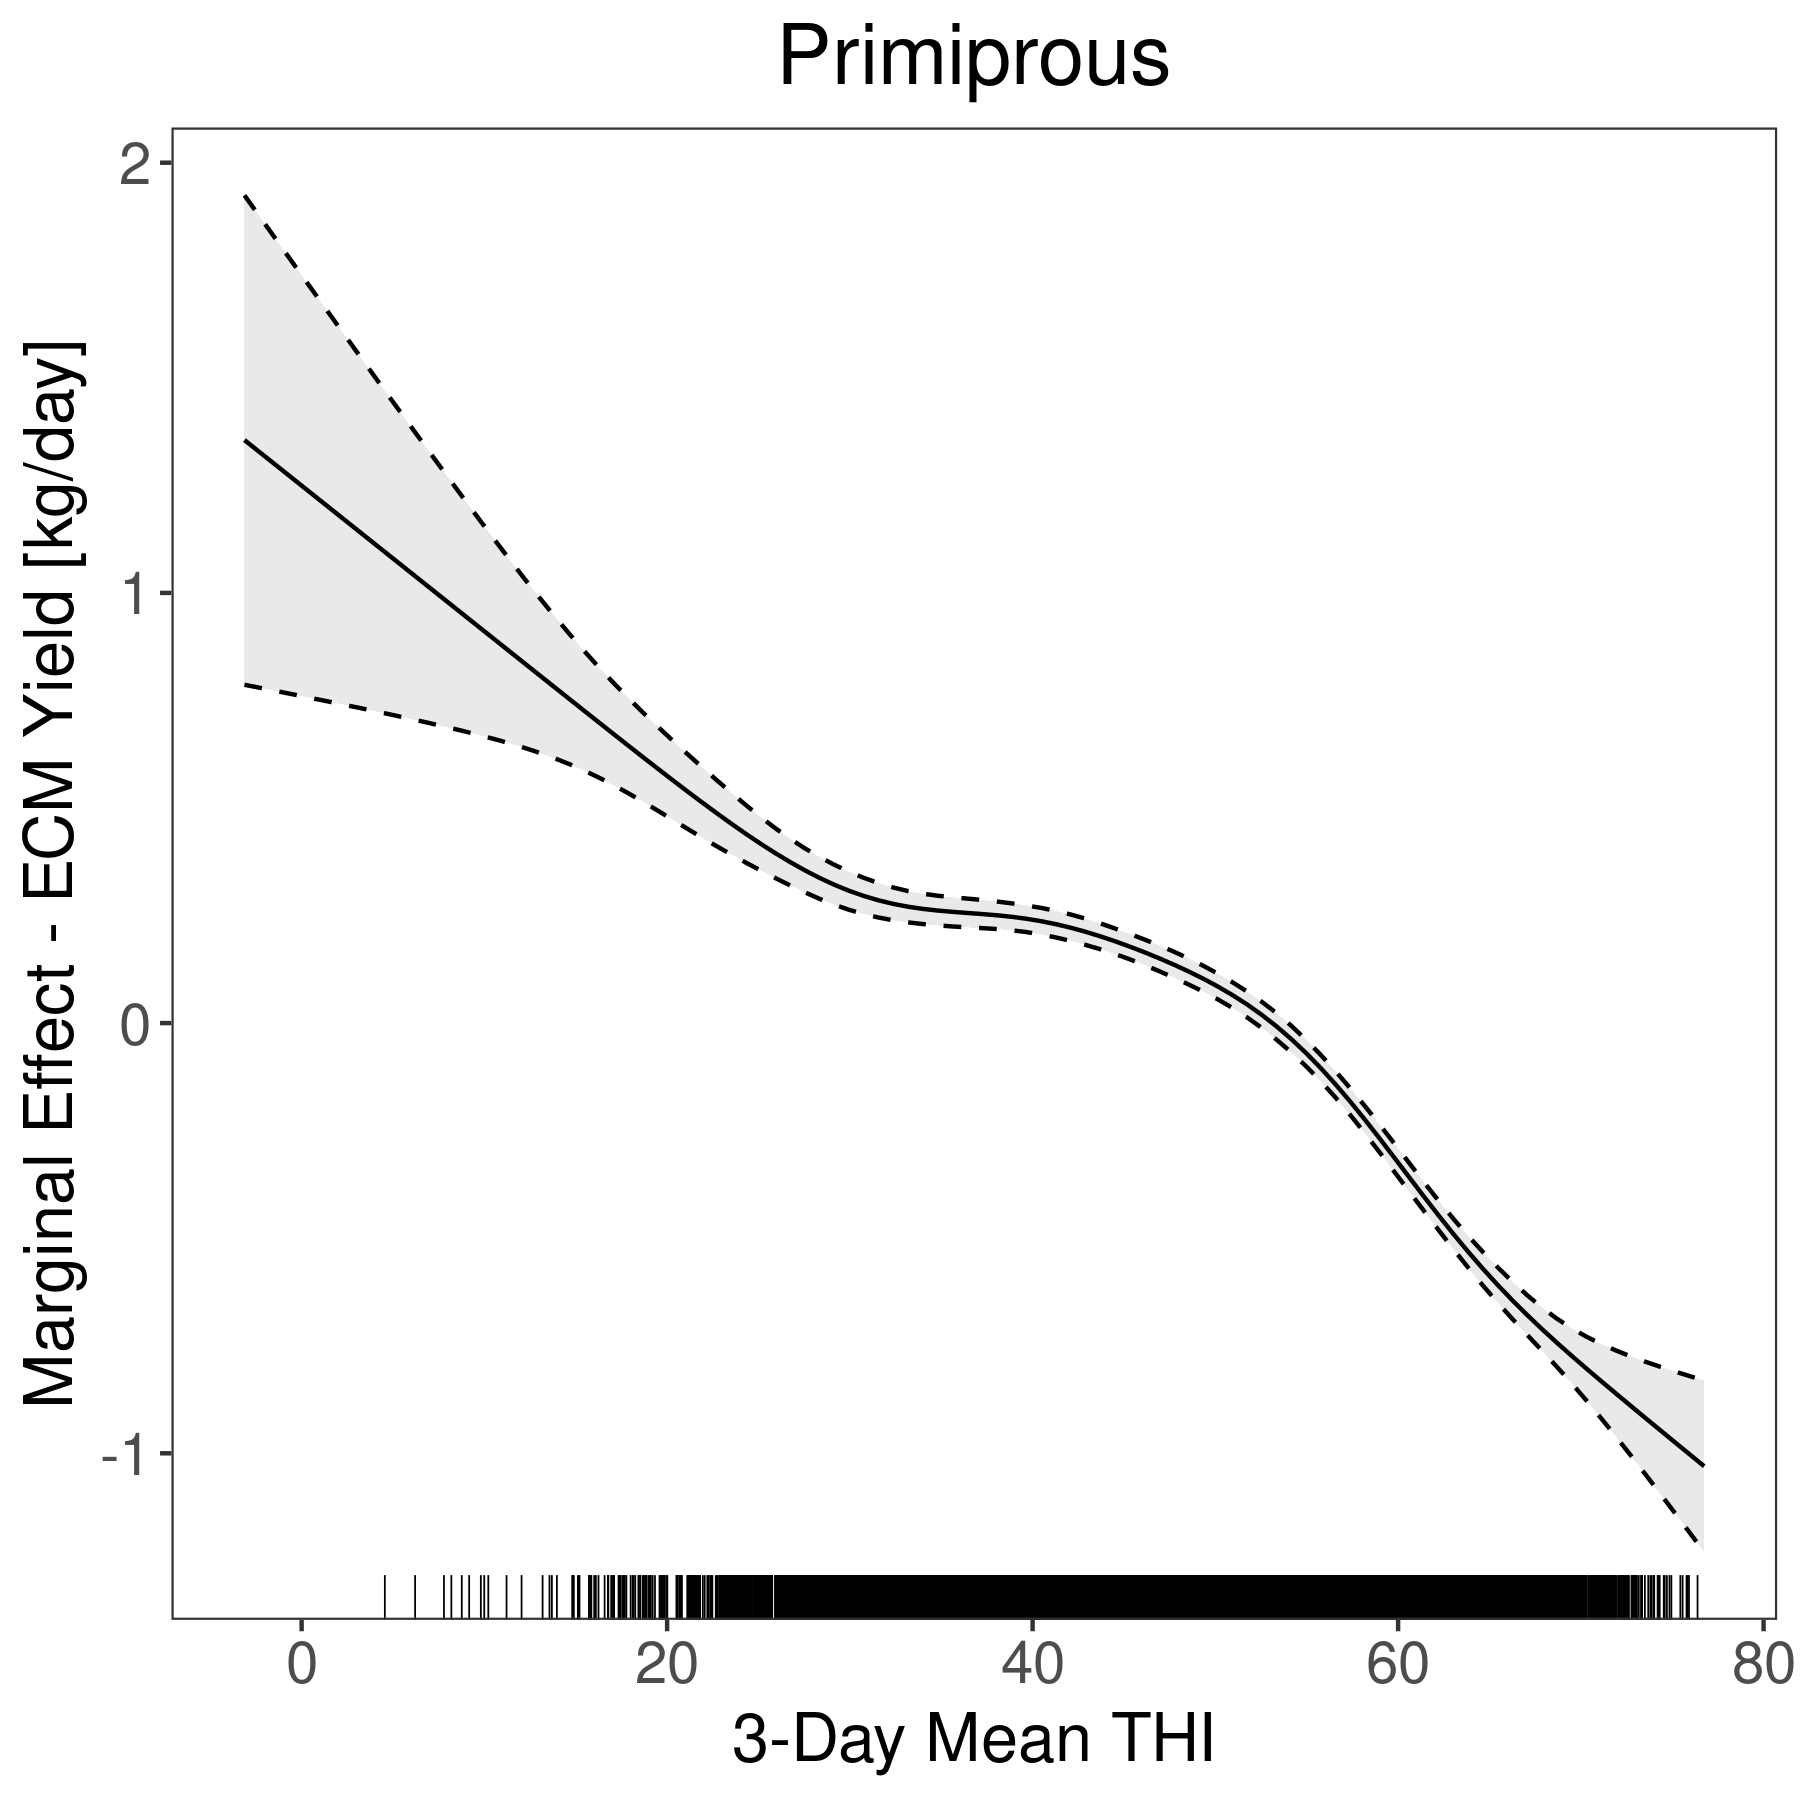
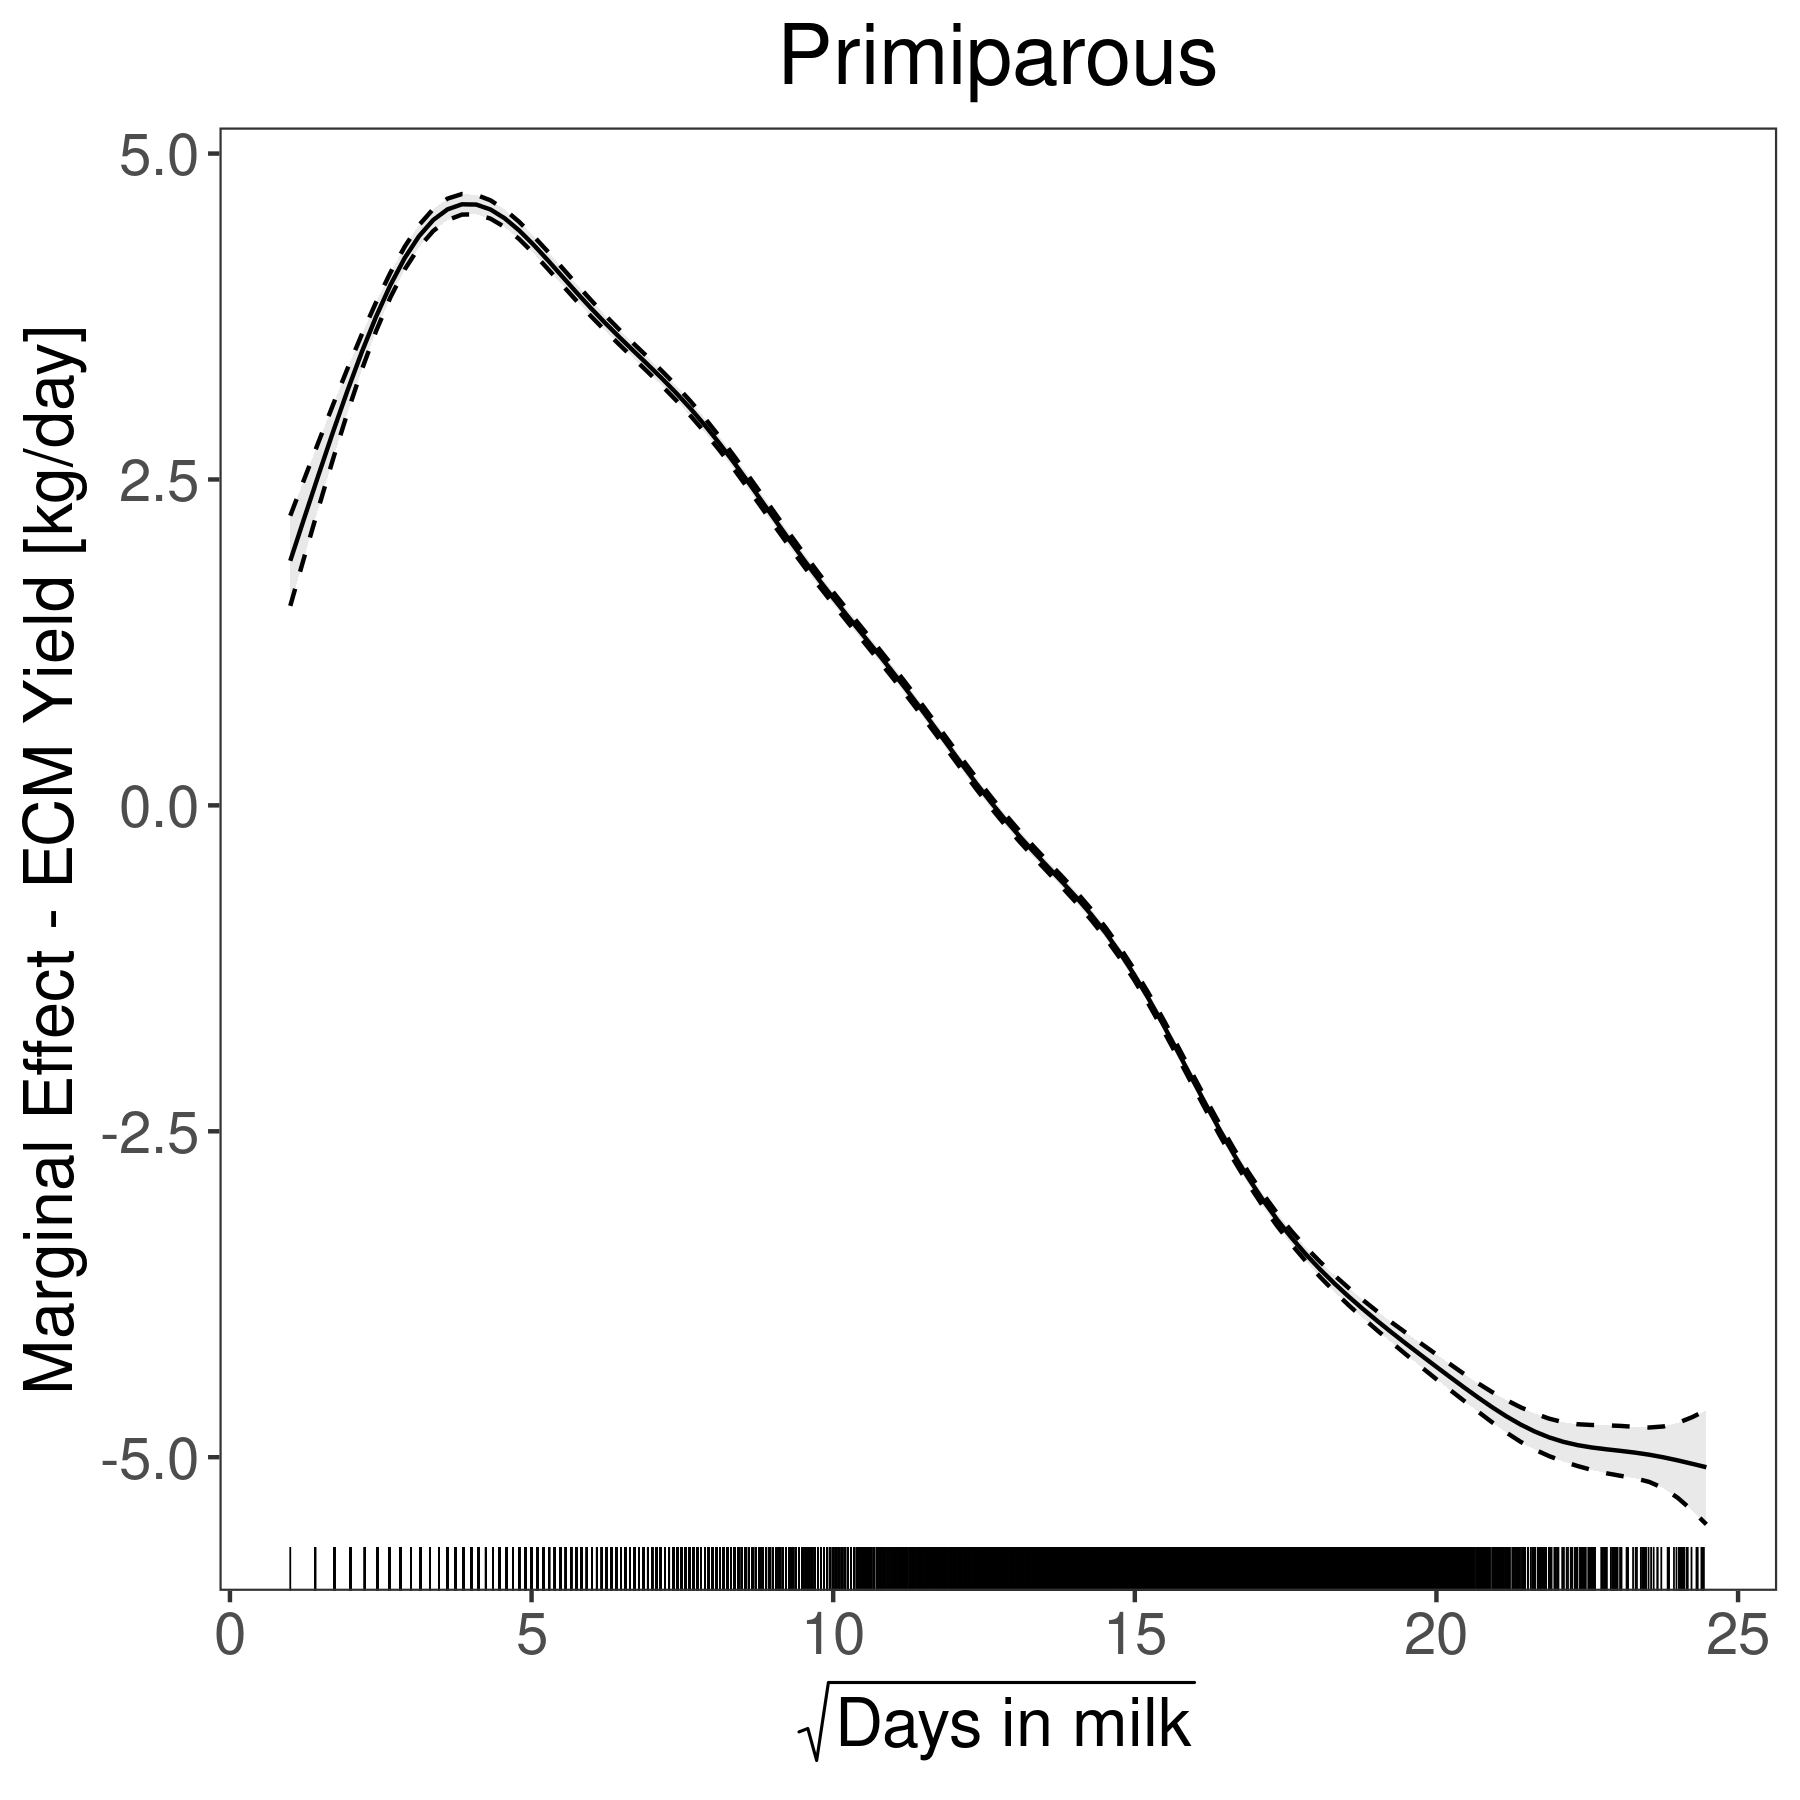
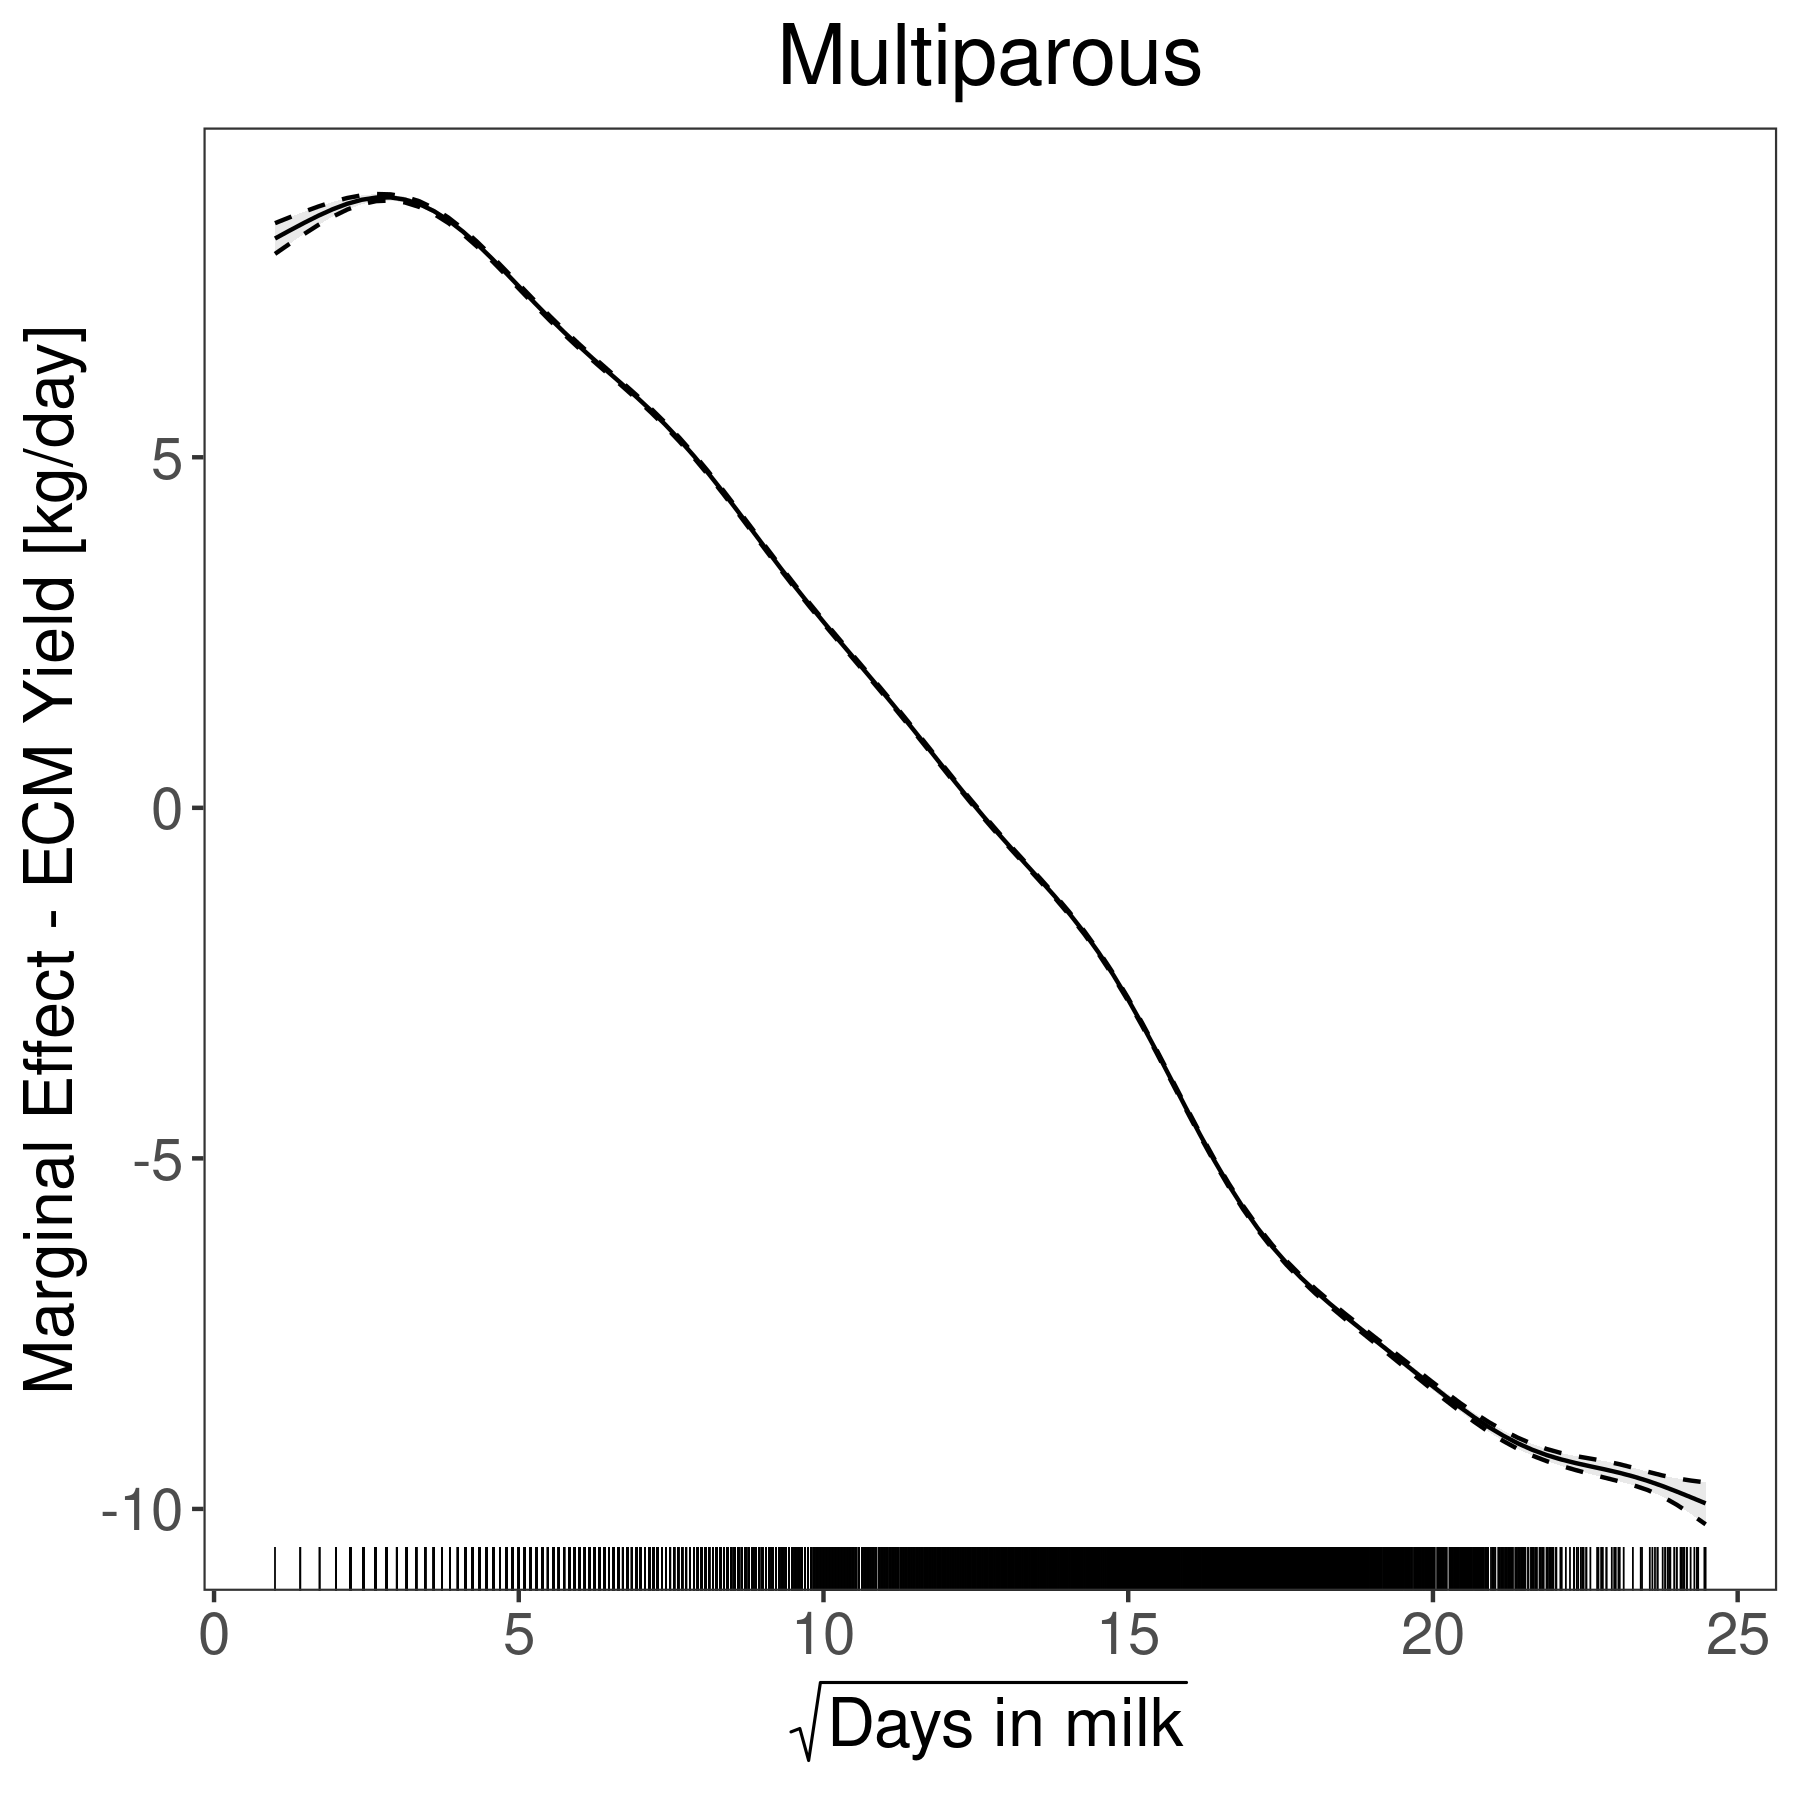
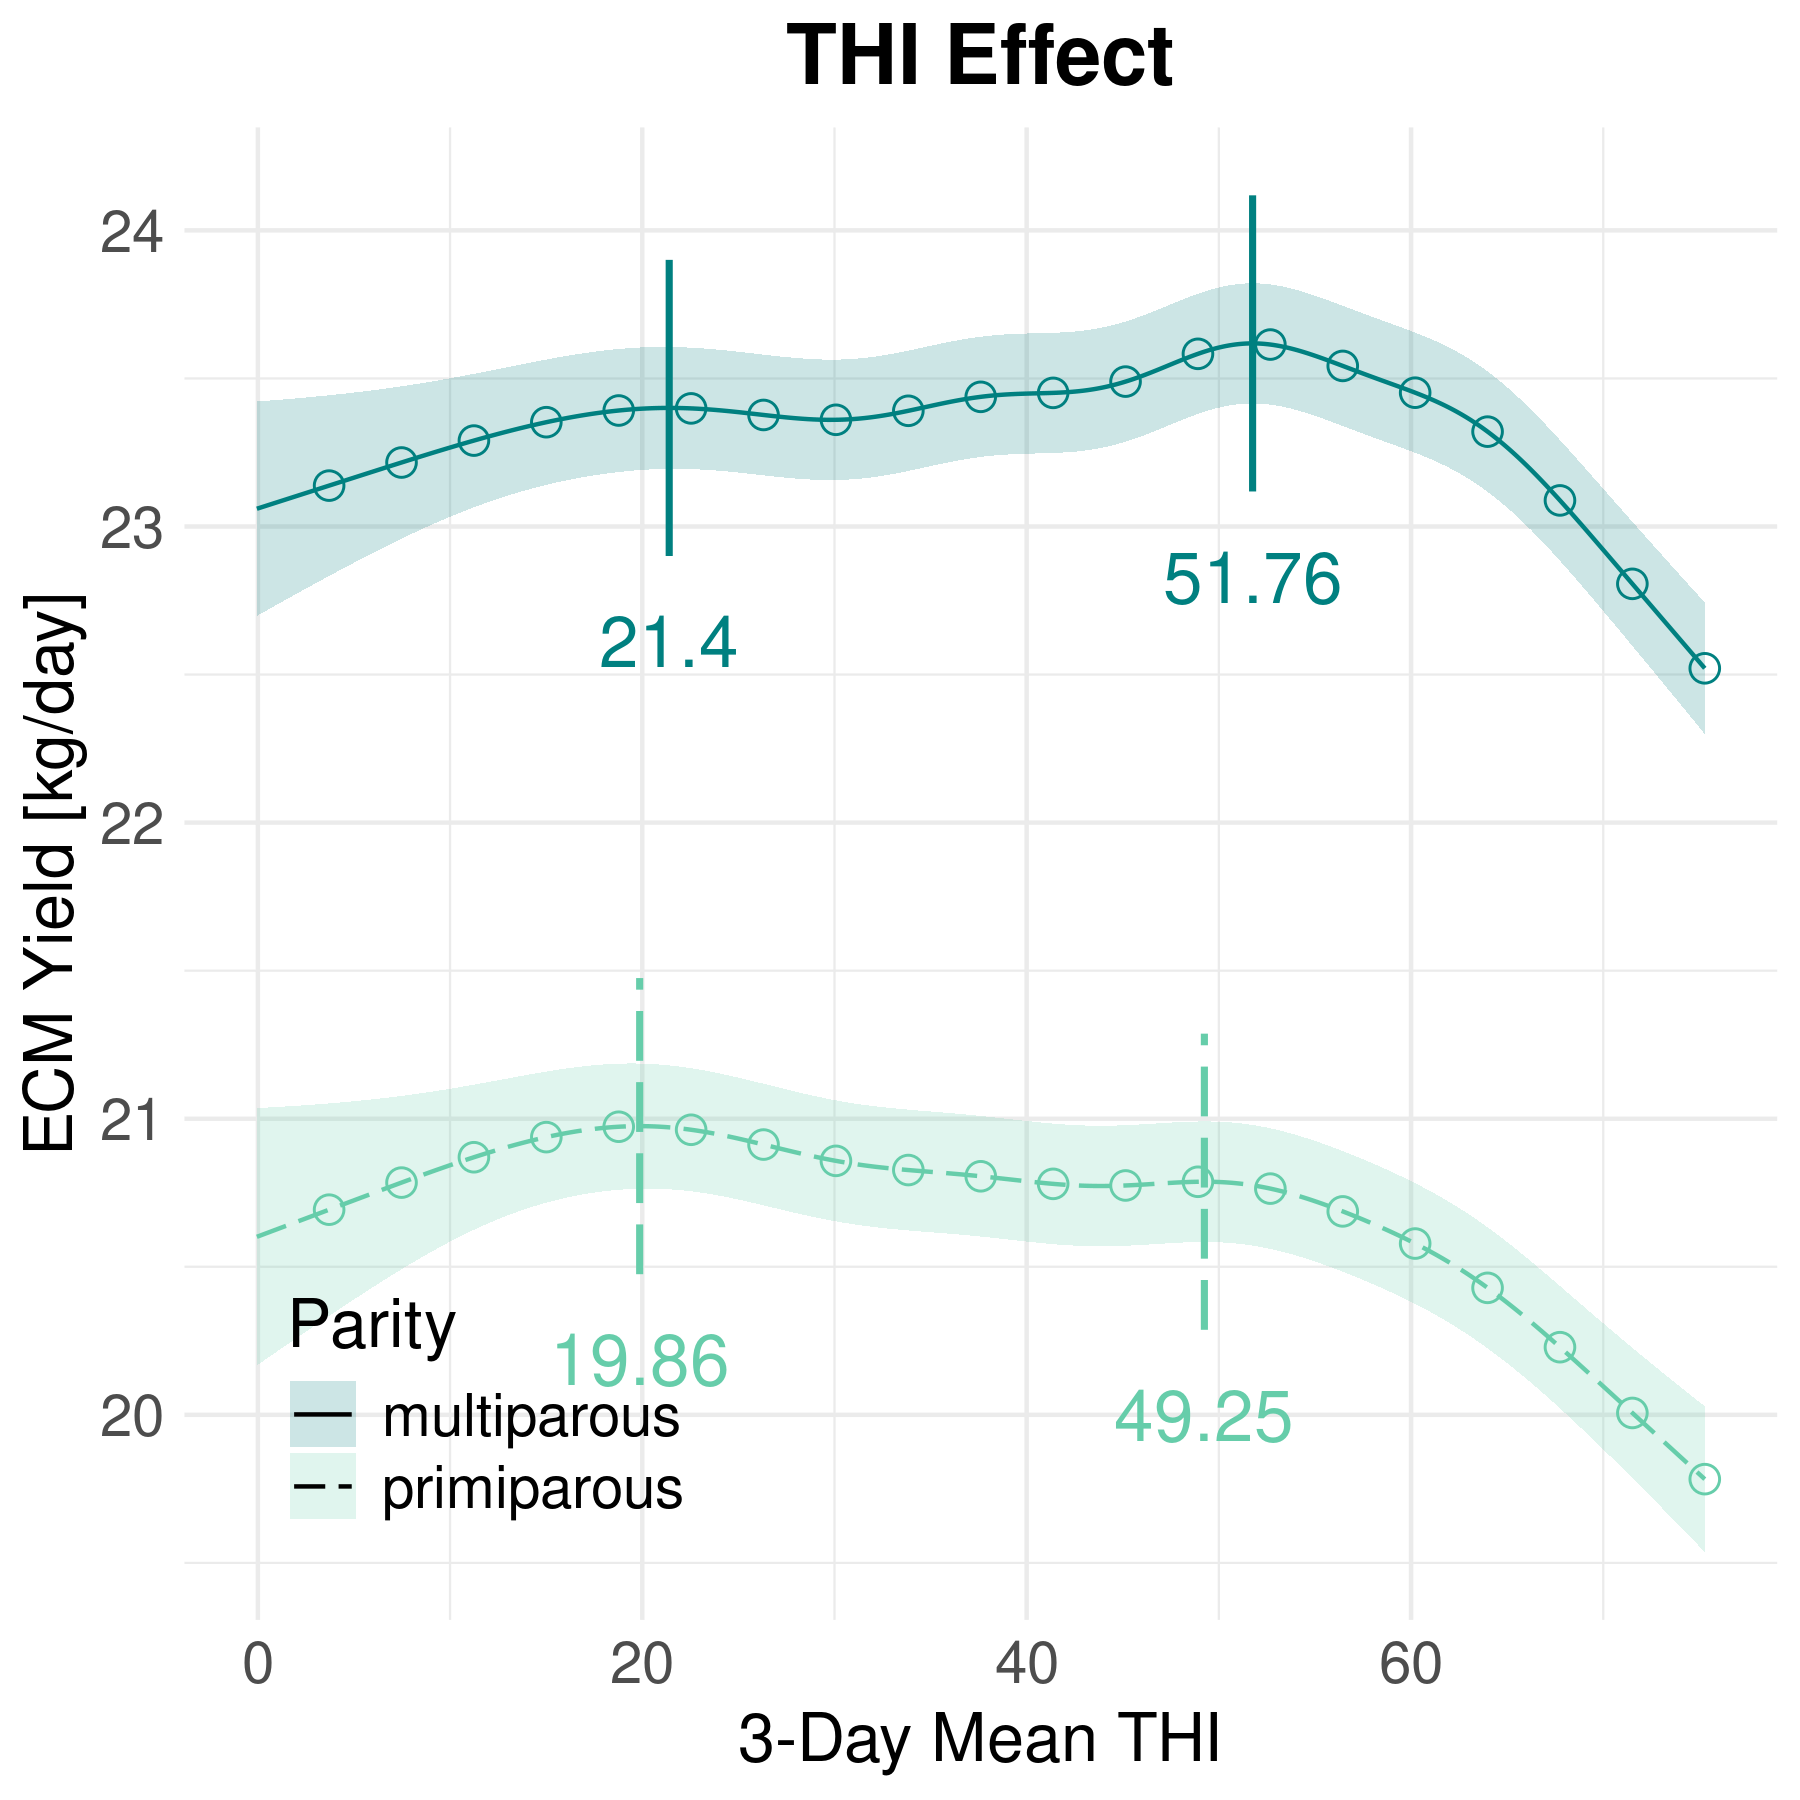
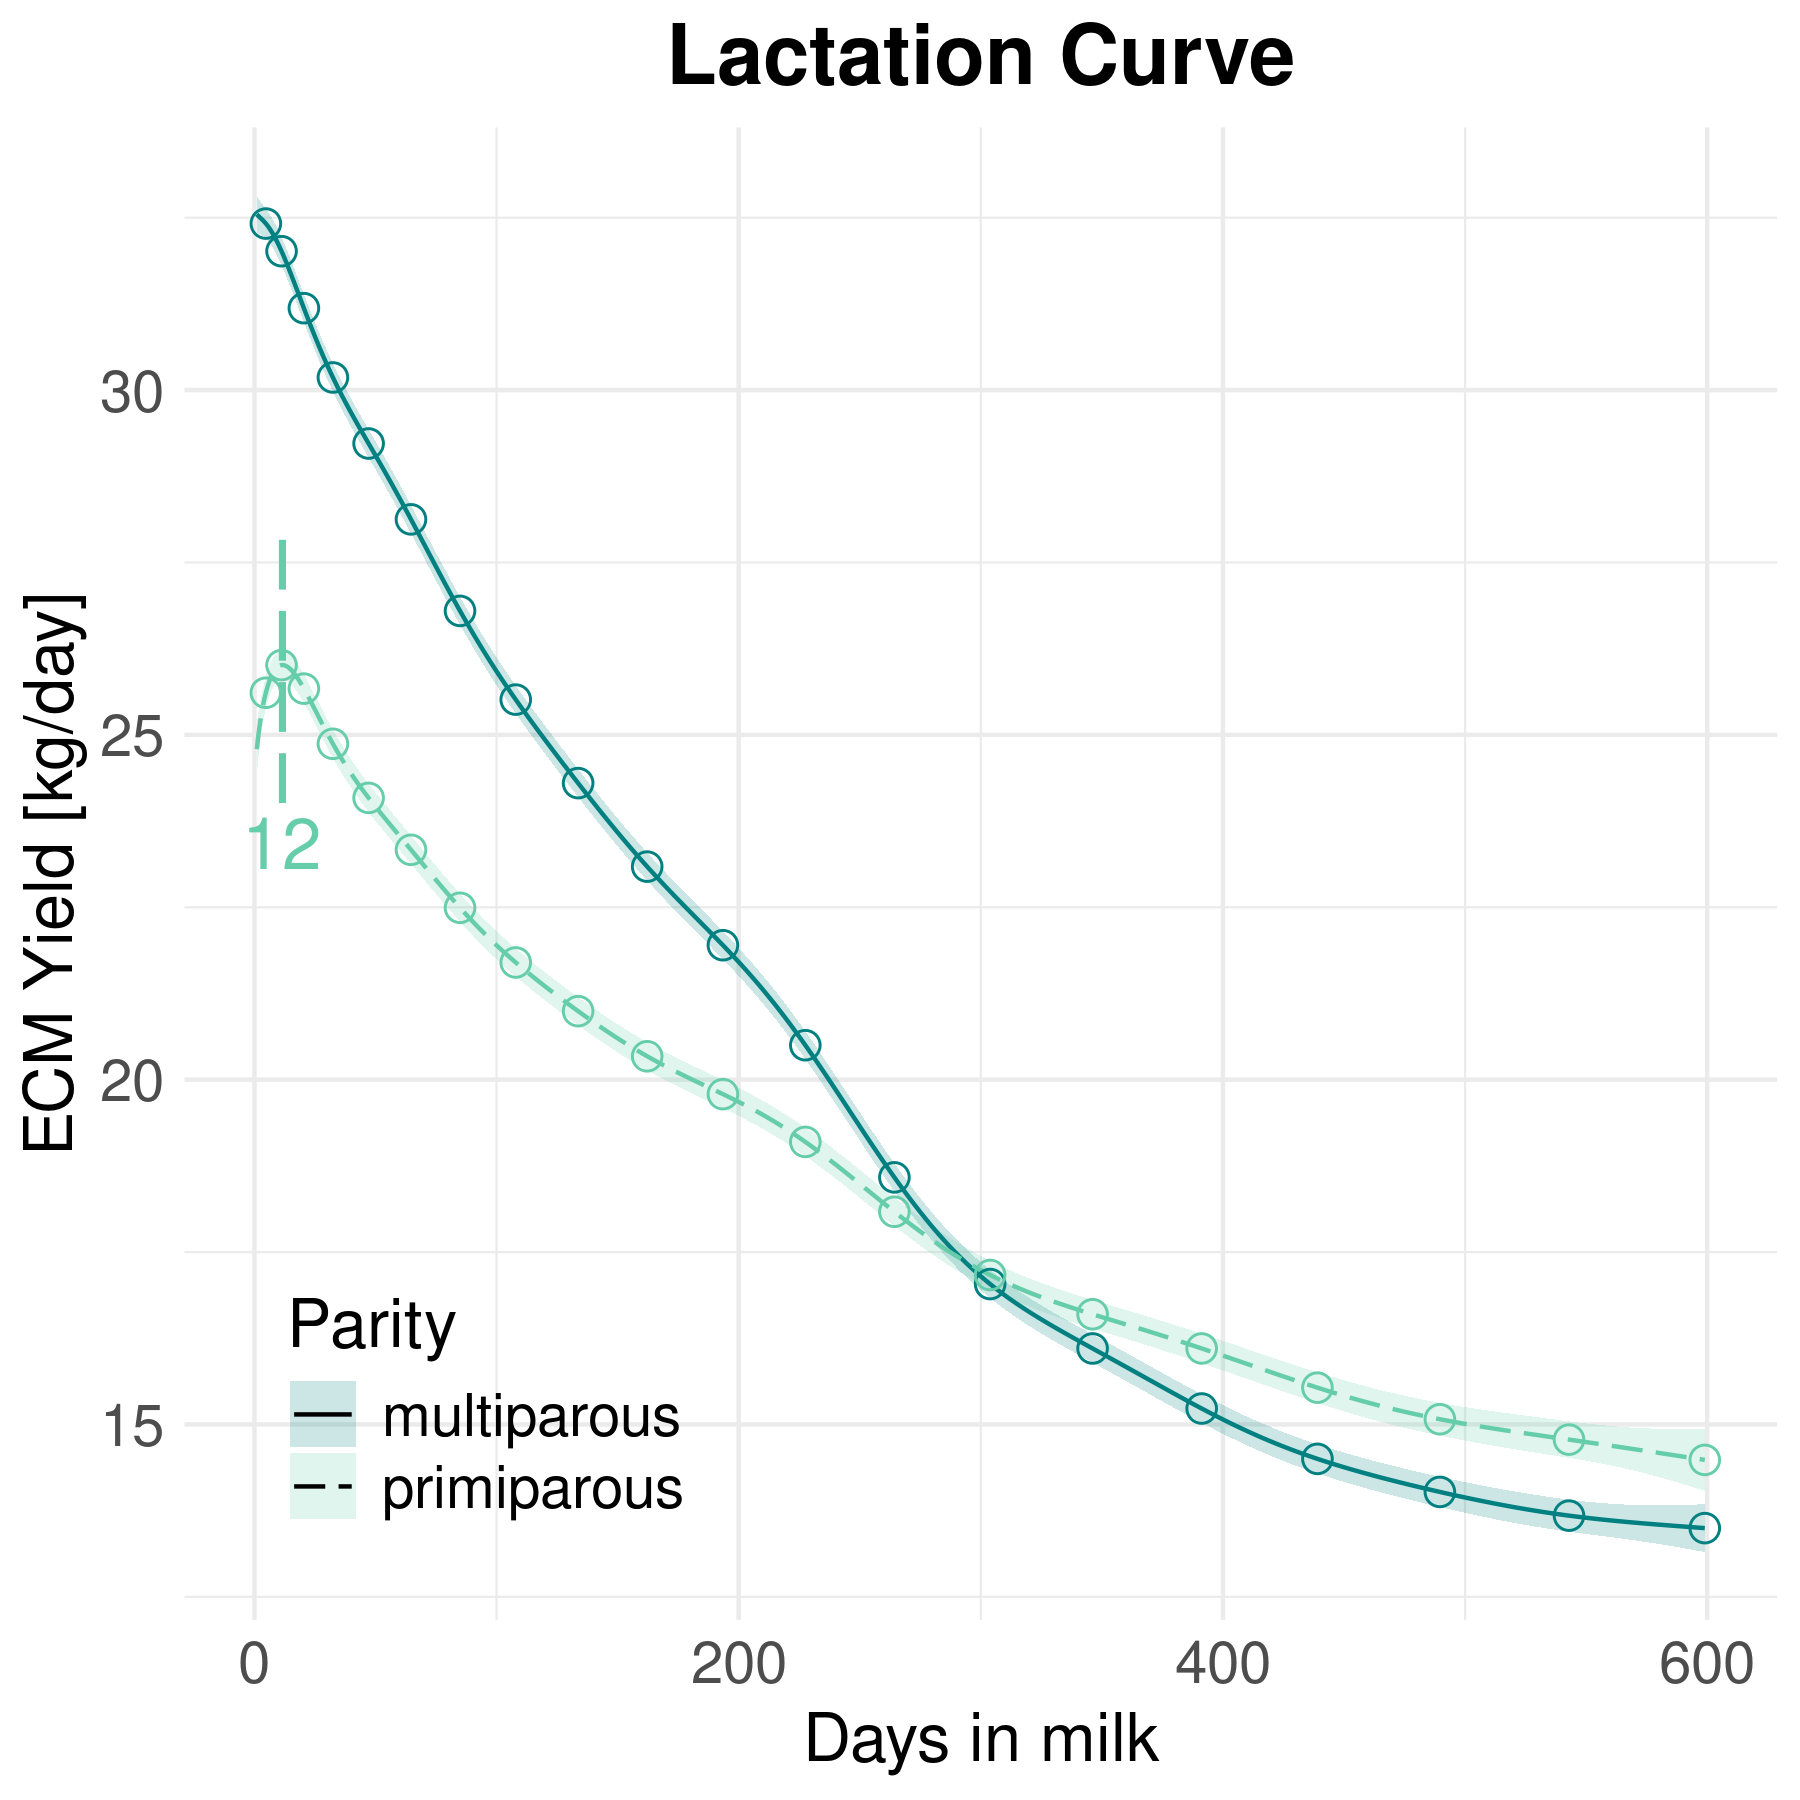
THI Effect and Lactation Curve
D.6.2: Split Period: Until 2010 - After 2010
D.6.2.1: Split Period: 1982 - 2010
Model Summary
| A. parametric coefficients | Estimate | Std. Error | t-value | p-value |
|---|---|---|---|---|
| (Intercept) | 13.9011 | 0.6172 | 22.5214 | \( < 0.0001 \) |
| parityprimiparous | -2.7288 | 0.0073 | -375.8442 | \( < 0.0001 \) |
| year1983 | 2.3196 | 0.3994 | 5.8081 | \( < 0.0001 \) |
| year1984 | 2.9601 | 0.5001 | 5.9189 | \( < 0.0001 \) |
| year1985 | 3.4533 | 0.5081 | 6.7972 | \( < 0.0001 \) |
| year1986 | 3.3724 | 0.5674 | 5.9435 | \( < 0.0001 \) |
| year1987 | 3.2407 | 0.5760 | 5.6260 | \( < 0.0001 \) |
| year1988 | 3.2757 | 0.6297 | 5.2018 | \( < 0.0001 \) |
| year1989 | 3.9381 | 0.6372 | 6.1799 | \( < 0.0001 \) |
| year1990 | 4.2920 | 0.6390 | 6.7167 | \( < 0.0001 \) |
| year1991 | 4.6150 | 0.6503 | 7.0969 | \( < 0.0001 \) |
| year1992 | 4.7898 | 0.6440 | 7.4375 | \( < 0.0001 \) |
| year1993 | 4.8166 | 0.6435 | 7.4849 | \( < 0.0001 \) |
| year1994 | 4.5930 | 0.6392 | 7.1860 | \( < 0.0001 \) |
| year1995 | 4.7651 | 0.6402 | 7.4435 | \( < 0.0001 \) |
| year1996 | 4.9309 | 0.6414 | 7.6879 | \( < 0.0001 \) |
| year1997 | 5.5129 | 0.6414 | 8.5948 | \( < 0.0001 \) |
| year1998 | 6.4300 | 0.6504 | 9.8868 | \( < 0.0001 \) |
| year1999 | 6.2791 | 0.6555 | 9.5797 | \( < 0.0001 \) |
| year2000 | 6.3019 | 0.6587 | 9.5676 | \( < 0.0001 \) |
| year2001 | 7.3628 | 0.6536 | 11.2656 | \( < 0.0001 \) |
| year2002 | 7.4858 | 0.6503 | 11.5106 | \( < 0.0001 \) |
| year2003 | 7.7060 | 0.6596 | 11.6835 | \( < 0.0001 \) |
| year2004 | 8.2838 | 0.6477 | 12.7905 | \( < 0.0001 \) |
| year2005 | 8.3527 | 0.6448 | 12.9545 | \( < 0.0001 \) |
| year2006 | 8.3868 | 0.6387 | 13.1301 | \( < 0.0001 \) |
| year2007 | 8.4348 | 0.6407 | 13.1652 | \( < 0.0001 \) |
| year2008 | 9.0647 | 0.6390 | 14.1859 | \( < 0.0001 \) |
| year2009 | 9.4157 | 0.6510 | 14.4640 | \( < 0.0001 \) |
| year2010 | 9.5503 | 0.6410 | 14.8993 | \( < 0.0001 \) |
| B. smooth terms | ||||
| s(thi_mean_t0_3d):paritymultiparous | 8.5445 | 8.5445 | 171.0640 | \( < 0.0001 \) |
| s(thi_mean_t0_3d):parityprimiparous | 7.2808 | 7.2808 | 110.8468 | \( < 0.0001 \) |
| s(days_in_milk_t):paritymultiparous | 13.6110 | 13.6110 | 145596.5407 | \( < 0.0001 \) |
| s(days_in_milk_t):parityprimiparous | 13.1557 | 13.1557 | 16561.7603 | \( < 0.0001 \) |
Model Diagnostics
THI Effect and Lactation Curve
D.6.2.2: Split Period: 2010 - 2023
Model Summary
| A. parametric coefficients | Estimate | Std. Error | t-value | p-value |
|---|---|---|---|---|
| (Intercept) | 23.4859 | 0.2774 | 84.6766 | \( < 0.0001 \) |
| parityprimiparous | -3.3904 | 0.0179 | -189.6220 | \( < 0.0001 \) |
| year2012 | 0.3216 | 0.2395 | 1.3429 | 0.1793 |
| year2013 | -0.0251 | 0.3195 | -0.0786 | 0.9374 |
| year2014 | 0.3655 | 0.3711 | 0.9849 | 0.3247 |
| year2015 | 0.3975 | 0.3590 | 1.1073 | 0.2682 |
| year2016 | 0.7377 | 0.3481 | 2.1191 | 0.0341 |
| year2017 | 1.0088 | 0.3421 | 2.9486 | 0.0032 |
| year2018 | 1.6322 | 0.3411 | 4.7847 | \( < 0.0001 \) |
| year2019 | 1.8740 | 0.3446 | 5.4377 | \( < 0.0001 \) |
| year2020 | 1.7913 | 0.3555 | 5.0392 | \( < 0.0001 \) |
| year2021 | 2.1038 | 0.3165 | 6.6463 | \( < 0.0001 \) |
| year2022 | 1.6923 | 0.3868 | 4.3751 | \( < 0.0001 \) |
| year2023 | 1.9646 | 0.4575 | 4.2945 | \( < 0.0001 \) |
| B. smooth terms | ||||
| s(thi_mean_t0_3d):paritymultiparous | 8.1229 | 8.1229 | 143.3874 | \( < 0.0001 \) |
| s(thi_mean_t0_3d):parityprimiparous | 6.2808 | 6.2808 | 220.4726 | \( < 0.0001 \) |
| s(days_in_milk_t):paritymultiparous | 13.8166 | 13.8166 | 68629.0617 | \( < 0.0001 \) |
| s(days_in_milk_t):parityprimiparous | 13.1007 | 13.1007 | 5270.4166 | \( < 0.0001 \) |
| Smooth Term Fixed Effect | Est. | SE | z | p |
|---|---|---|---|---|
| s(thi_mean_t0_3d):multiFx1 | -0.1276 | 0.0935 | -1.36 | 0.1723 |
| s(thi_mean_t0_3d):primiFx1 | -0.4146 | 0.1111 | -3.73 | 0.0002 |
| s(days_in_milk_):multiFx1 | 0.9924 | 0.3473 | 2.86 | 0.0043 |
| s(days_in_milk_):primiFx1 | 2.9394 | 0.5111 | 5.75 | \( < 1e-08 \) |
| Variance Component | ||||
| \( \sigma_\alpha \) | 2.7558 | |||
| \( \sigma_\iota \) | 1.2690 | |||
| \( \sigma_\phi \) | 3.8693 | |||
| s(thi_mean_t0_3d):multi | 1.9064 | |||
| s(days_in_milk_):primi | 7.3548 | |||
| s(days_in_milk_):multi | 11.0965 | |||
| s(thi_mean_t0_3d):primi | 1.2442 | |||
| Residual | 4.0650 | |||
Model Diagnostics
THI Effect and Lactation Curve