D.4 Swiss Fleckvieh: ECM Yield
D.4.1: Full Period: 1984-2023
Model Summary
| A. parametric coefficients | Estimate | Std. Error | t-value | p-value |
|---|---|---|---|---|
| (Intercept) | 18.9428 | 2.0368 | 9.3002 | \(< 0.0001\) |
| parityprimiparous | -3.3689 | 0.0142 | -236.8632 | \(< 0.0001\) |
| year1985 | 0.4371 | 2.0474 | 0.2135 | 0.8309 |
| year1986 | 0.3102 | 2.0464 | 0.1516 | 0.8795 |
| year1987 | 0.0716 | 2.0478 | 0.0349 | 0.9721 |
| year1988 | -0.3584 | 2.0554 | -0.1744 | 0.8616 |
| year1989 | 0.4960 | 2.0565 | 0.2412 | 0.8094 |
| year1990 | 0.9176 | 2.0553 | 0.4464 | 0.6553 |
| year1991 | 1.1455 | 2.0556 | 0.5572 | 0.5774 |
| year1992 | 1.4593 | 2.0517 | 0.7113 | 0.4769 |
| year1993 | 1.3829 | 2.0517 | 0.6740 | 0.5003 |
| year1994 | 1.2177 | 2.0522 | 0.5933 | 0.5530 |
| year1995 | 1.5433 | 2.0564 | 0.7505 | 0.4530 |
| year1996 | 1.7761 | 2.0557 | 0.8640 | 0.3876 |
| year1997 | 2.2786 | 2.0564 | 1.1081 | 0.2678 |
| year1998 | 3.1880 | 2.0566 | 1.5502 | 0.1211 |
| year1999 | 3.1331 | 2.0596 | 1.5212 | 0.1282 |
| year2000 | 3.0081 | 2.0612 | 1.4594 | 0.1445 |
| year2001 | 3.3840 | 2.0762 | 1.6299 | 0.1031 |
| year2002 | 3.4445 | 2.0684 | 1.6653 | 0.0959 |
| year2003 | 3.9752 | 2.0675 | 1.9227 | 0.0545 |
| year2004 | 4.4635 | 2.0679 | 2.1585 | 0.0309 |
| year2005 | 4.8537 | 2.0704 | 2.3444 | 0.0191 |
| year2006 | 4.7686 | 2.0692 | 2.3046 | 0.0212 |
| year2007 | 4.4191 | 2.0694 | 2.1354 | 0.0327 |
| year2008 | 4.6589 | 2.0682 | 2.2526 | 0.0243 |
| year2009 | 4.8424 | 2.0665 | 2.3433 | 0.0191 |
| year2010 | 5.3358 | 2.0644 | 2.5847 | 0.0097 |
| year2011 | 5.2852 | 2.0614 | 2.5639 | 0.0104 |
| year2012 | 5.2468 | 2.0608 | 2.5460 | 0.0109 |
| year2013 | 5.0911 | 2.0603 | 2.4711 | 0.0135 |
| year2014 | 5.6526 | 2.0607 | 2.7430 | 0.0061 |
| year2015 | 6.1039 | 2.0609 | 2.9618 | 0.0031 |
| year2016 | 6.3861 | 2.0608 | 3.0989 | 0.0019 |
| year2017 | 6.4411 | 2.0613 | 3.1249 | 0.0018 |
| year2018 | 7.2593 | 2.0617 | 3.5210 | 0.0004 |
| year2019 | 7.3393 | 2.0627 | 3.5581 | 0.0004 |
| year2020 | 7.8516 | 2.0673 | 3.7979 | \(< 0.0001\) |
| year2021 | 8.0252 | 2.0703 | 3.8763 | \(< 0.0001\) |
| year2022 | 7.7722 | 2.0760 | 3.7437 | \(< 0.0002\) |
| year2023 | 8.3910 | 2.0798 | 4.0346 | \(< 0.0001\) |
| B. smooth terms | edf | Ref.df | F-value | p-value |
|---|---|---|---|---|
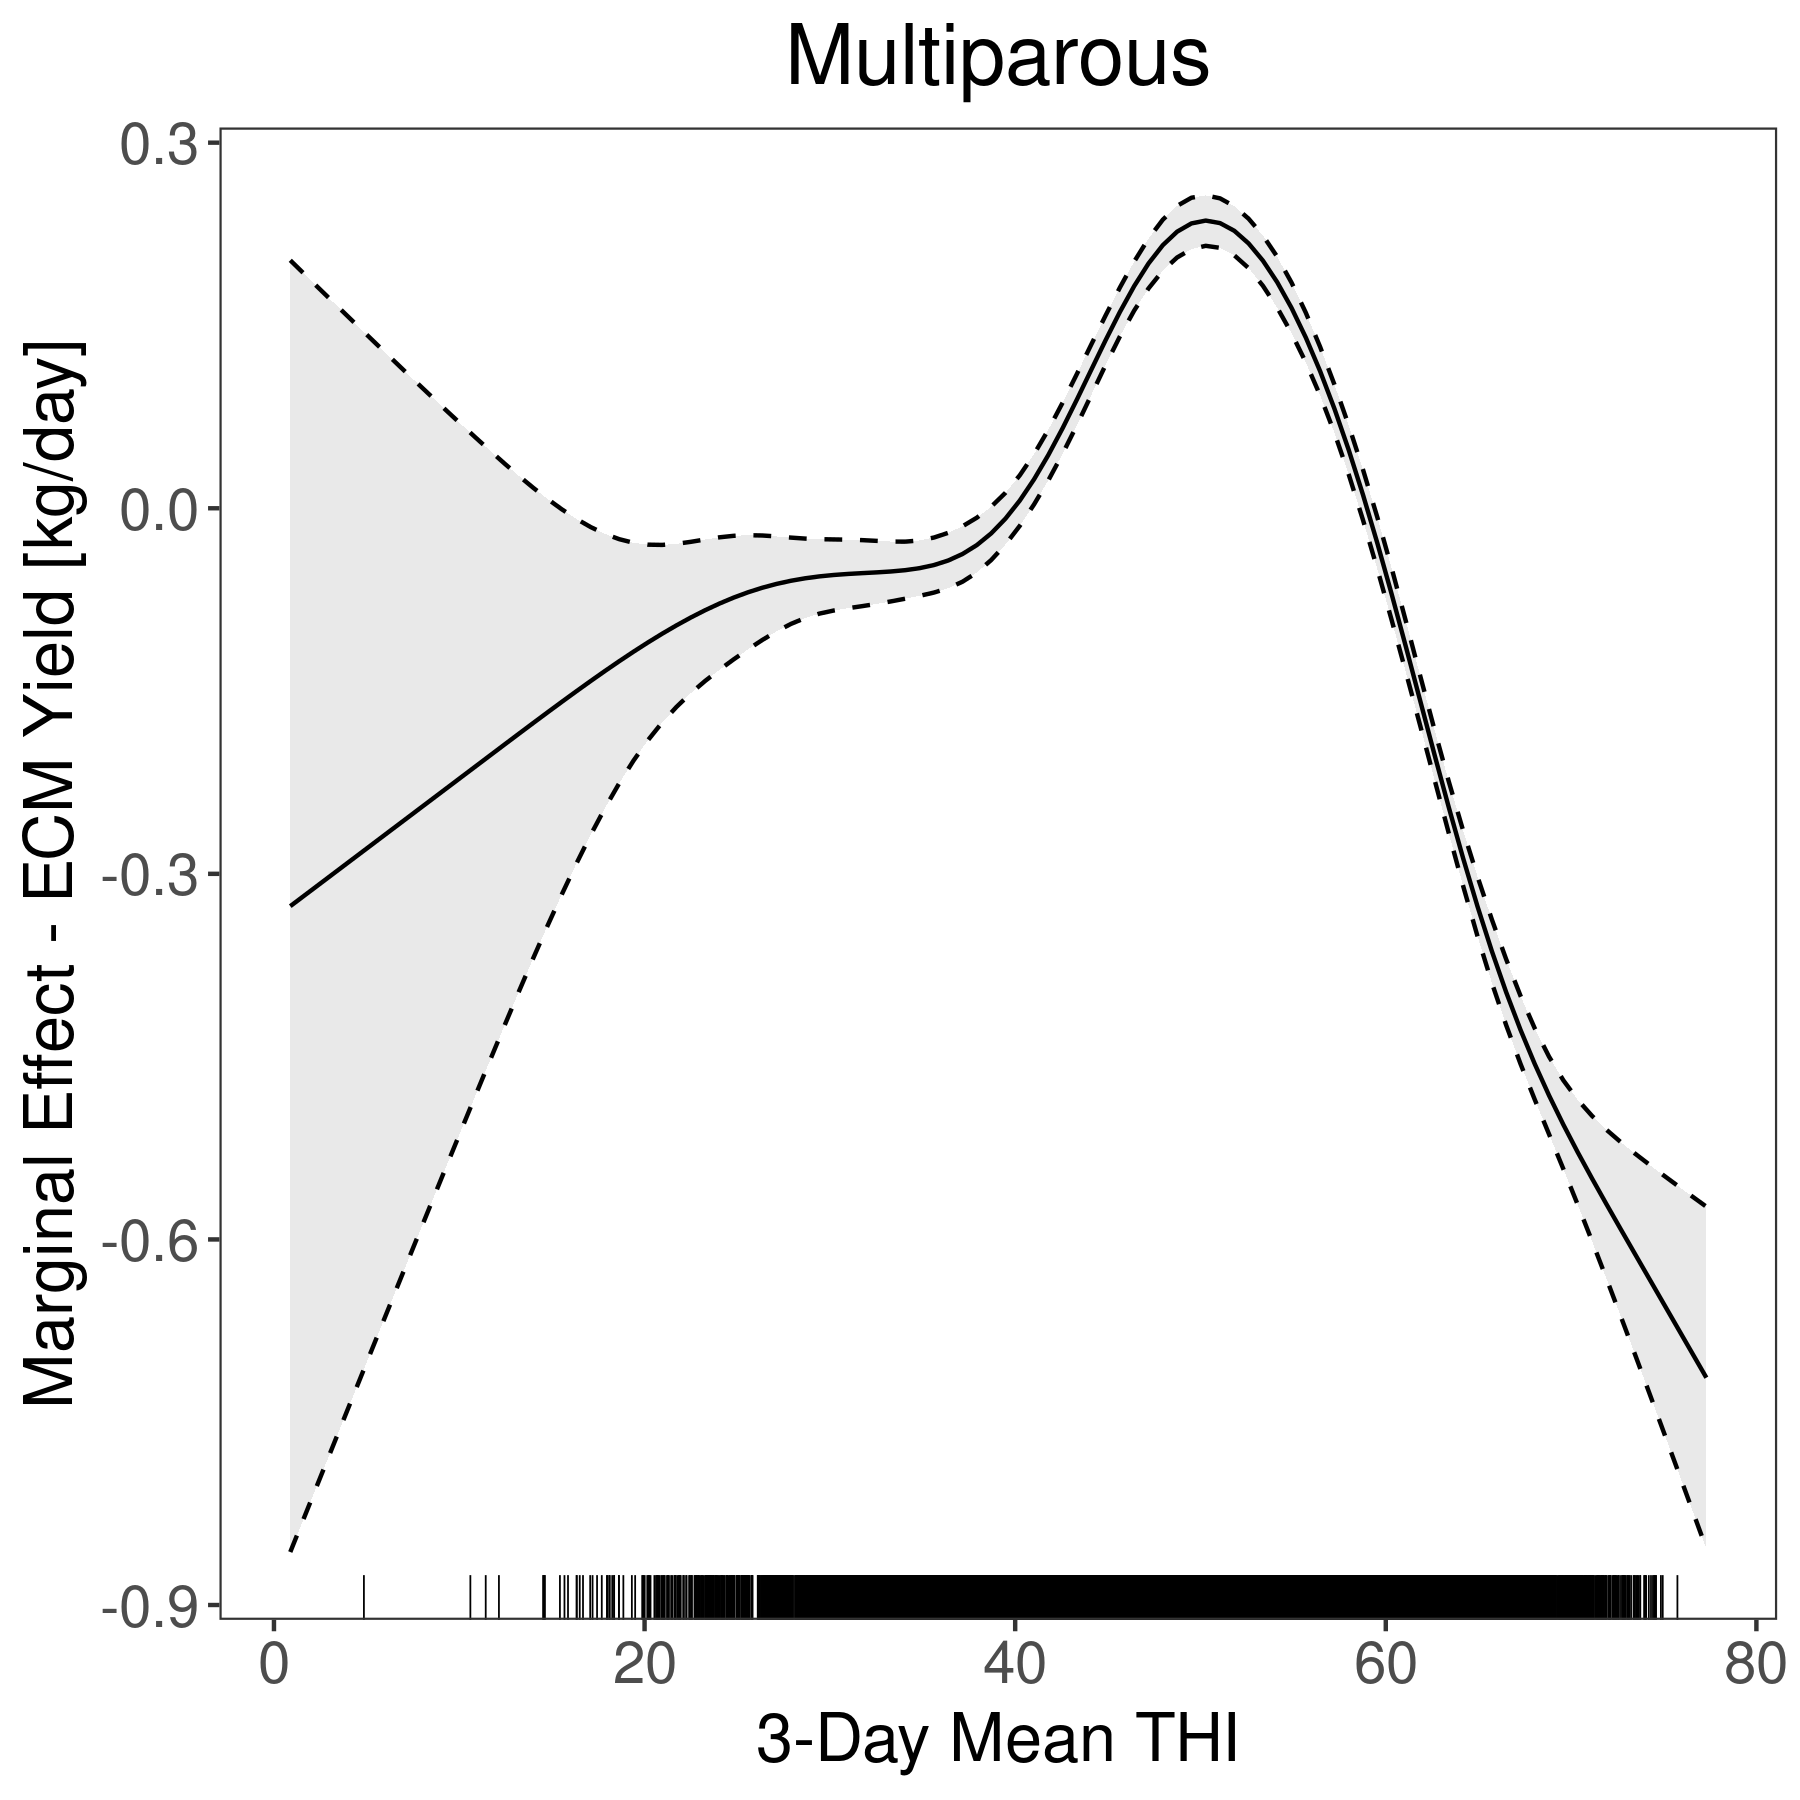
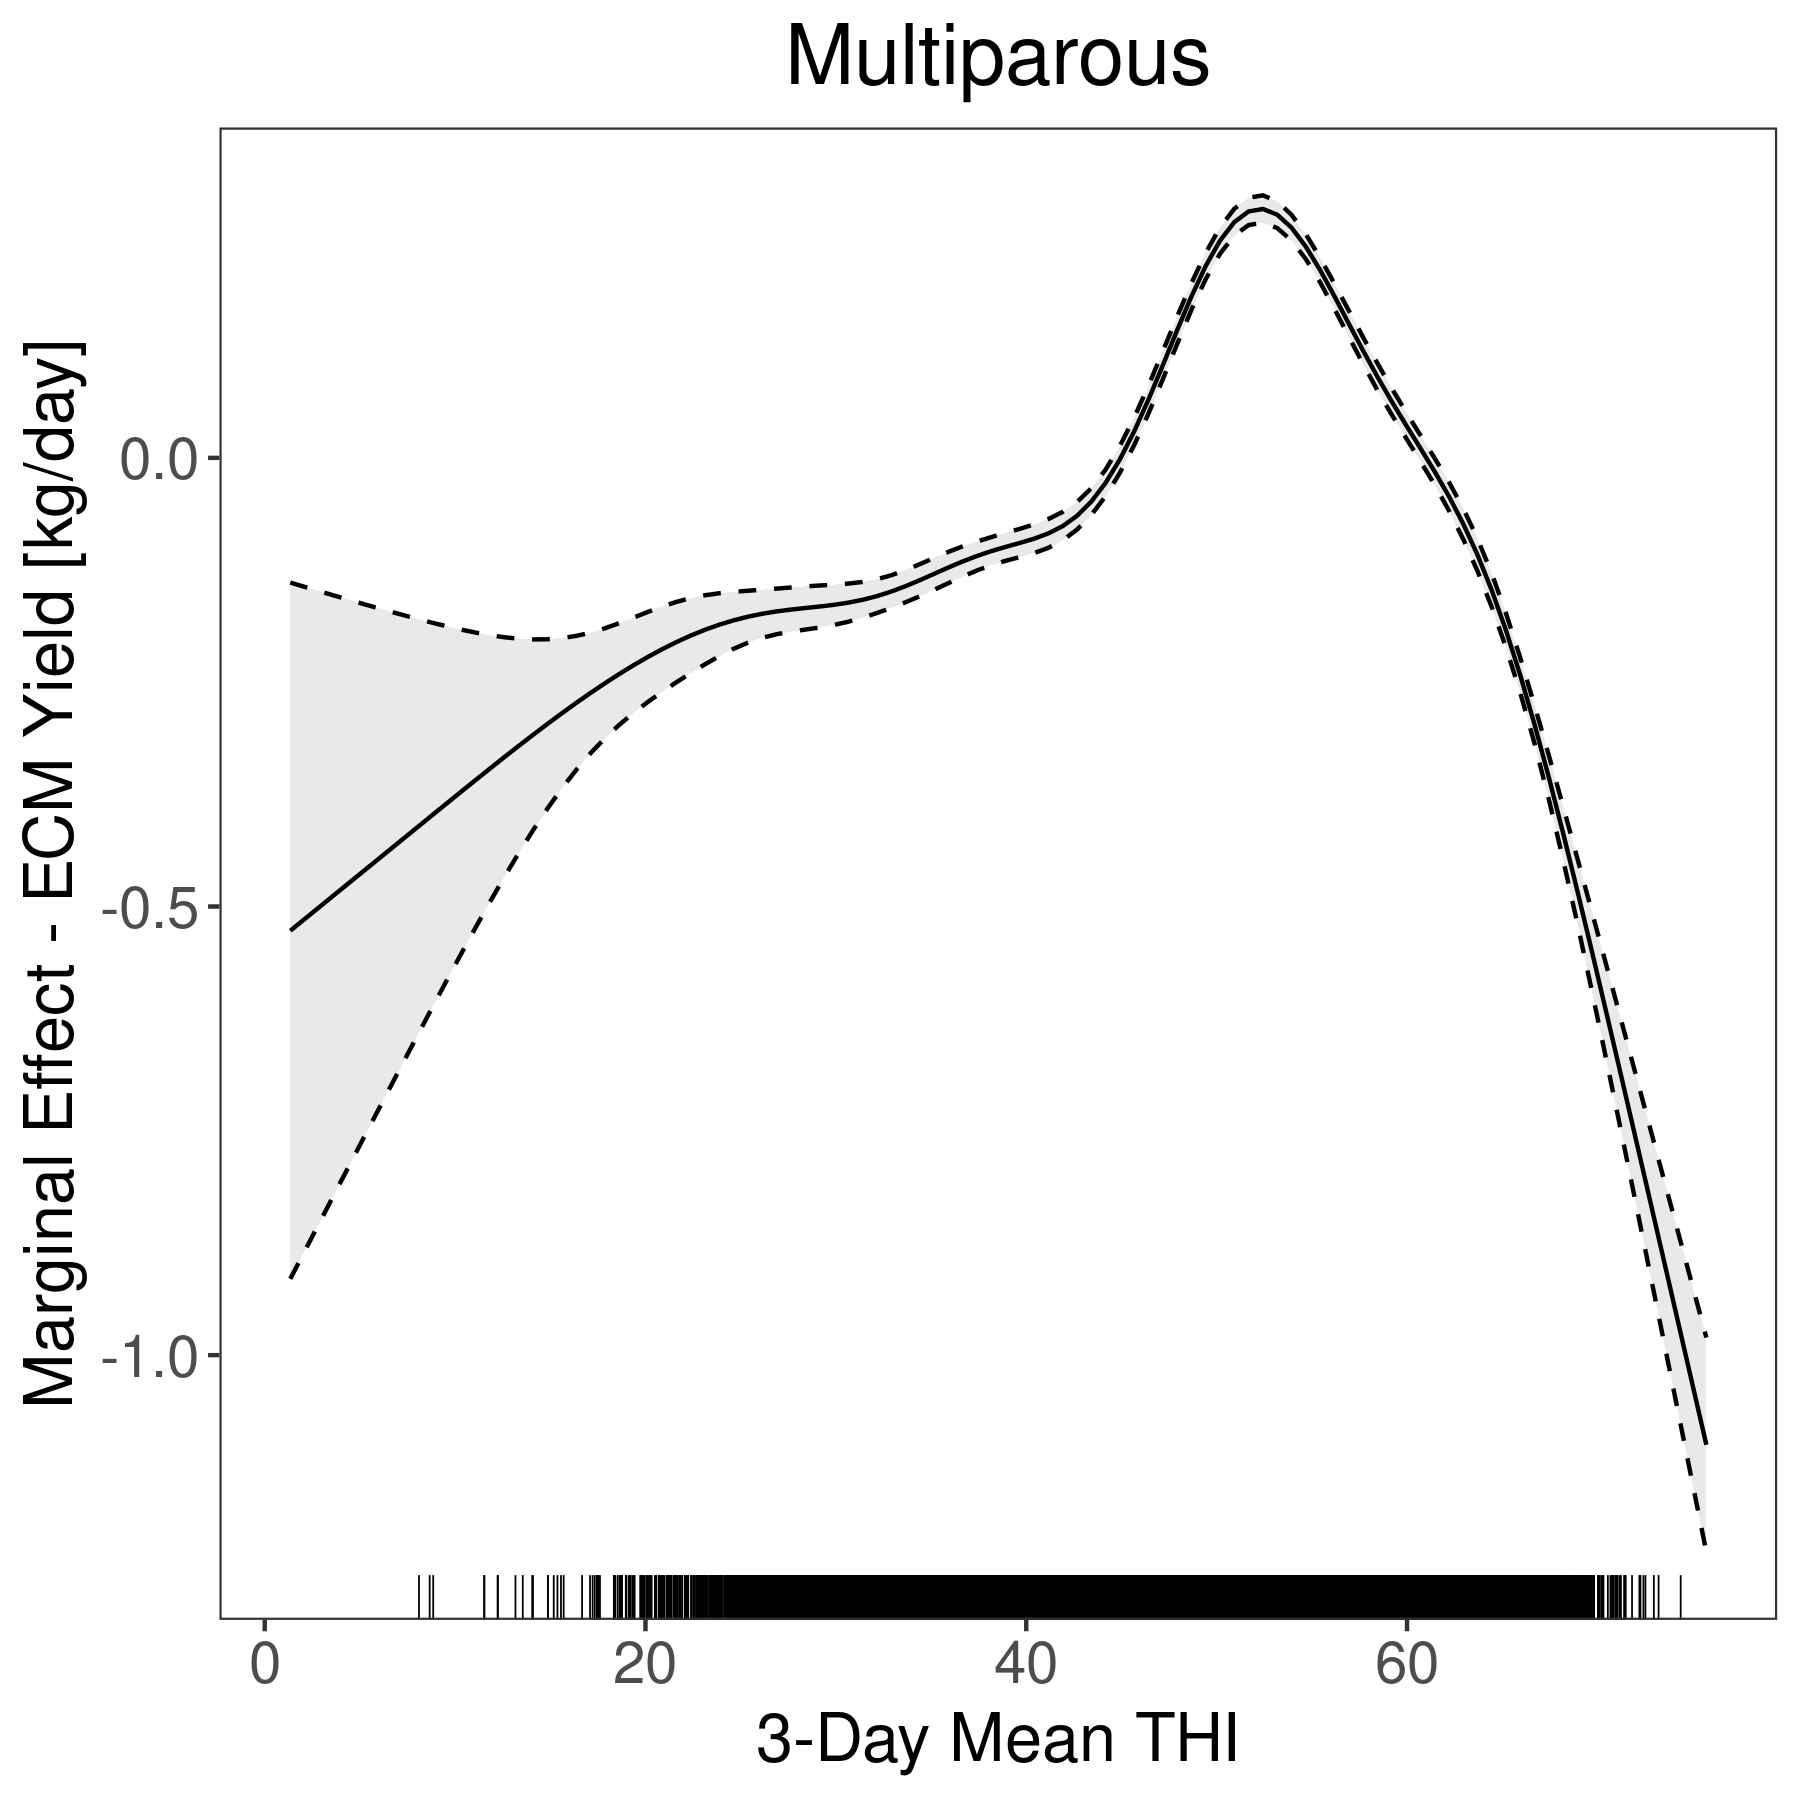
| s(thi_mean_t0_3d):paritymultiparous | 8.5041 | 8.5041 | 234.1182 | \(< 0.0001\) |
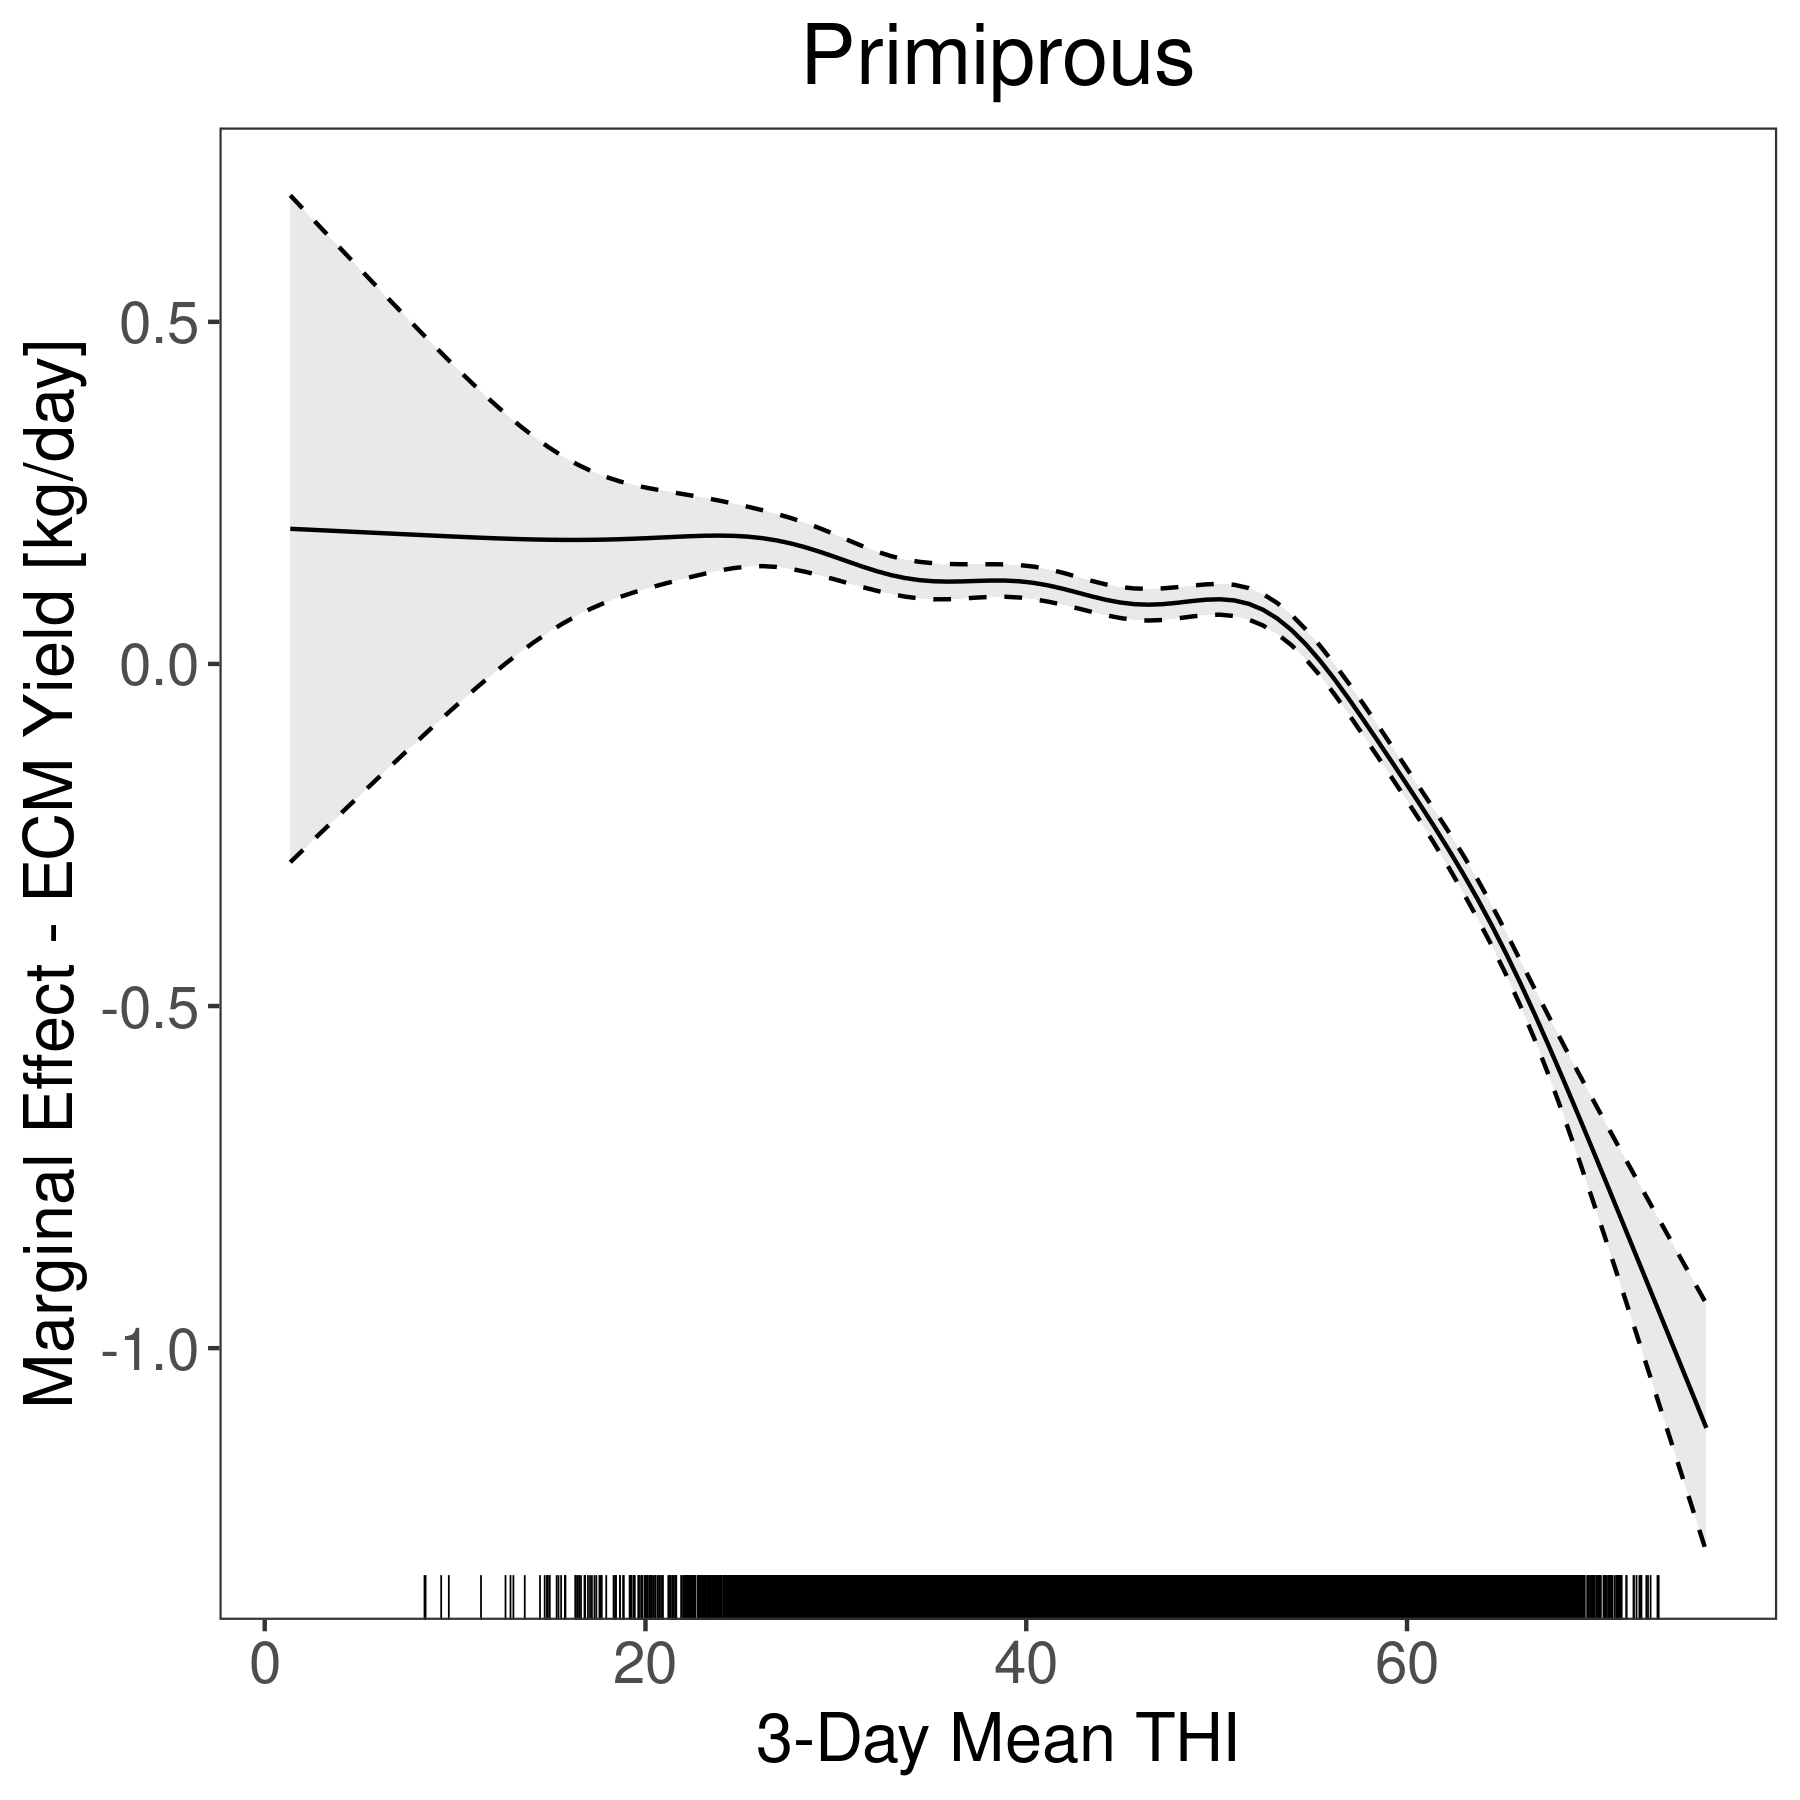
| s(thi_mean_t0_3d):parityprimiparous | 6.4177 | 6.4177 | 140.2851 | \(< 0.0001\) |
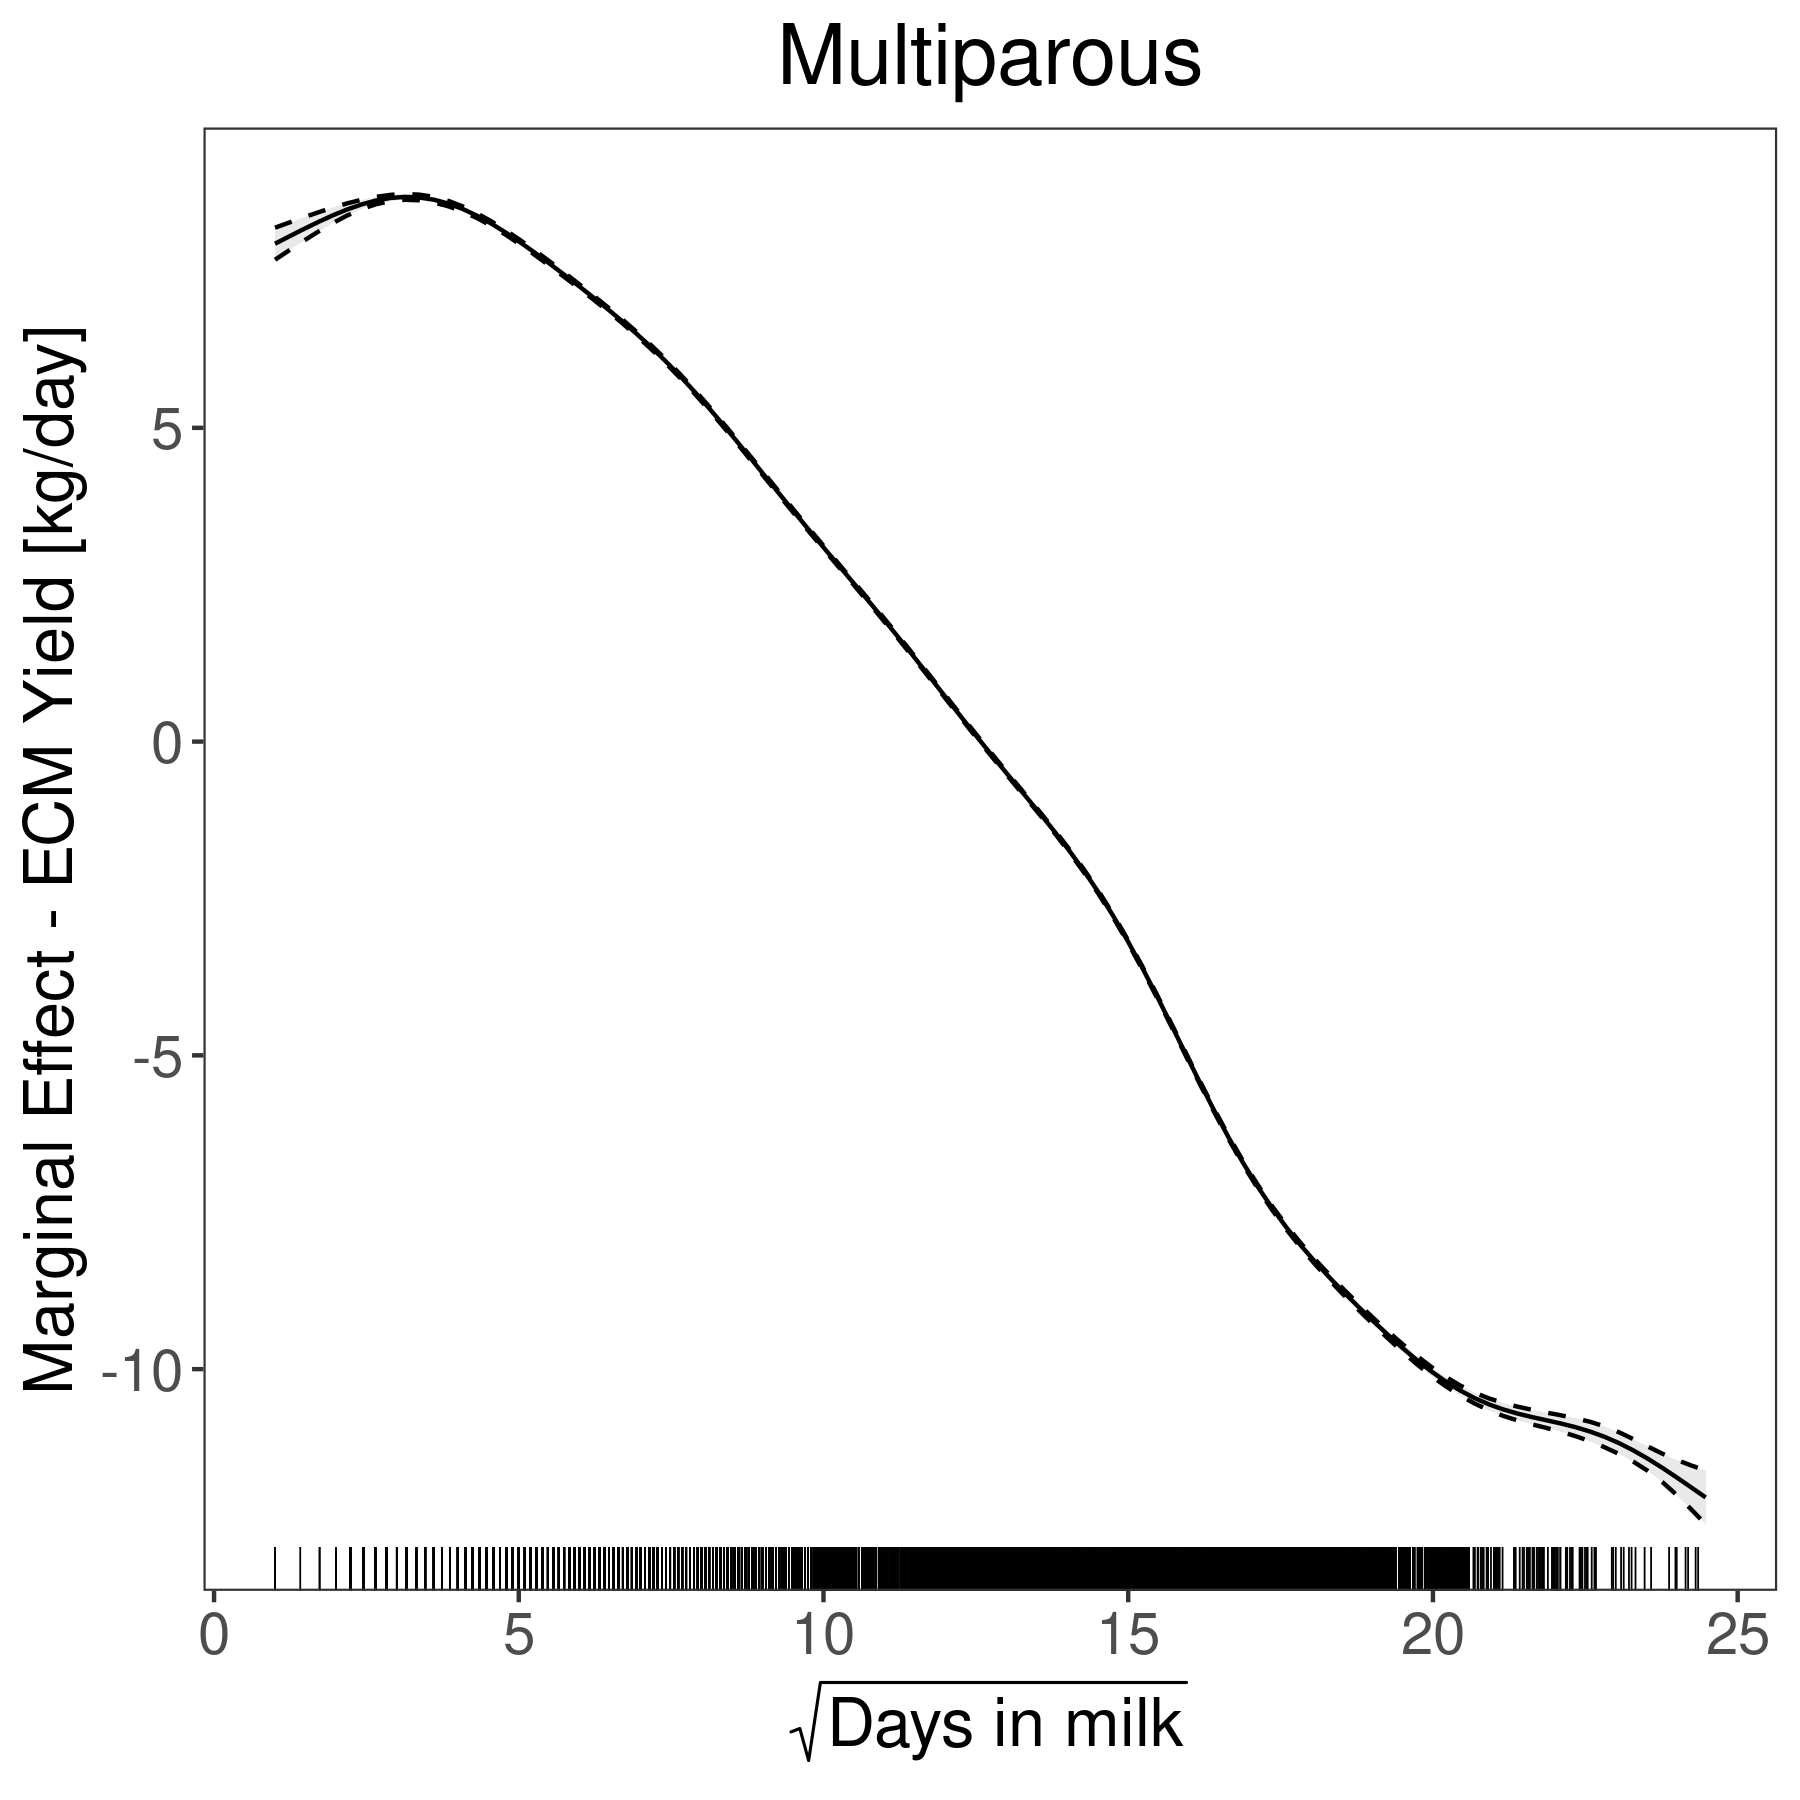
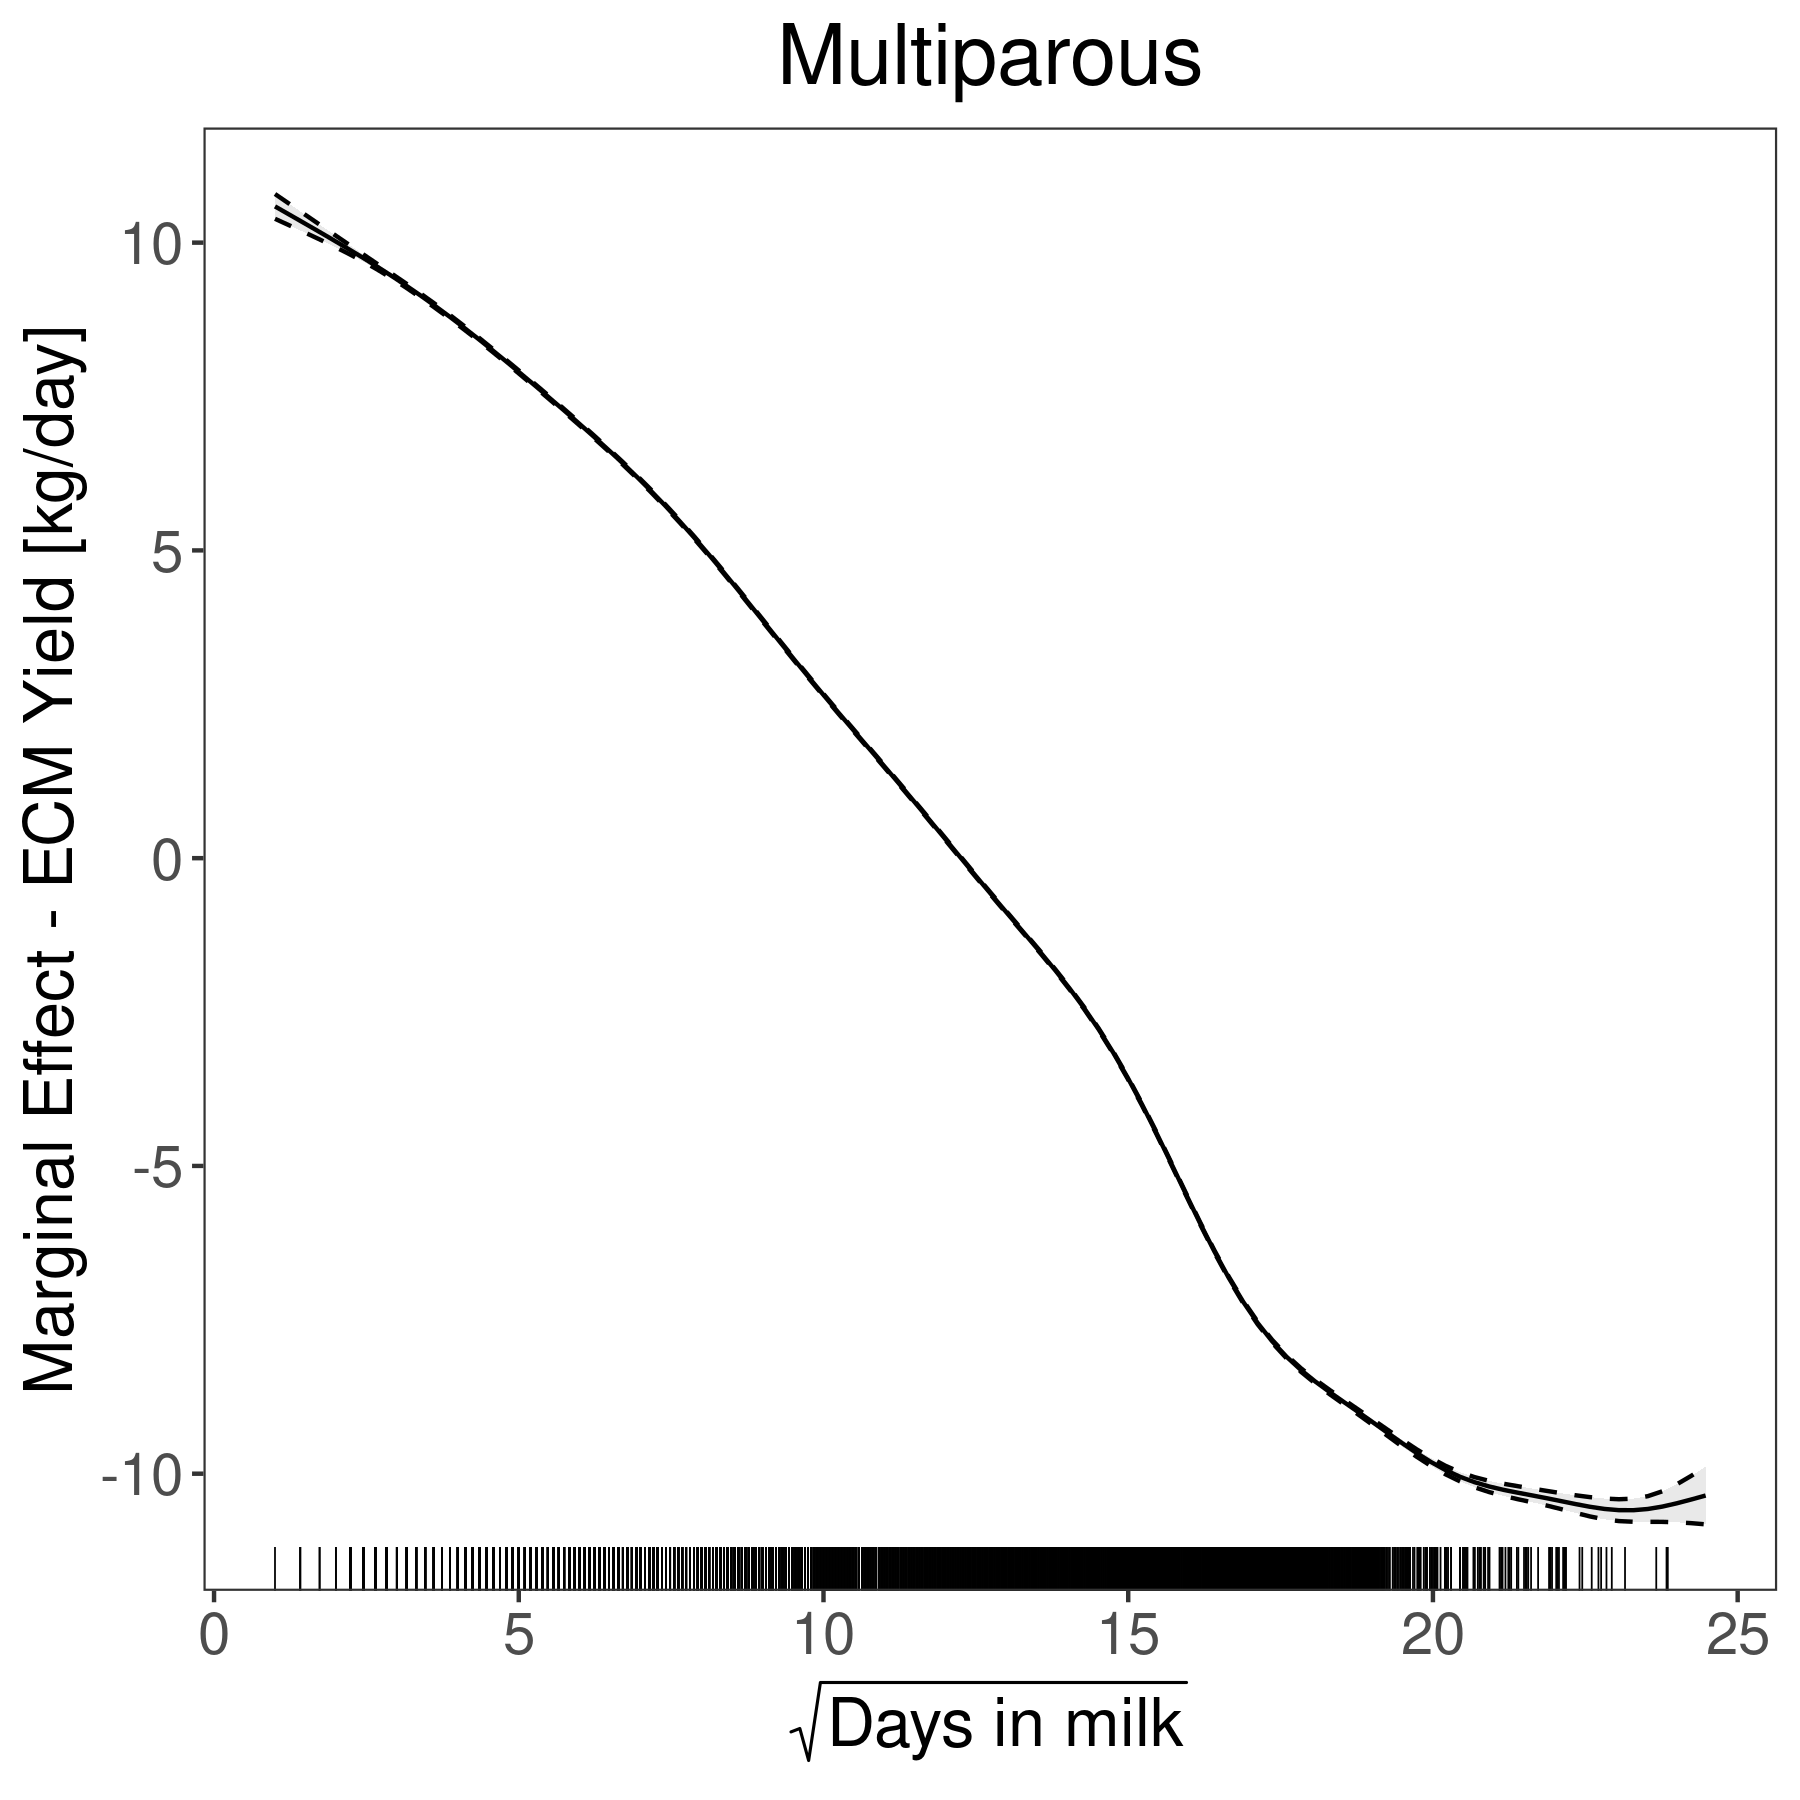
| s(days_in_milk_t):paritymultiparous | 14.1442 | 14.1442 | 103387.1413 | \(< 0.0001\) |
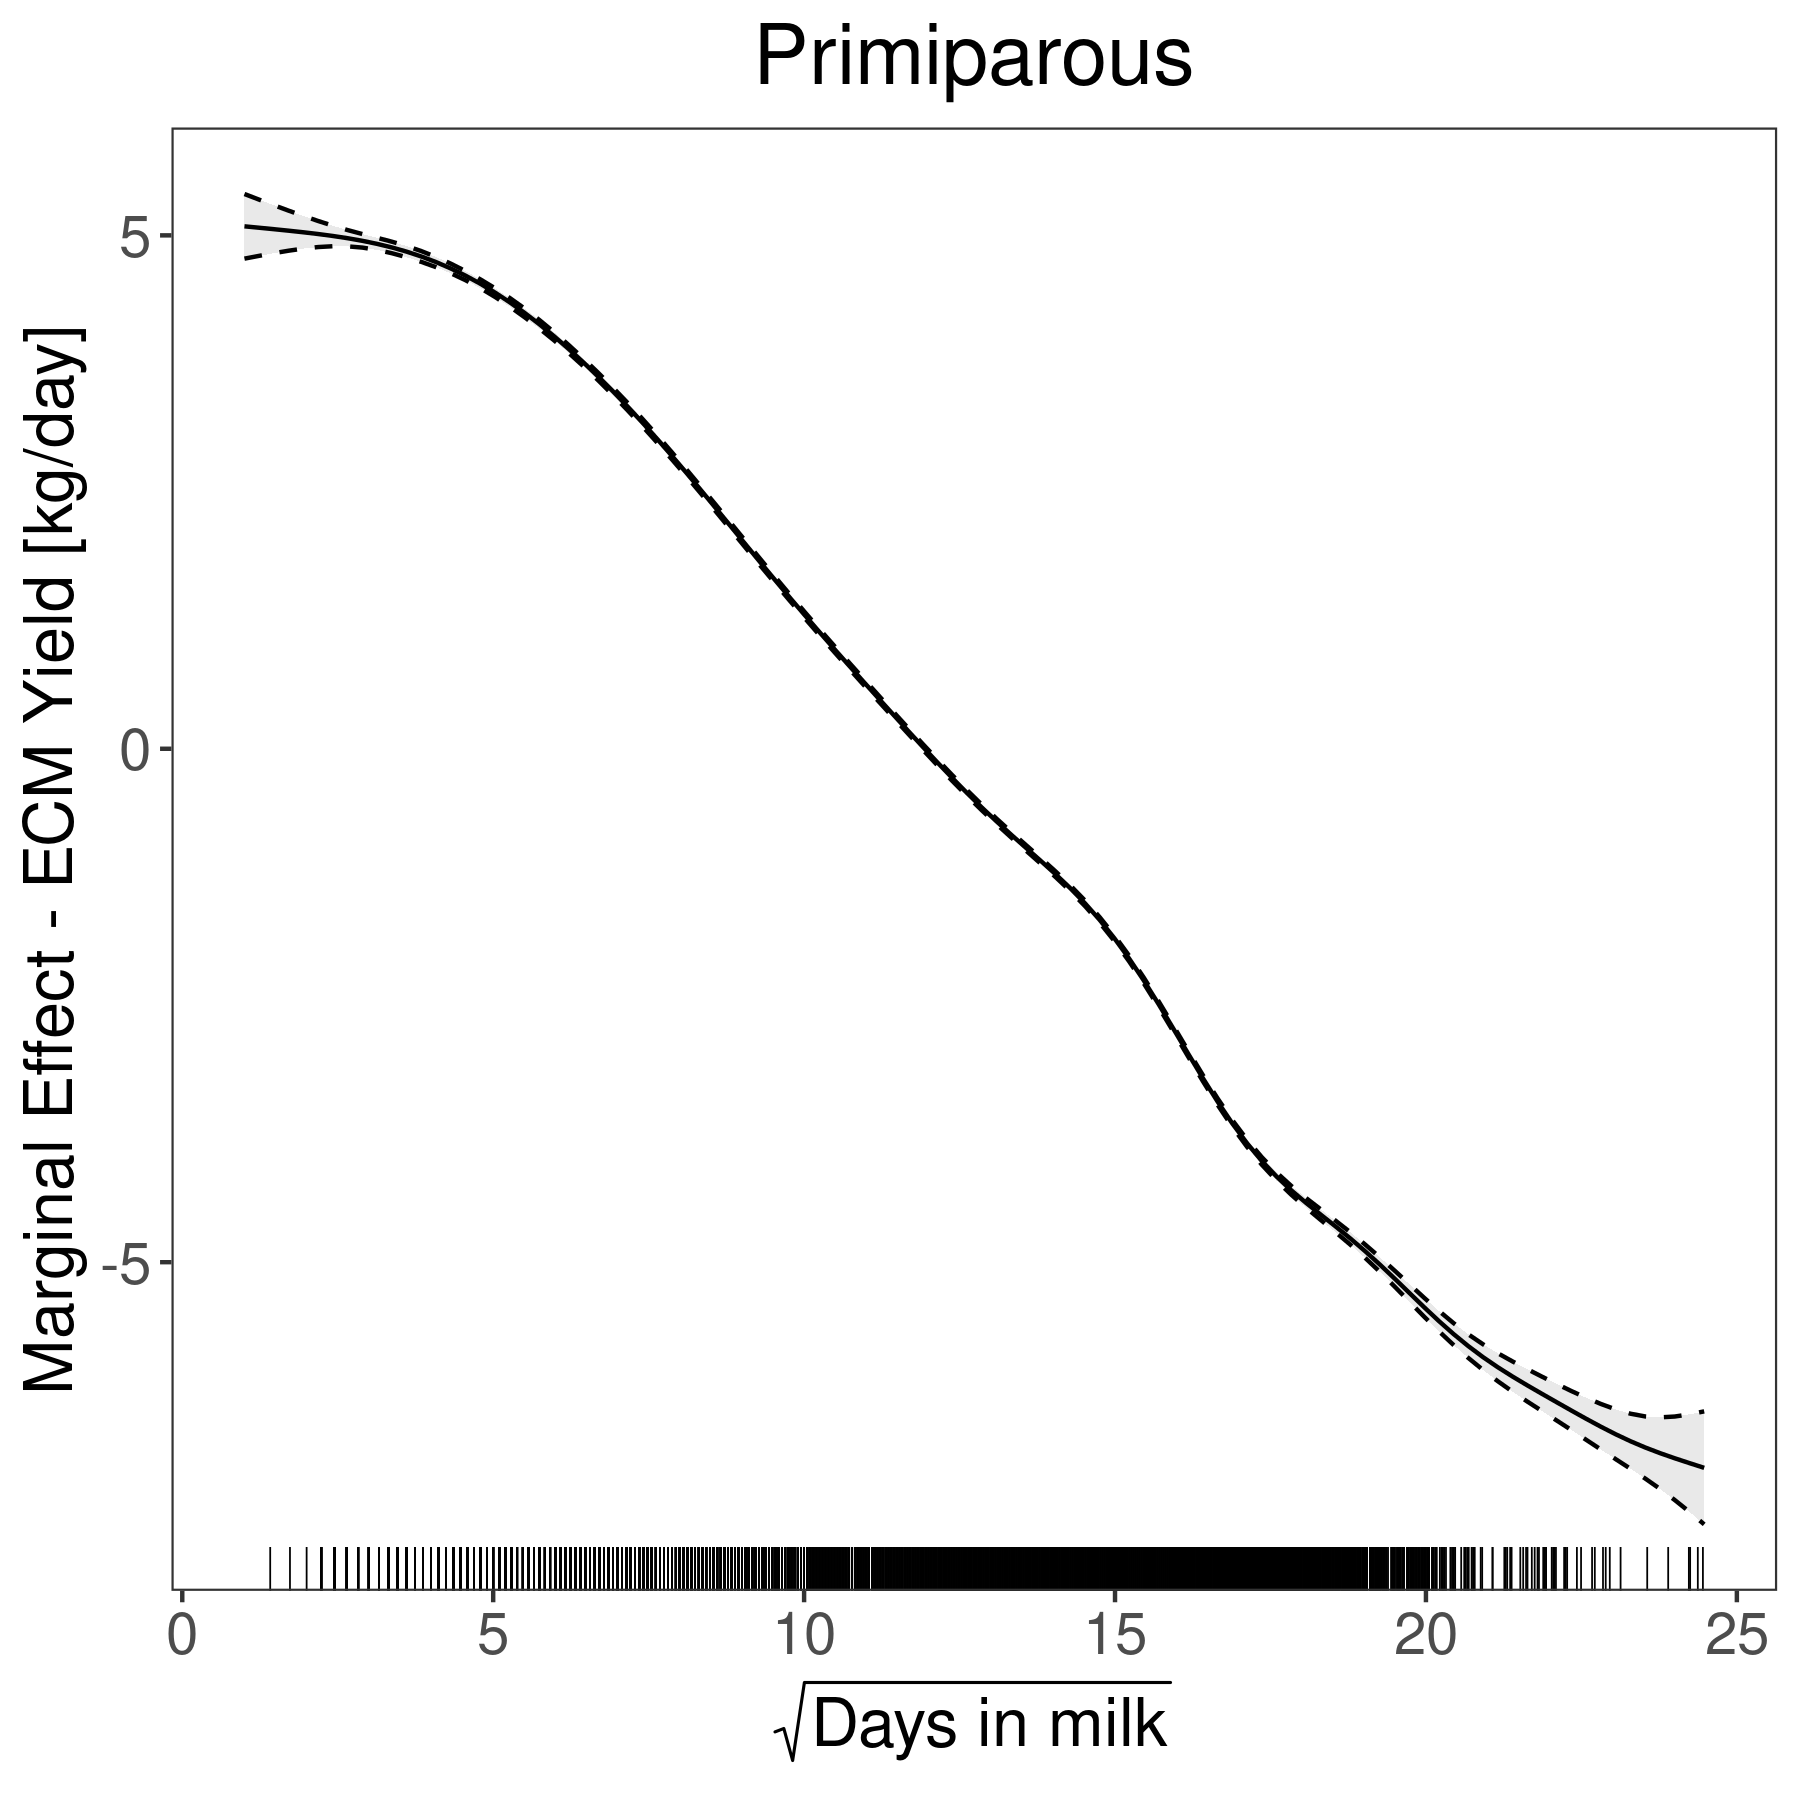
| s(days_in_milk_t):parityprimiparous | 12.3534 | 12.3534 | 9446.9365 | \(< 0.0001\) |
| Smooth Term Fixed Effect | Est. | SE | z | p |
|---|---|---|---|---|
| s(thi_mean_t0_3d):multiFx1 | 0.4379 | 0.0980 | 4.47 | \(< 1e-05\) |
| s(thi_mean_t0_3d):primiFx1 | 0.5091 | 0.1123 | 4.53 | \(< 1e-05\) |
| s(days_in_milk_):multiFx1 | 0.1549 | 0.5426 | 0.29 | 0.7752 |
| s(days_in_milk_):primiFx1 | -0.4183 | 0.5123 | -0.82 | 0.4142 |
| Variance Component | Estimated \( \sigma \) | |||
|---|---|---|---|---|
| \( \sigma_\alpha \) | 2.7441 | |||
| \( \sigma_\iota \) | 0.9269 | |||
| \( \sigma_\phi \) | 3.2102 | |||
| s(thi_mean_t0_3d):multi | 2.3885 | |||
| s(days_in_milk_):primi | 4.1628 | |||
| s(days_in_milk_):multi | 7.4804 | |||
| s(thi_mean_t0_3d):primi | 1.1828 | |||
| Residual | 3.4443 |
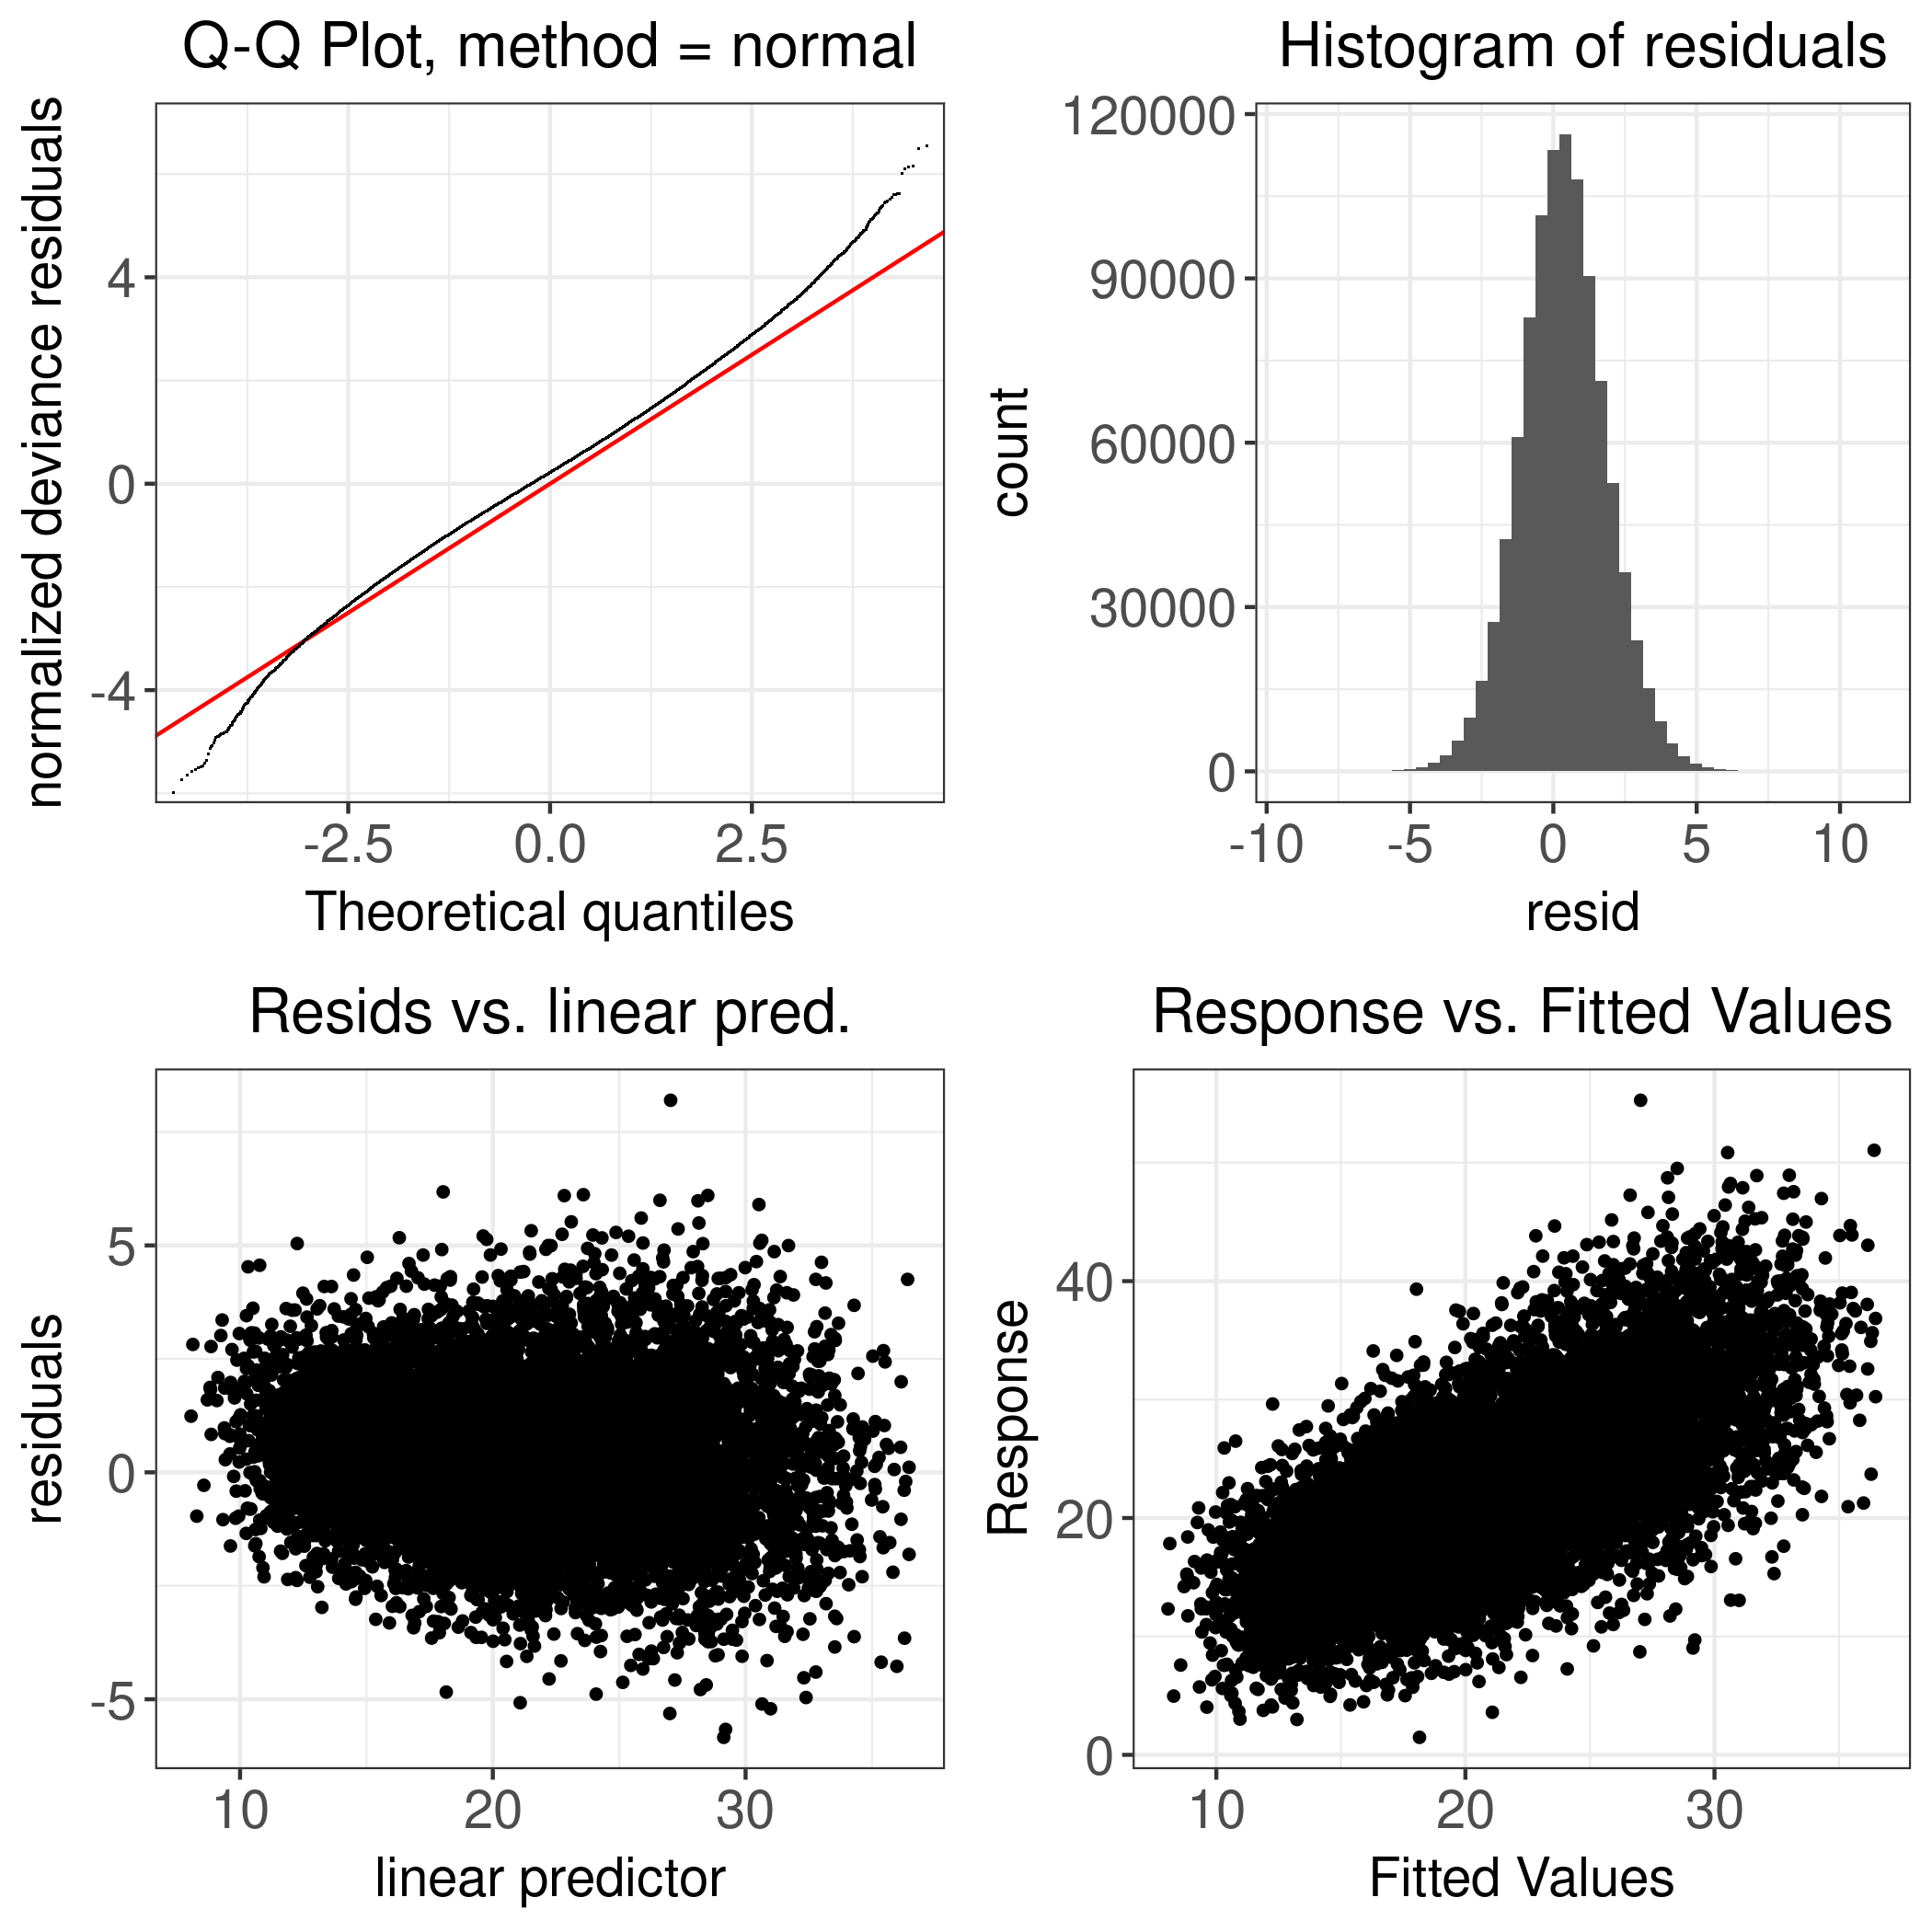
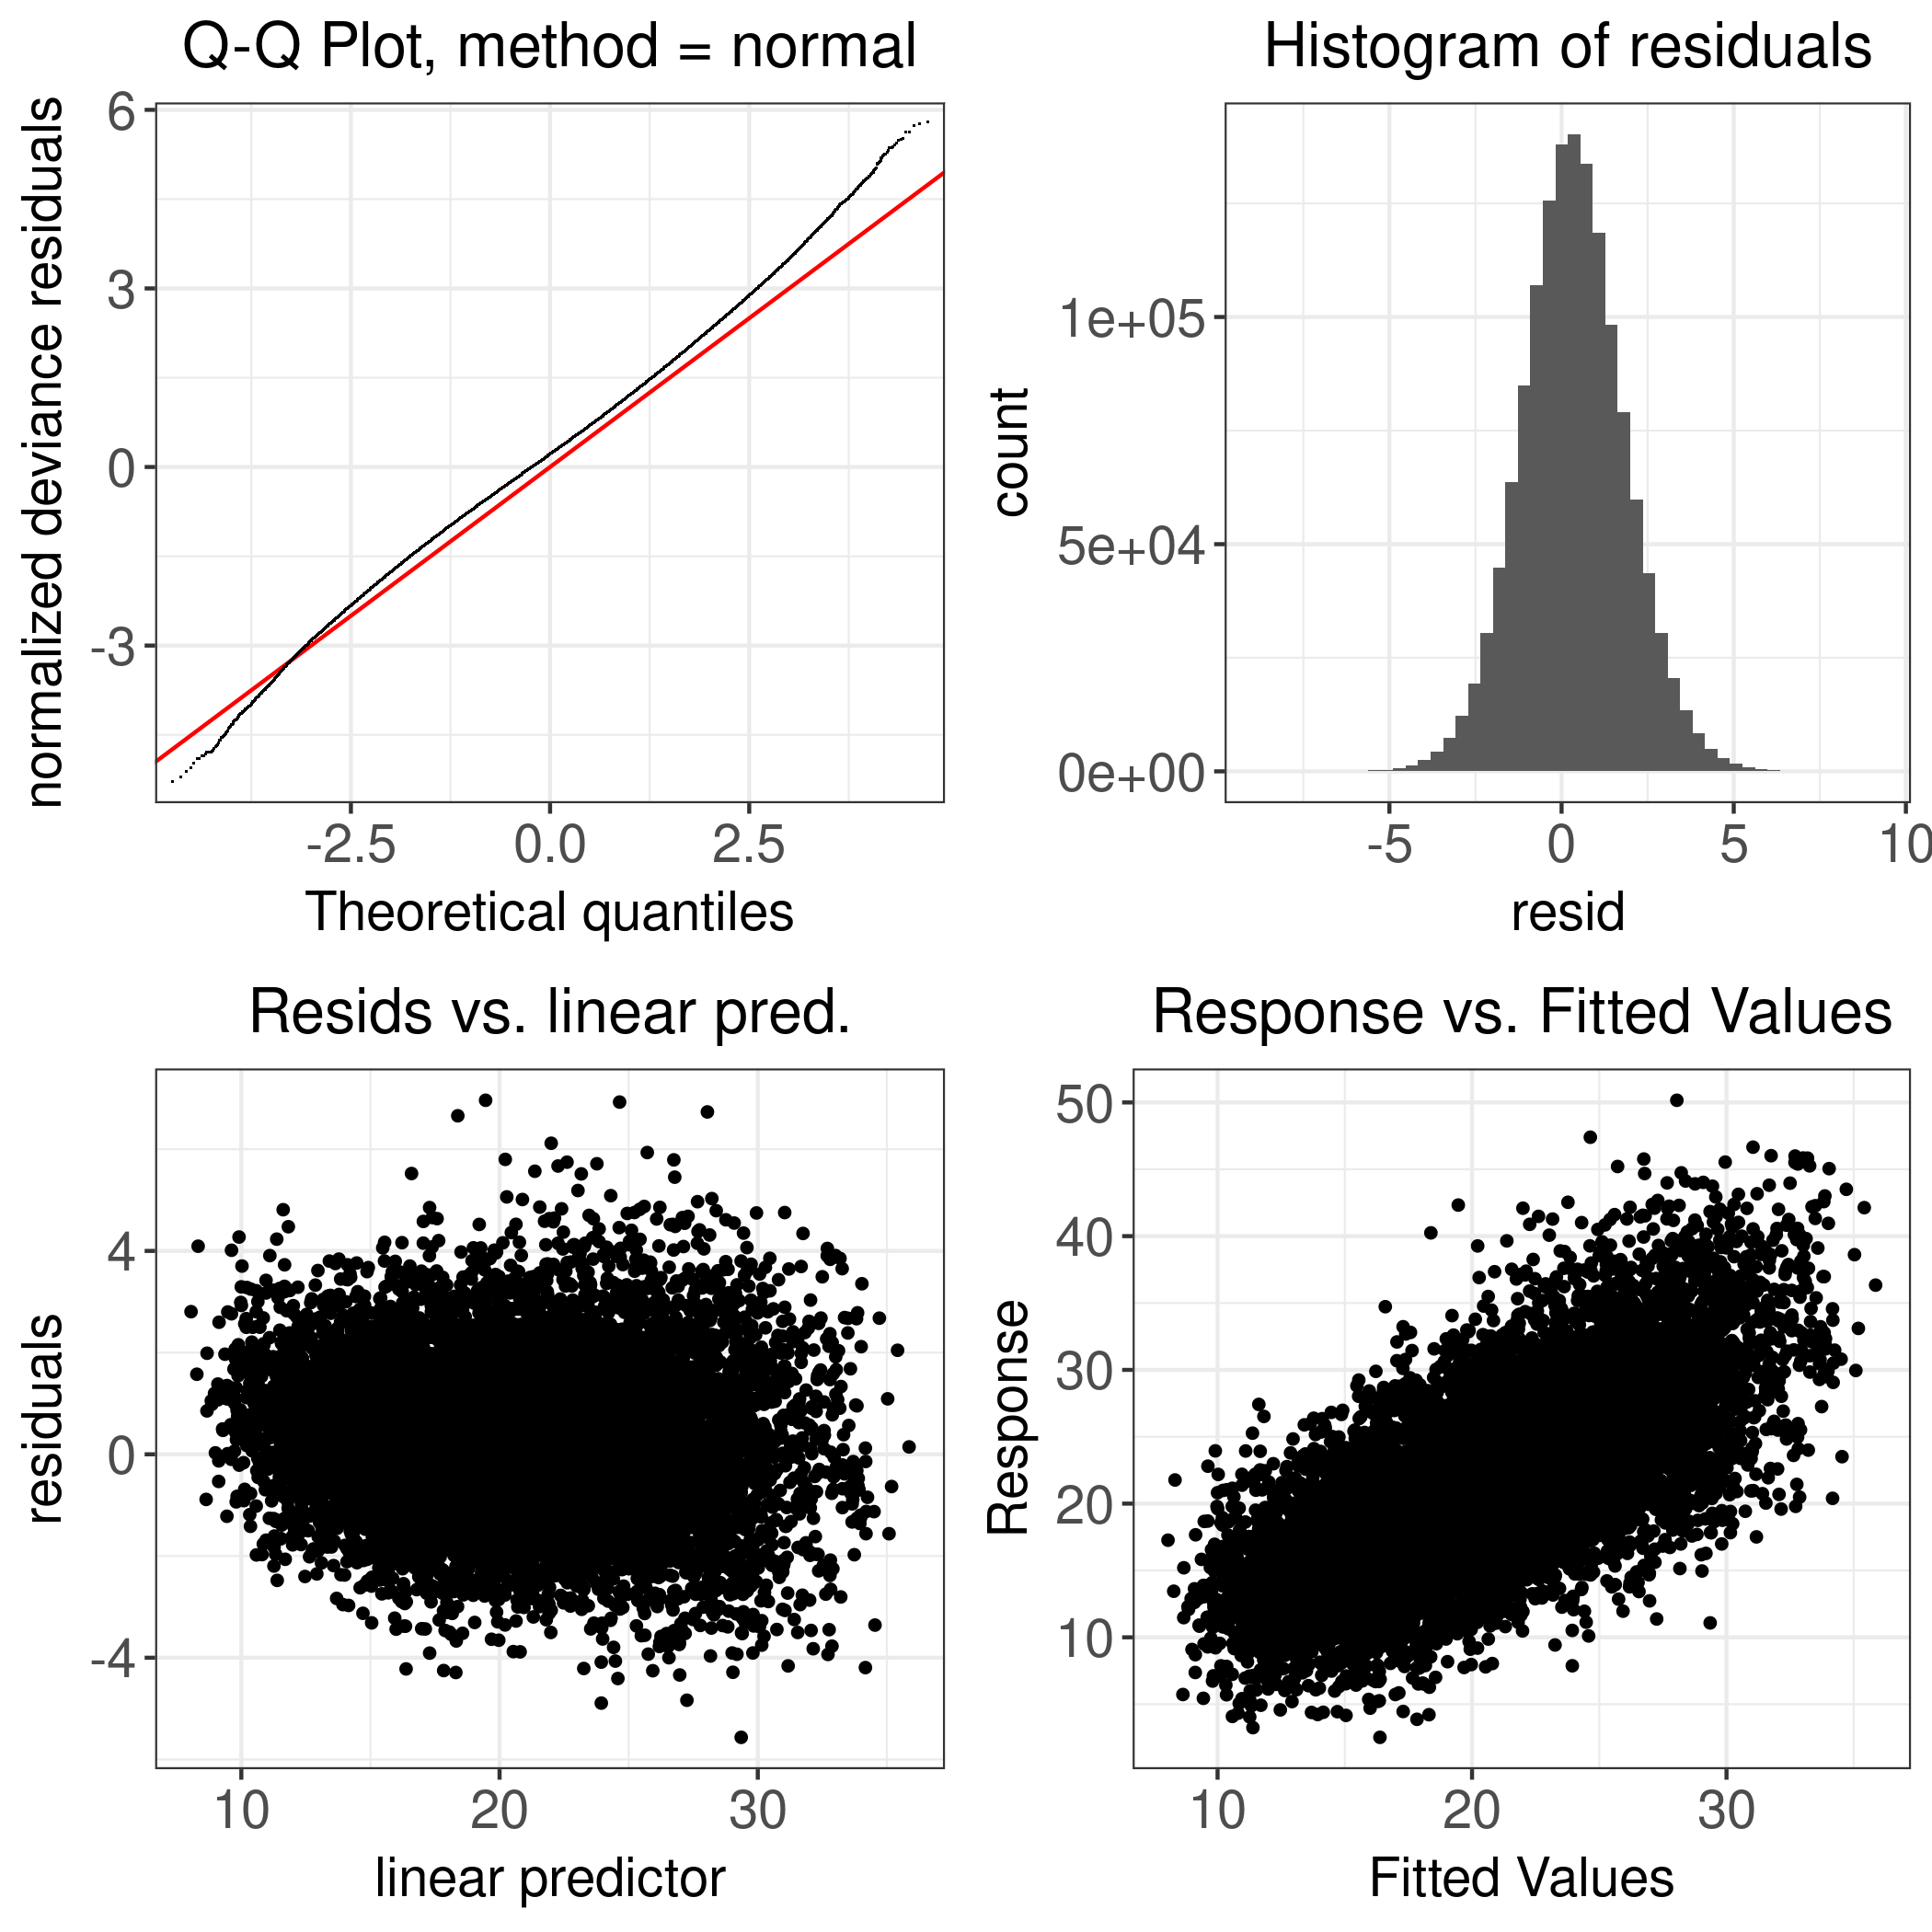
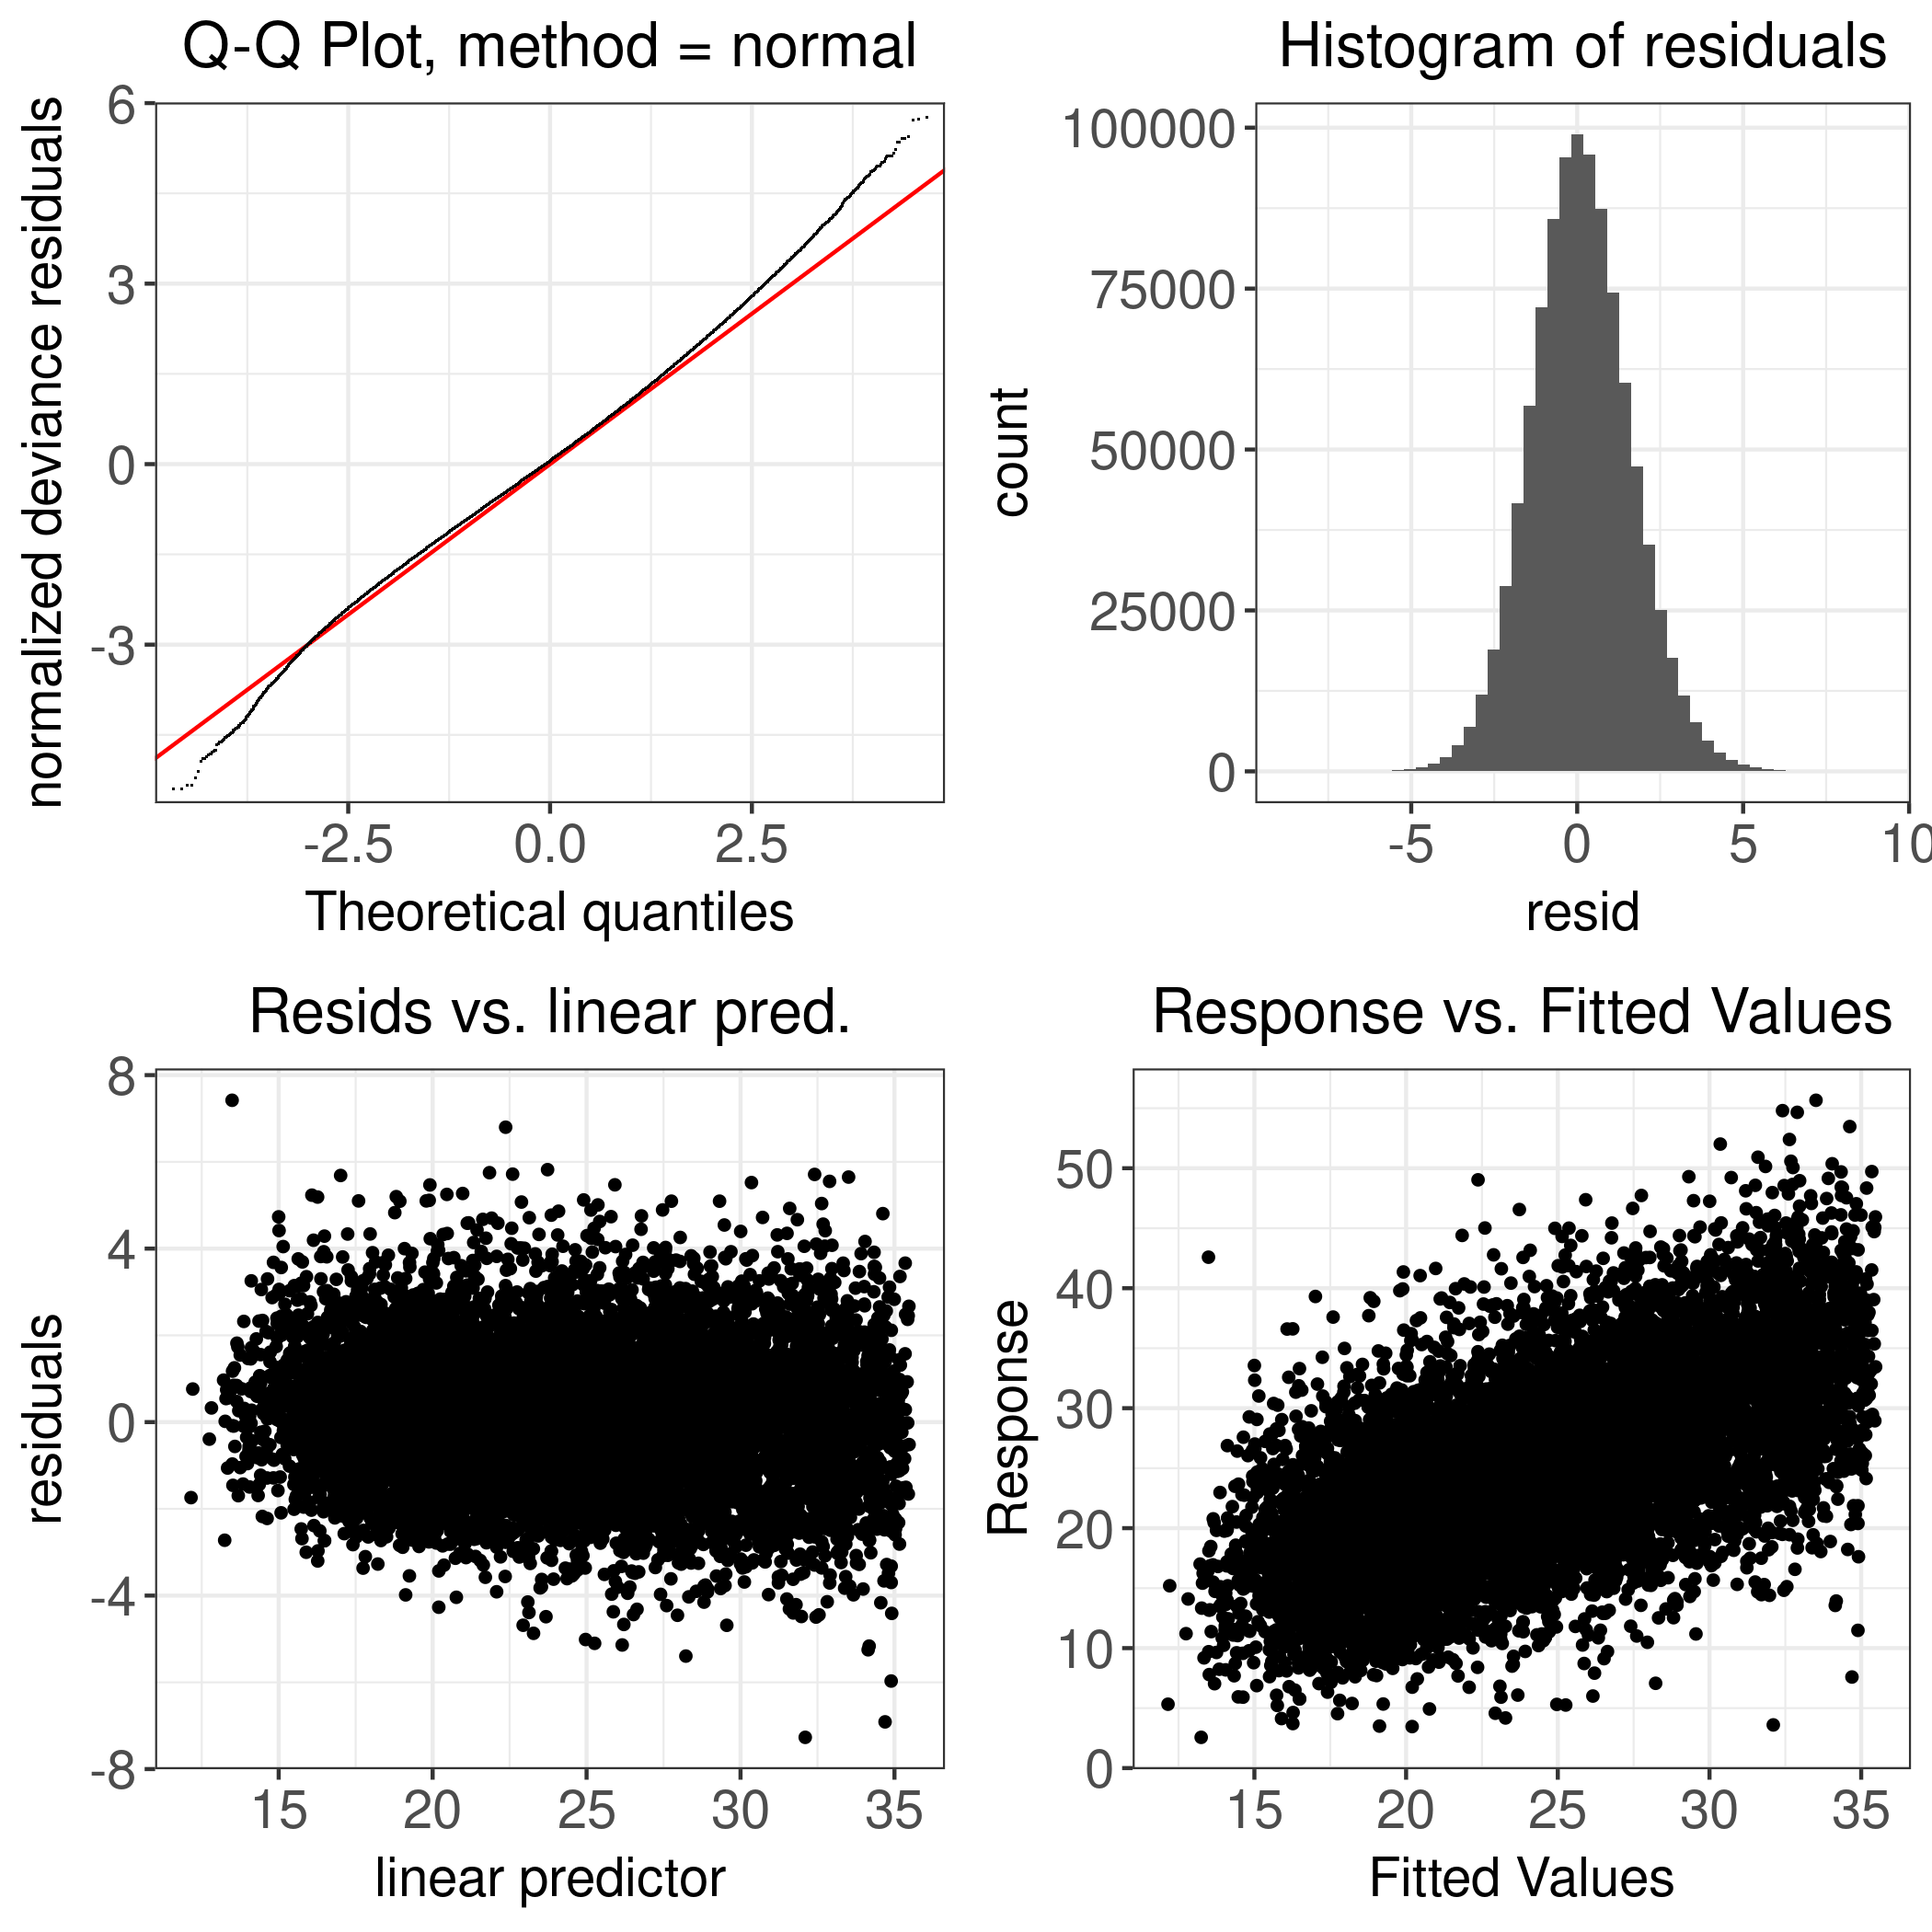
Model Diagnostics
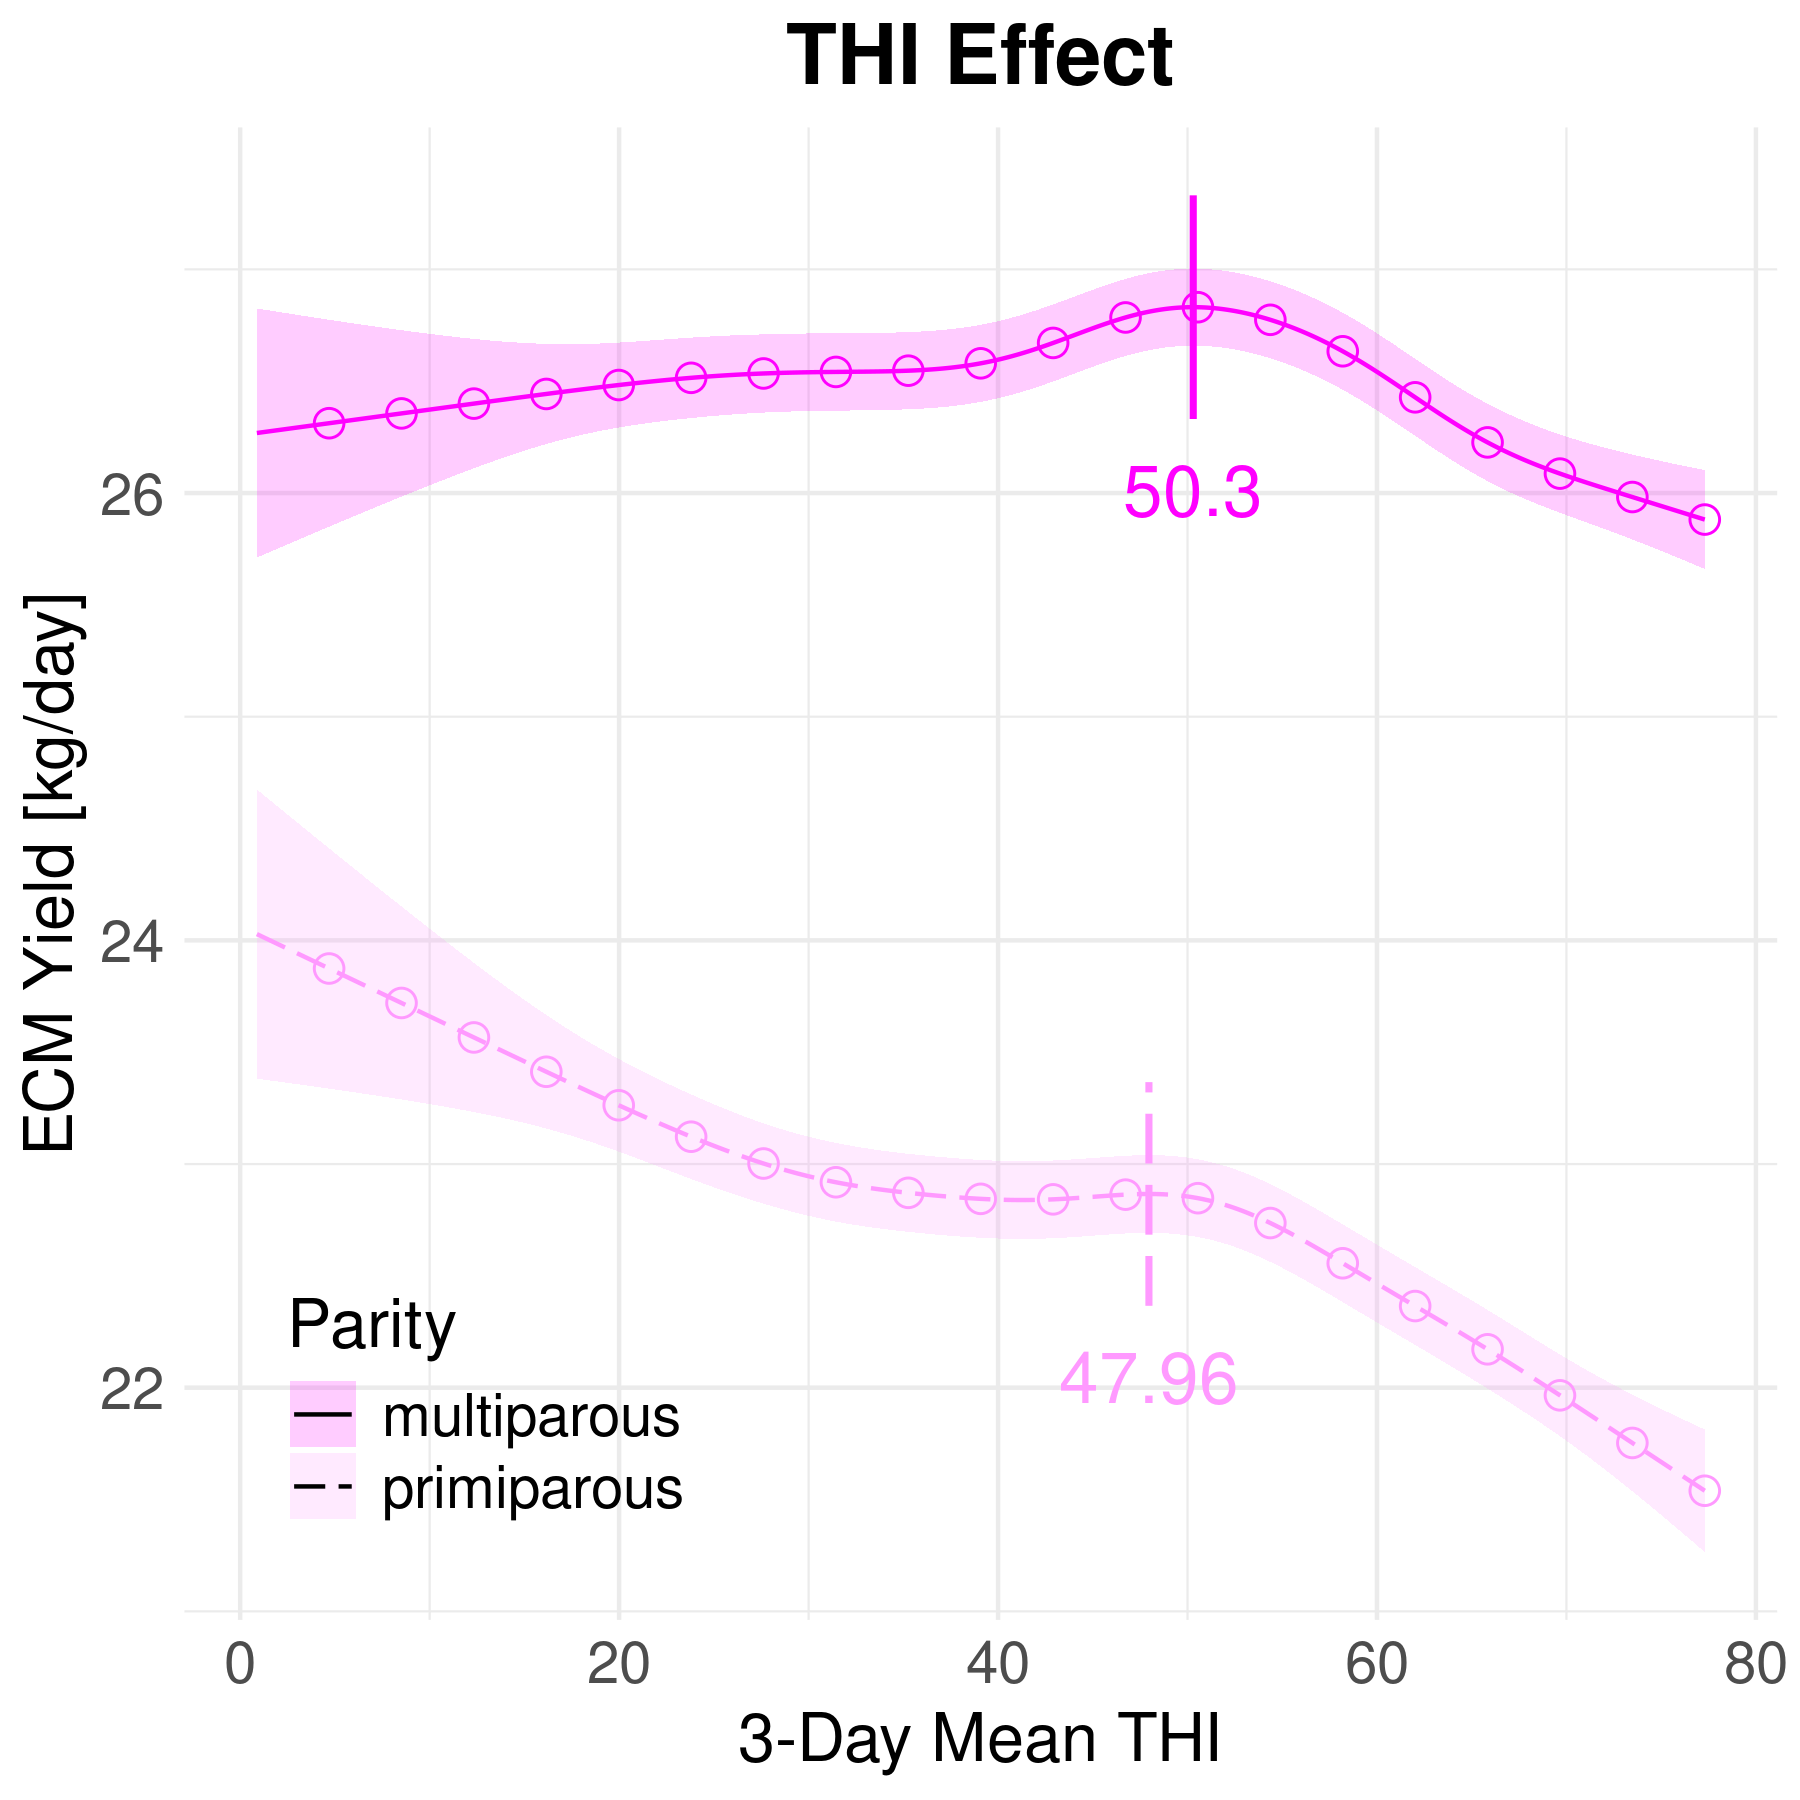
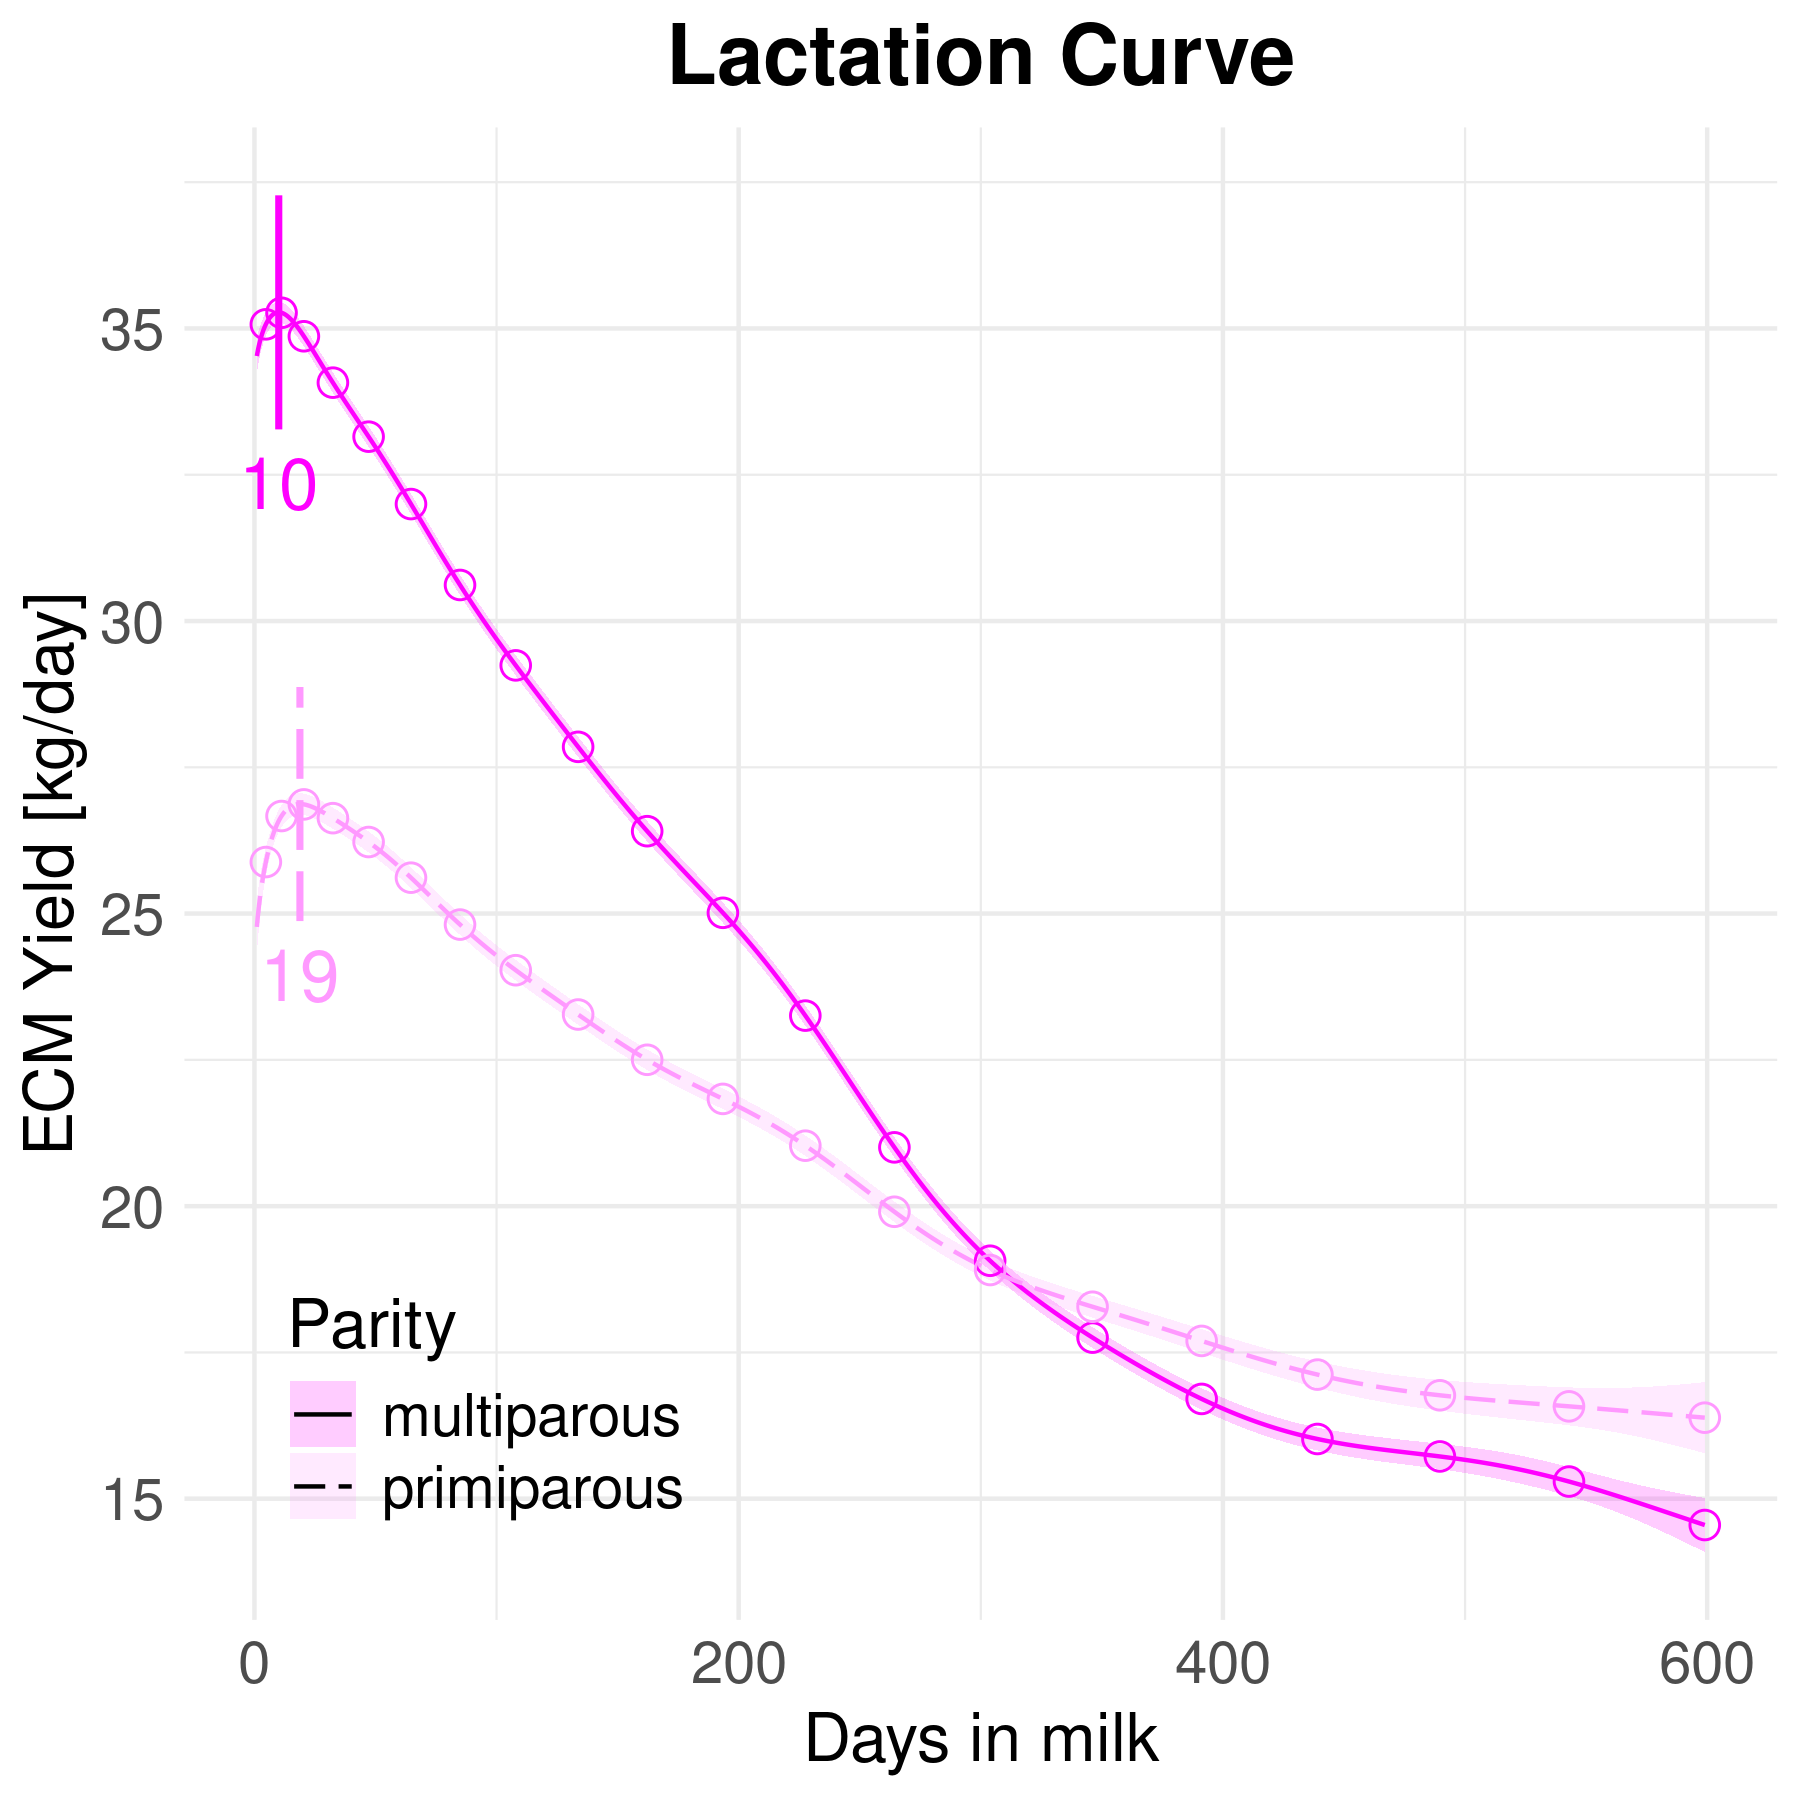
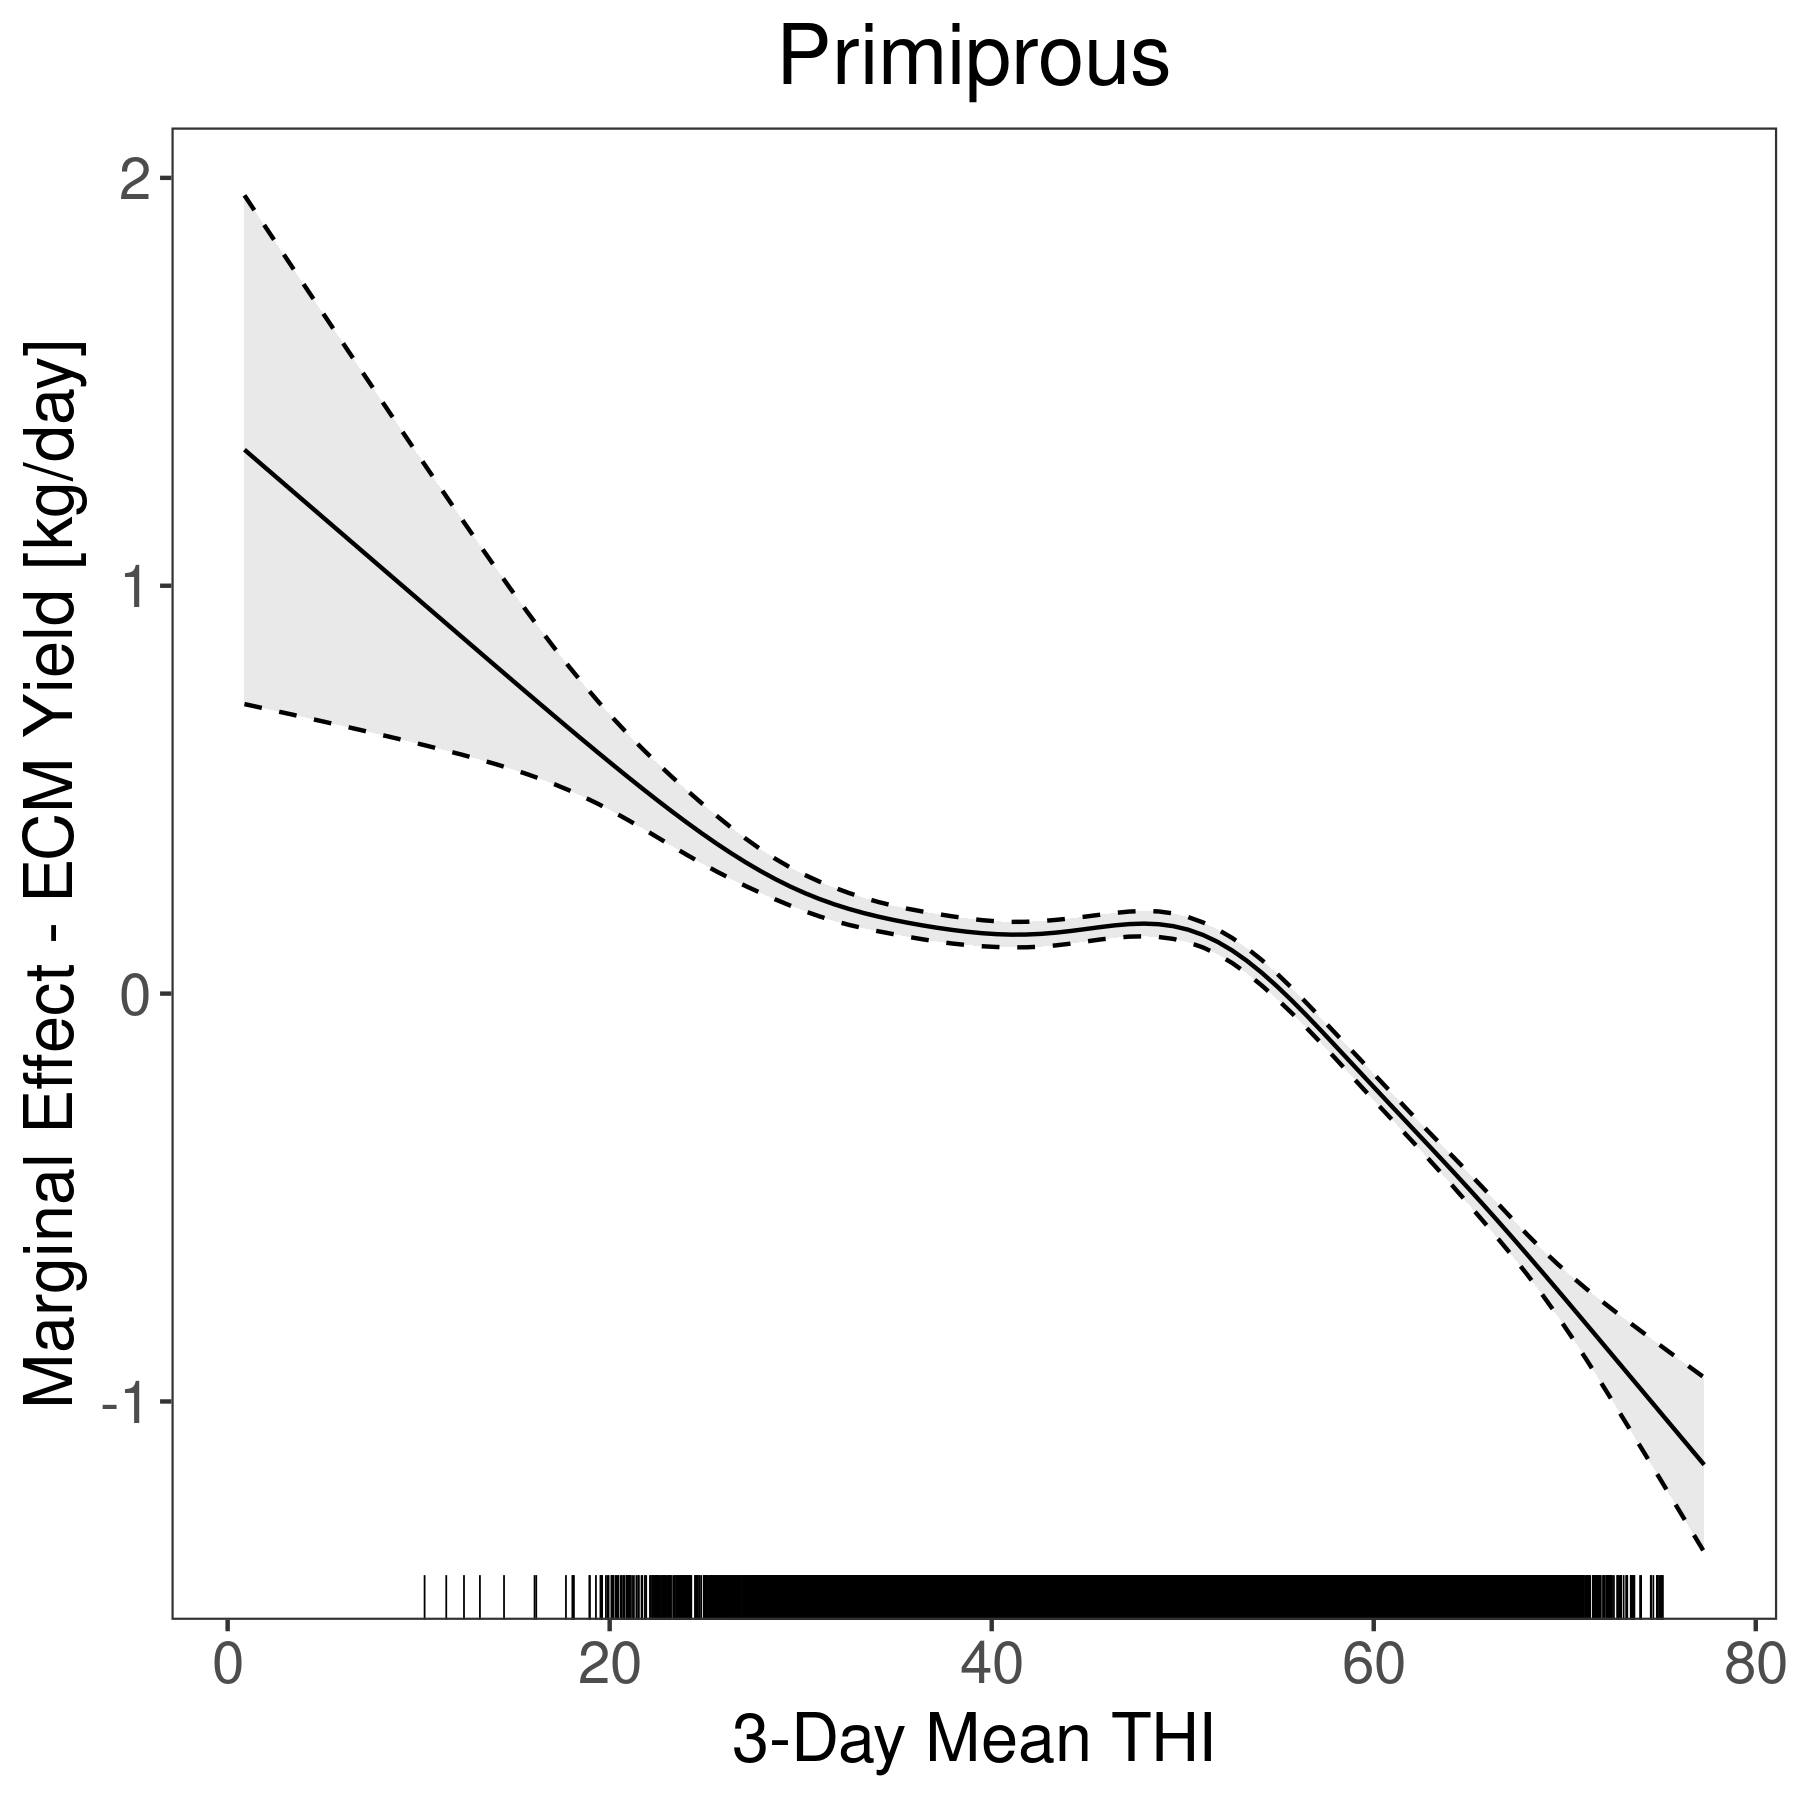
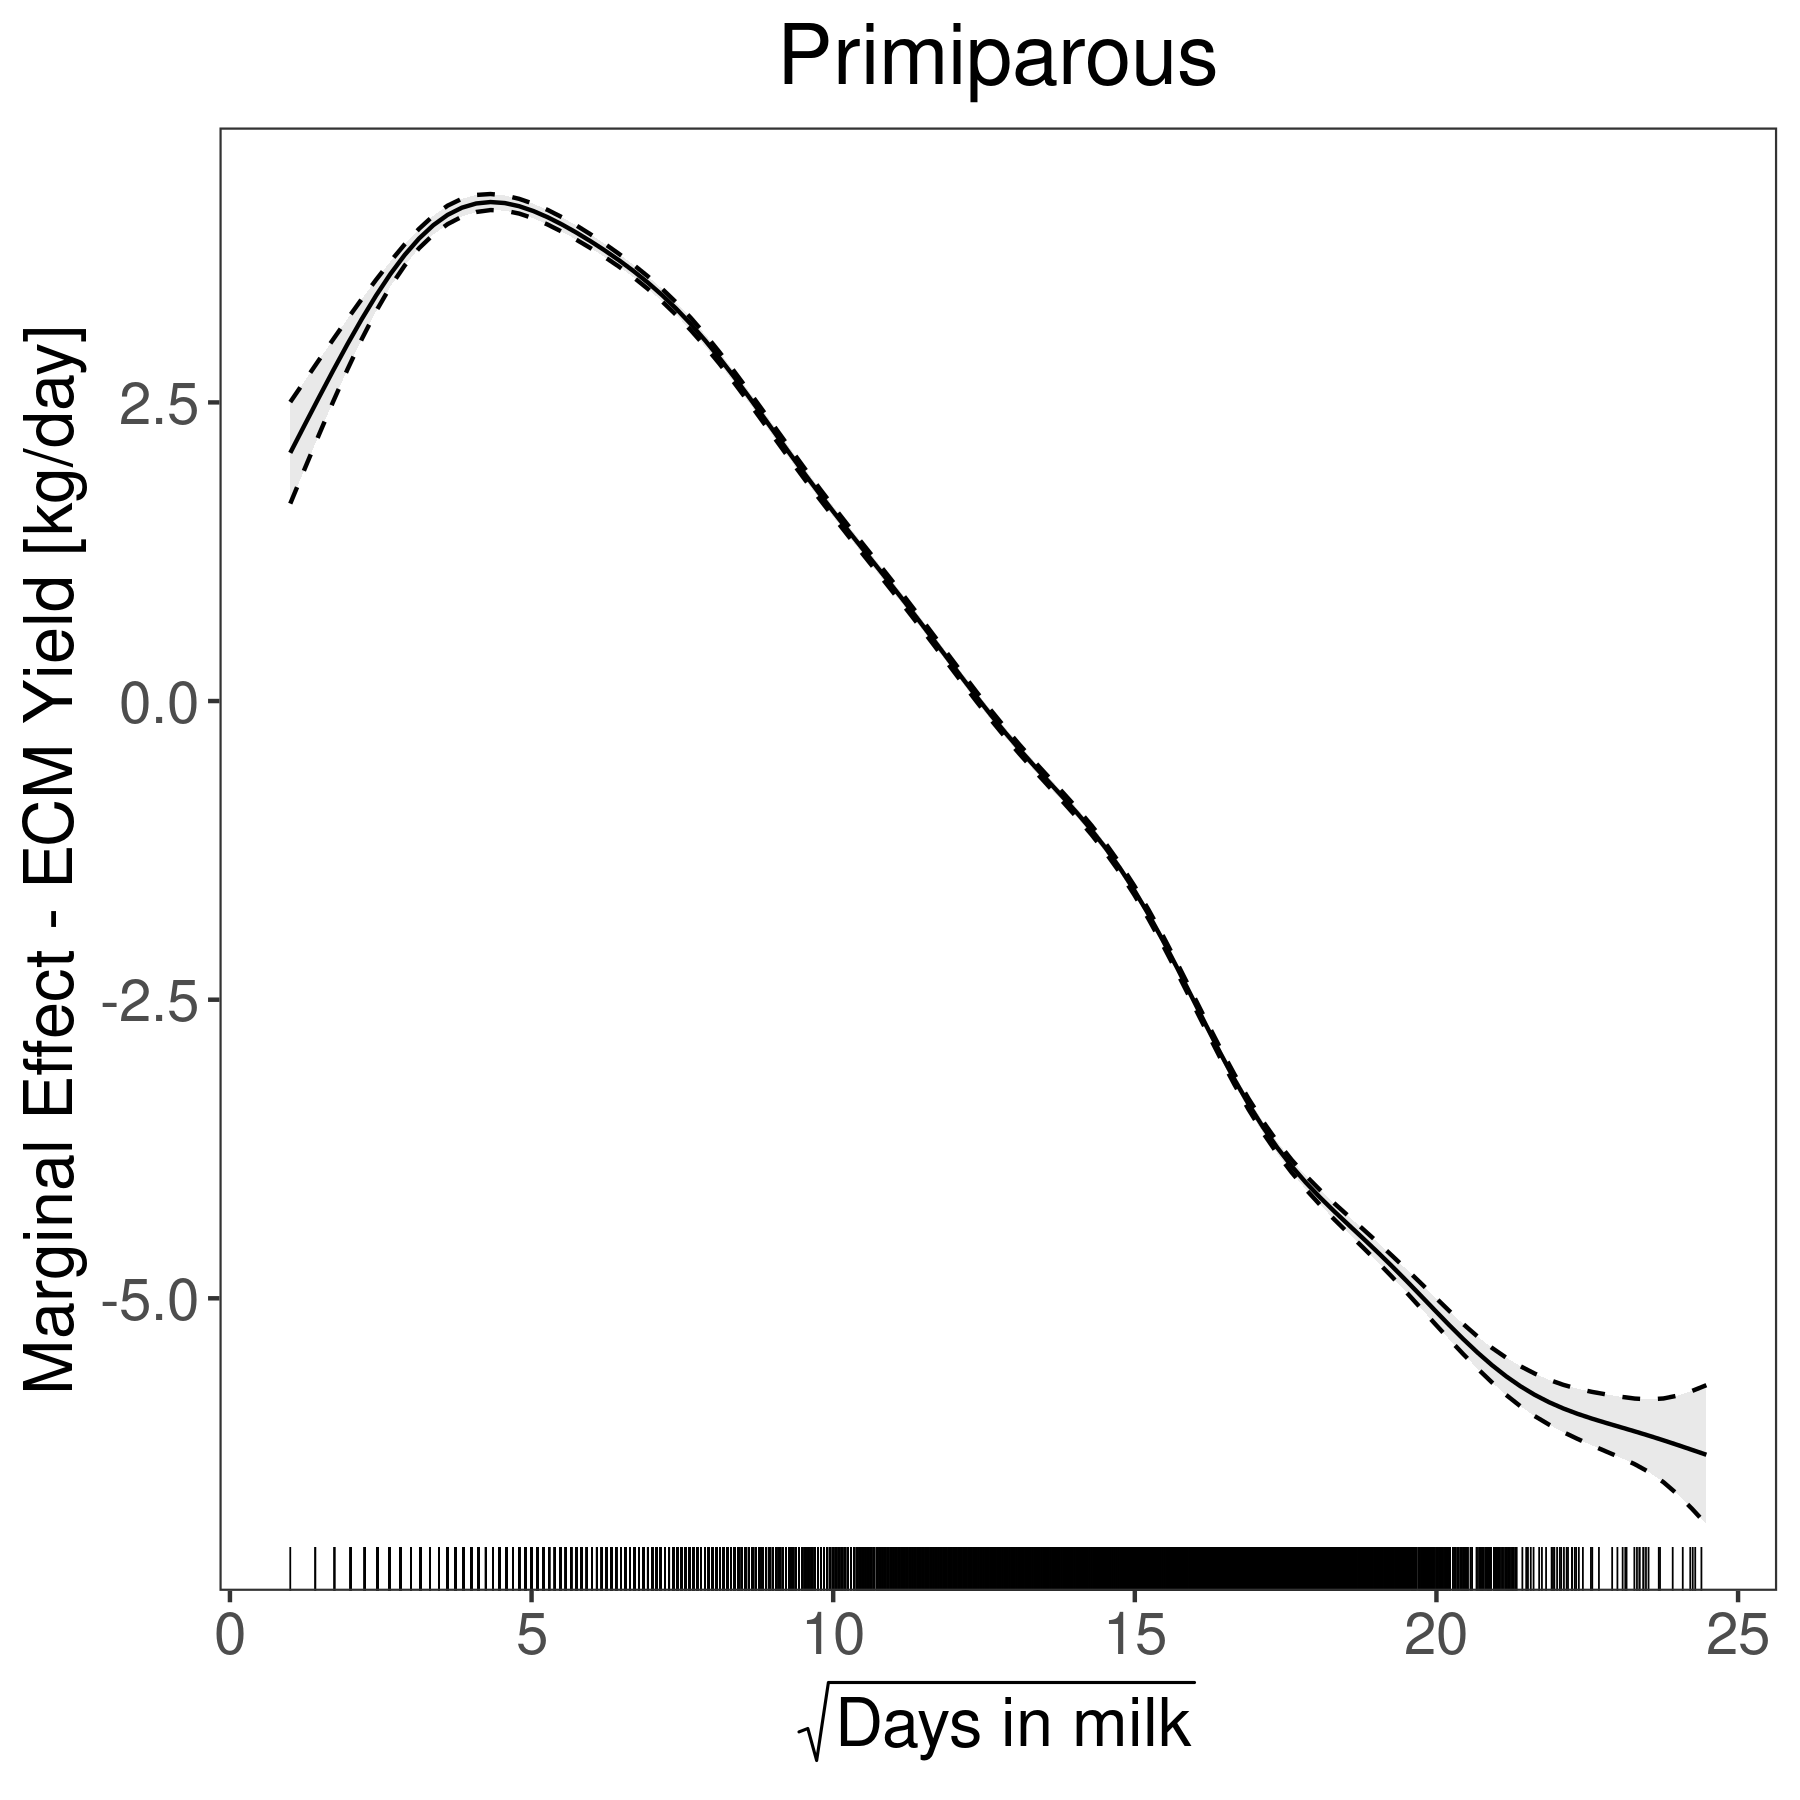
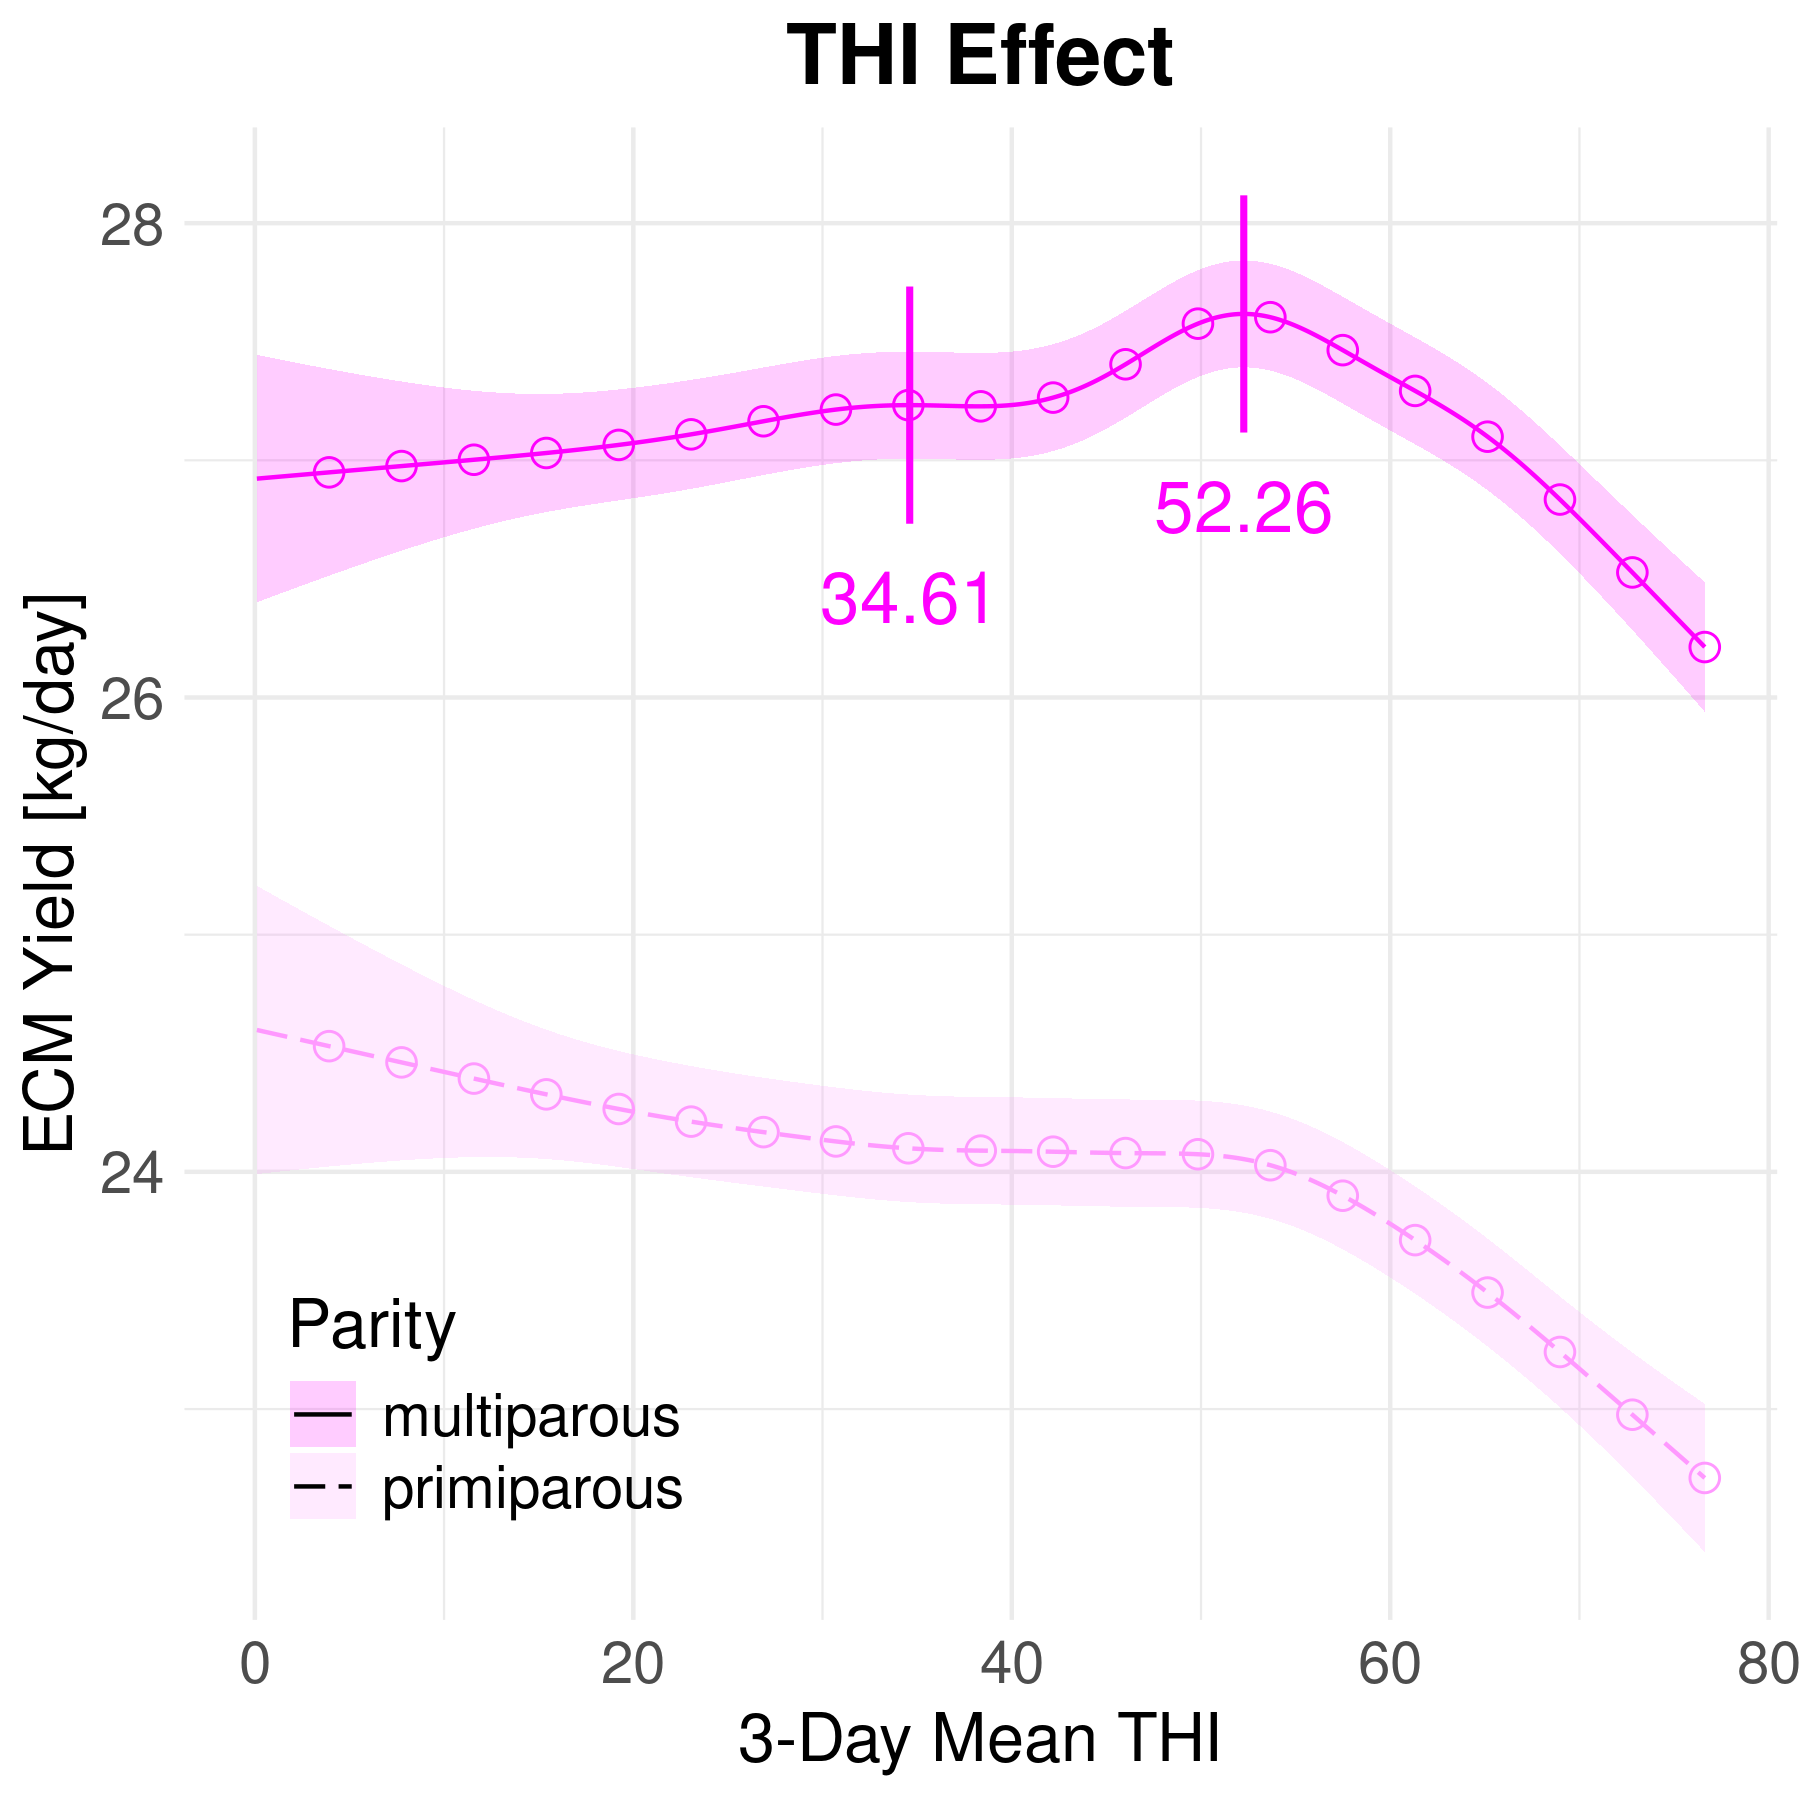
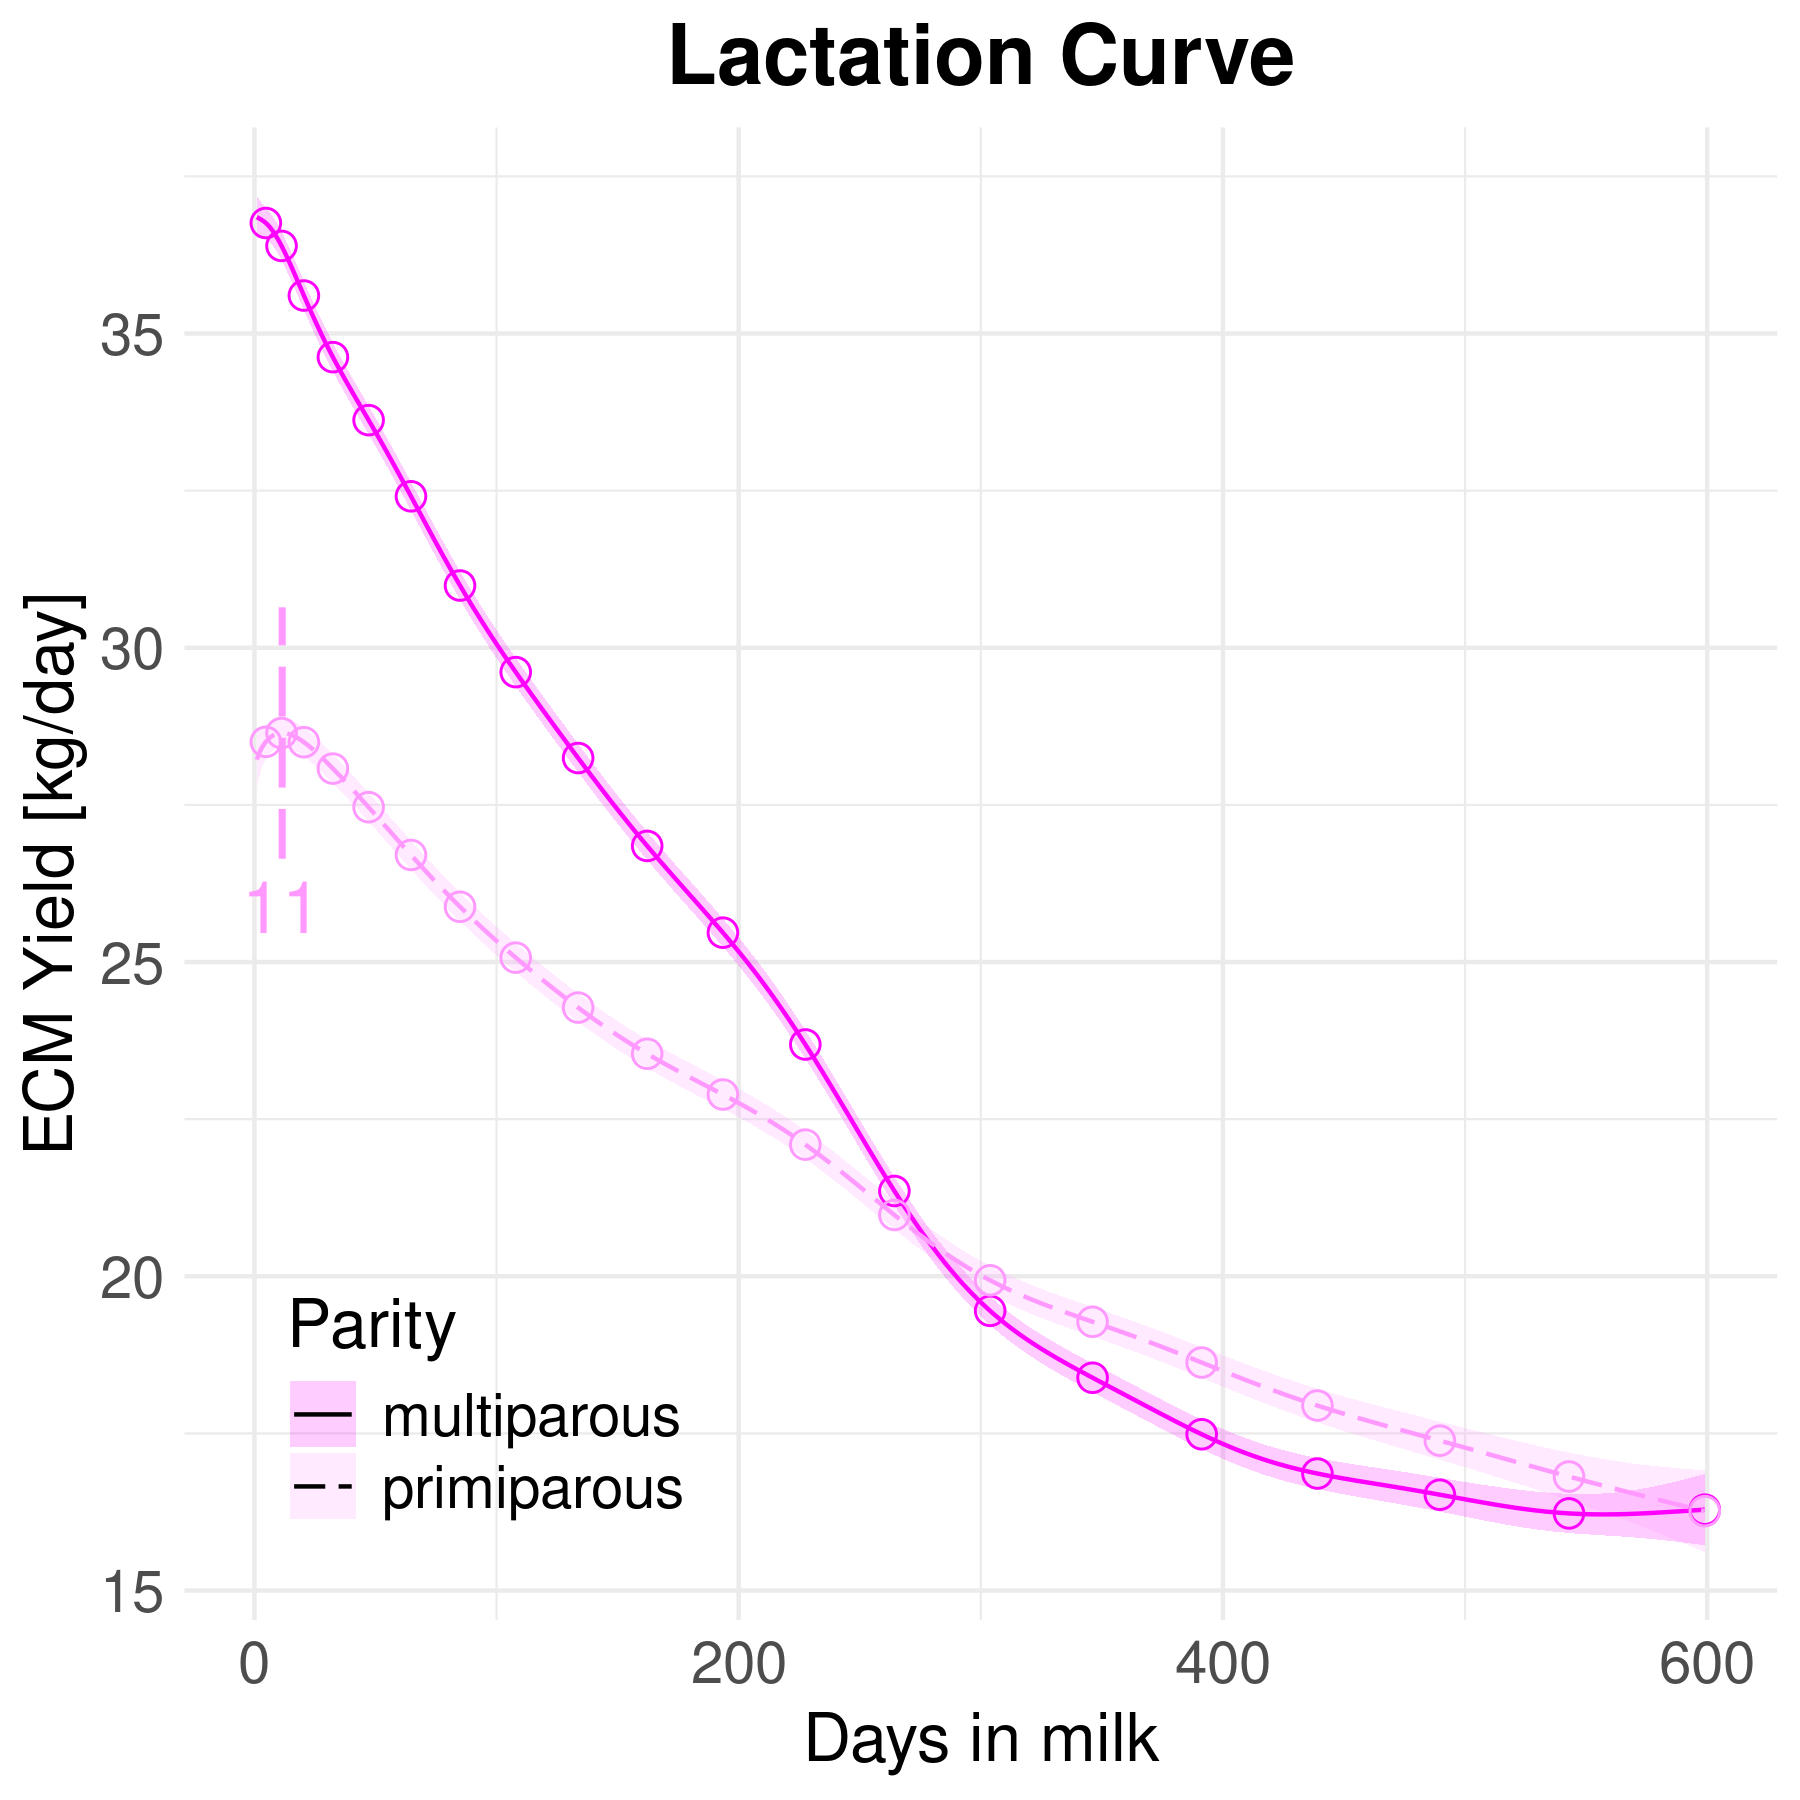
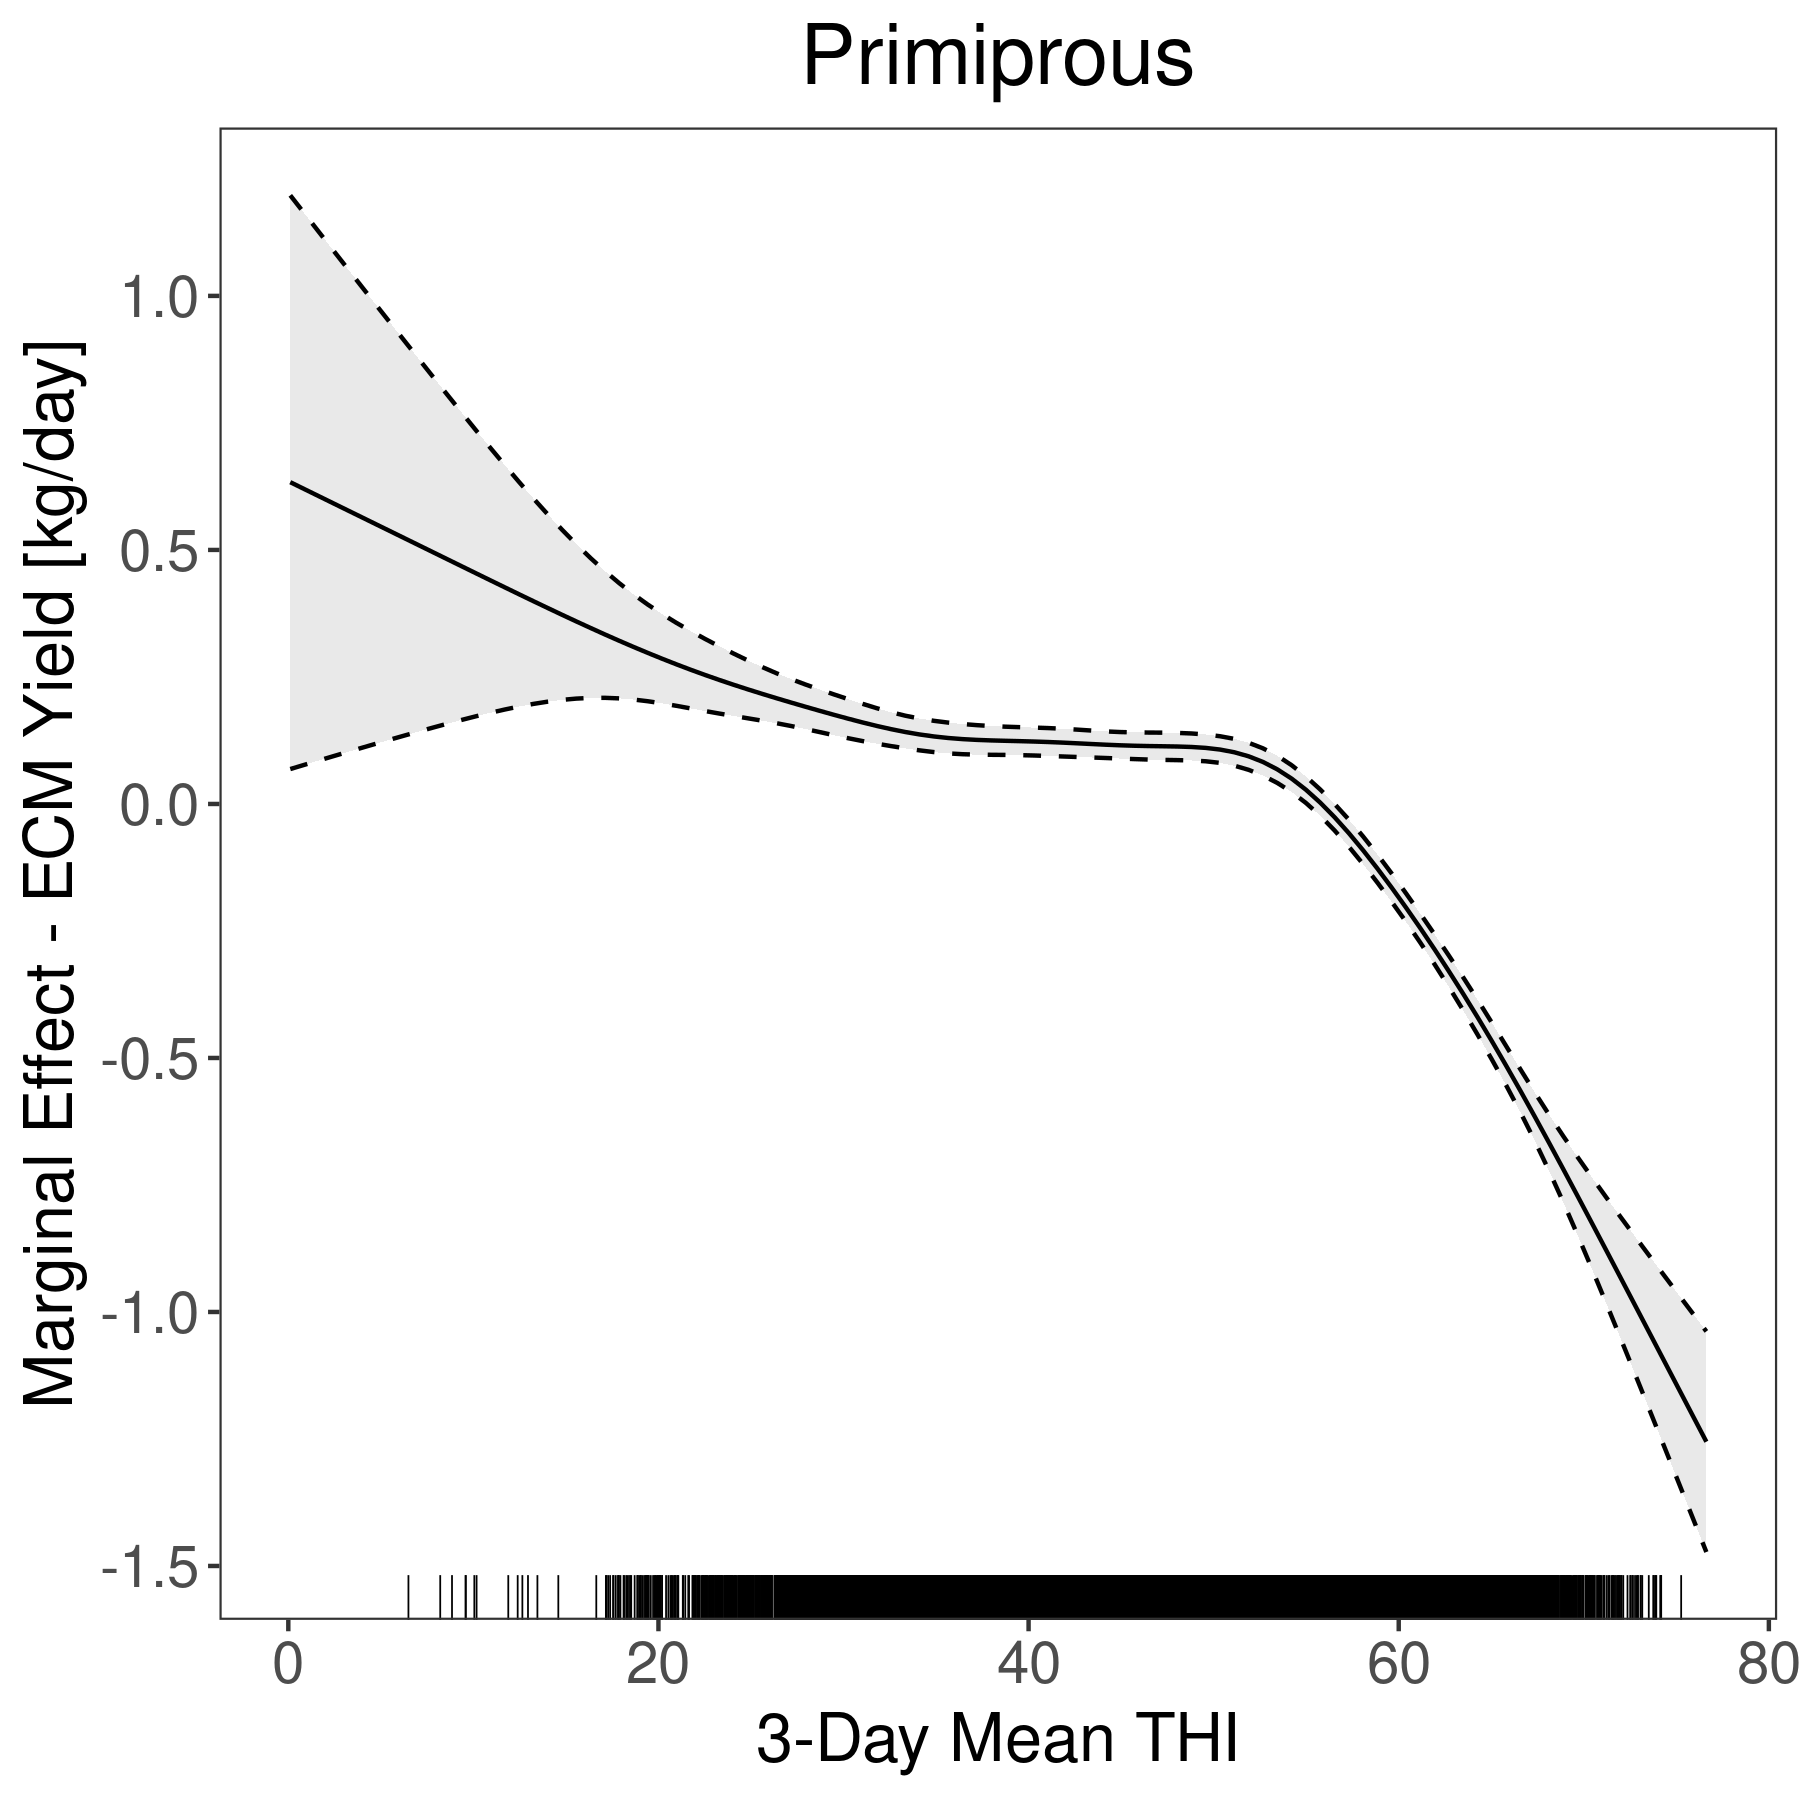
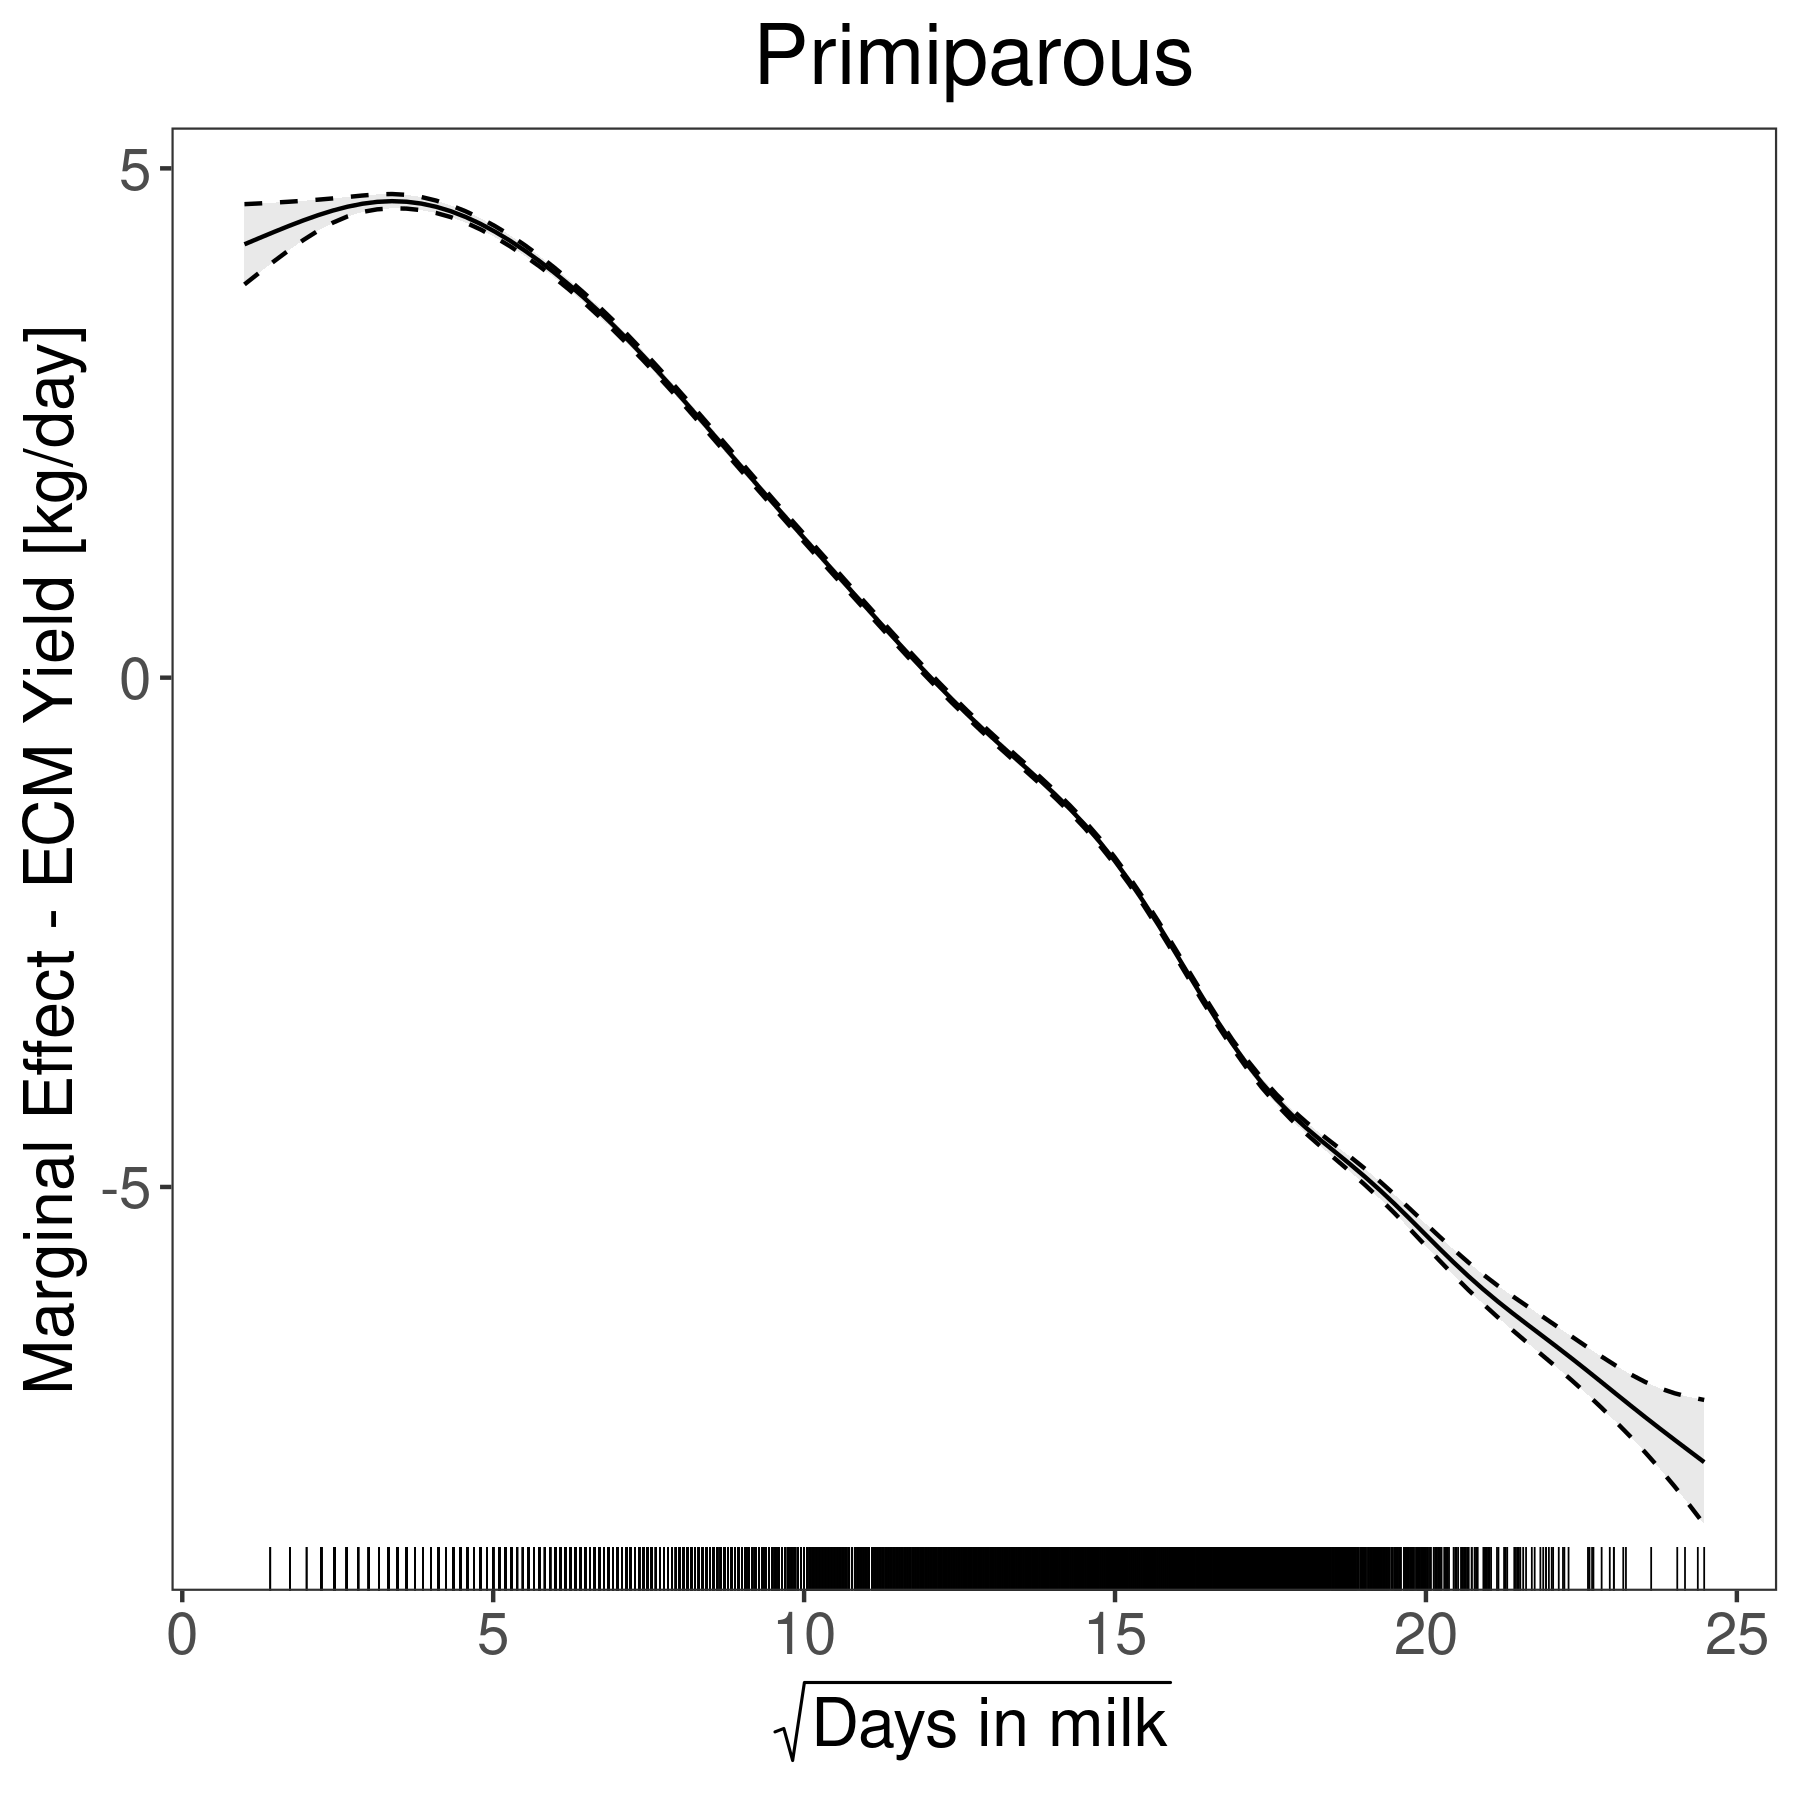
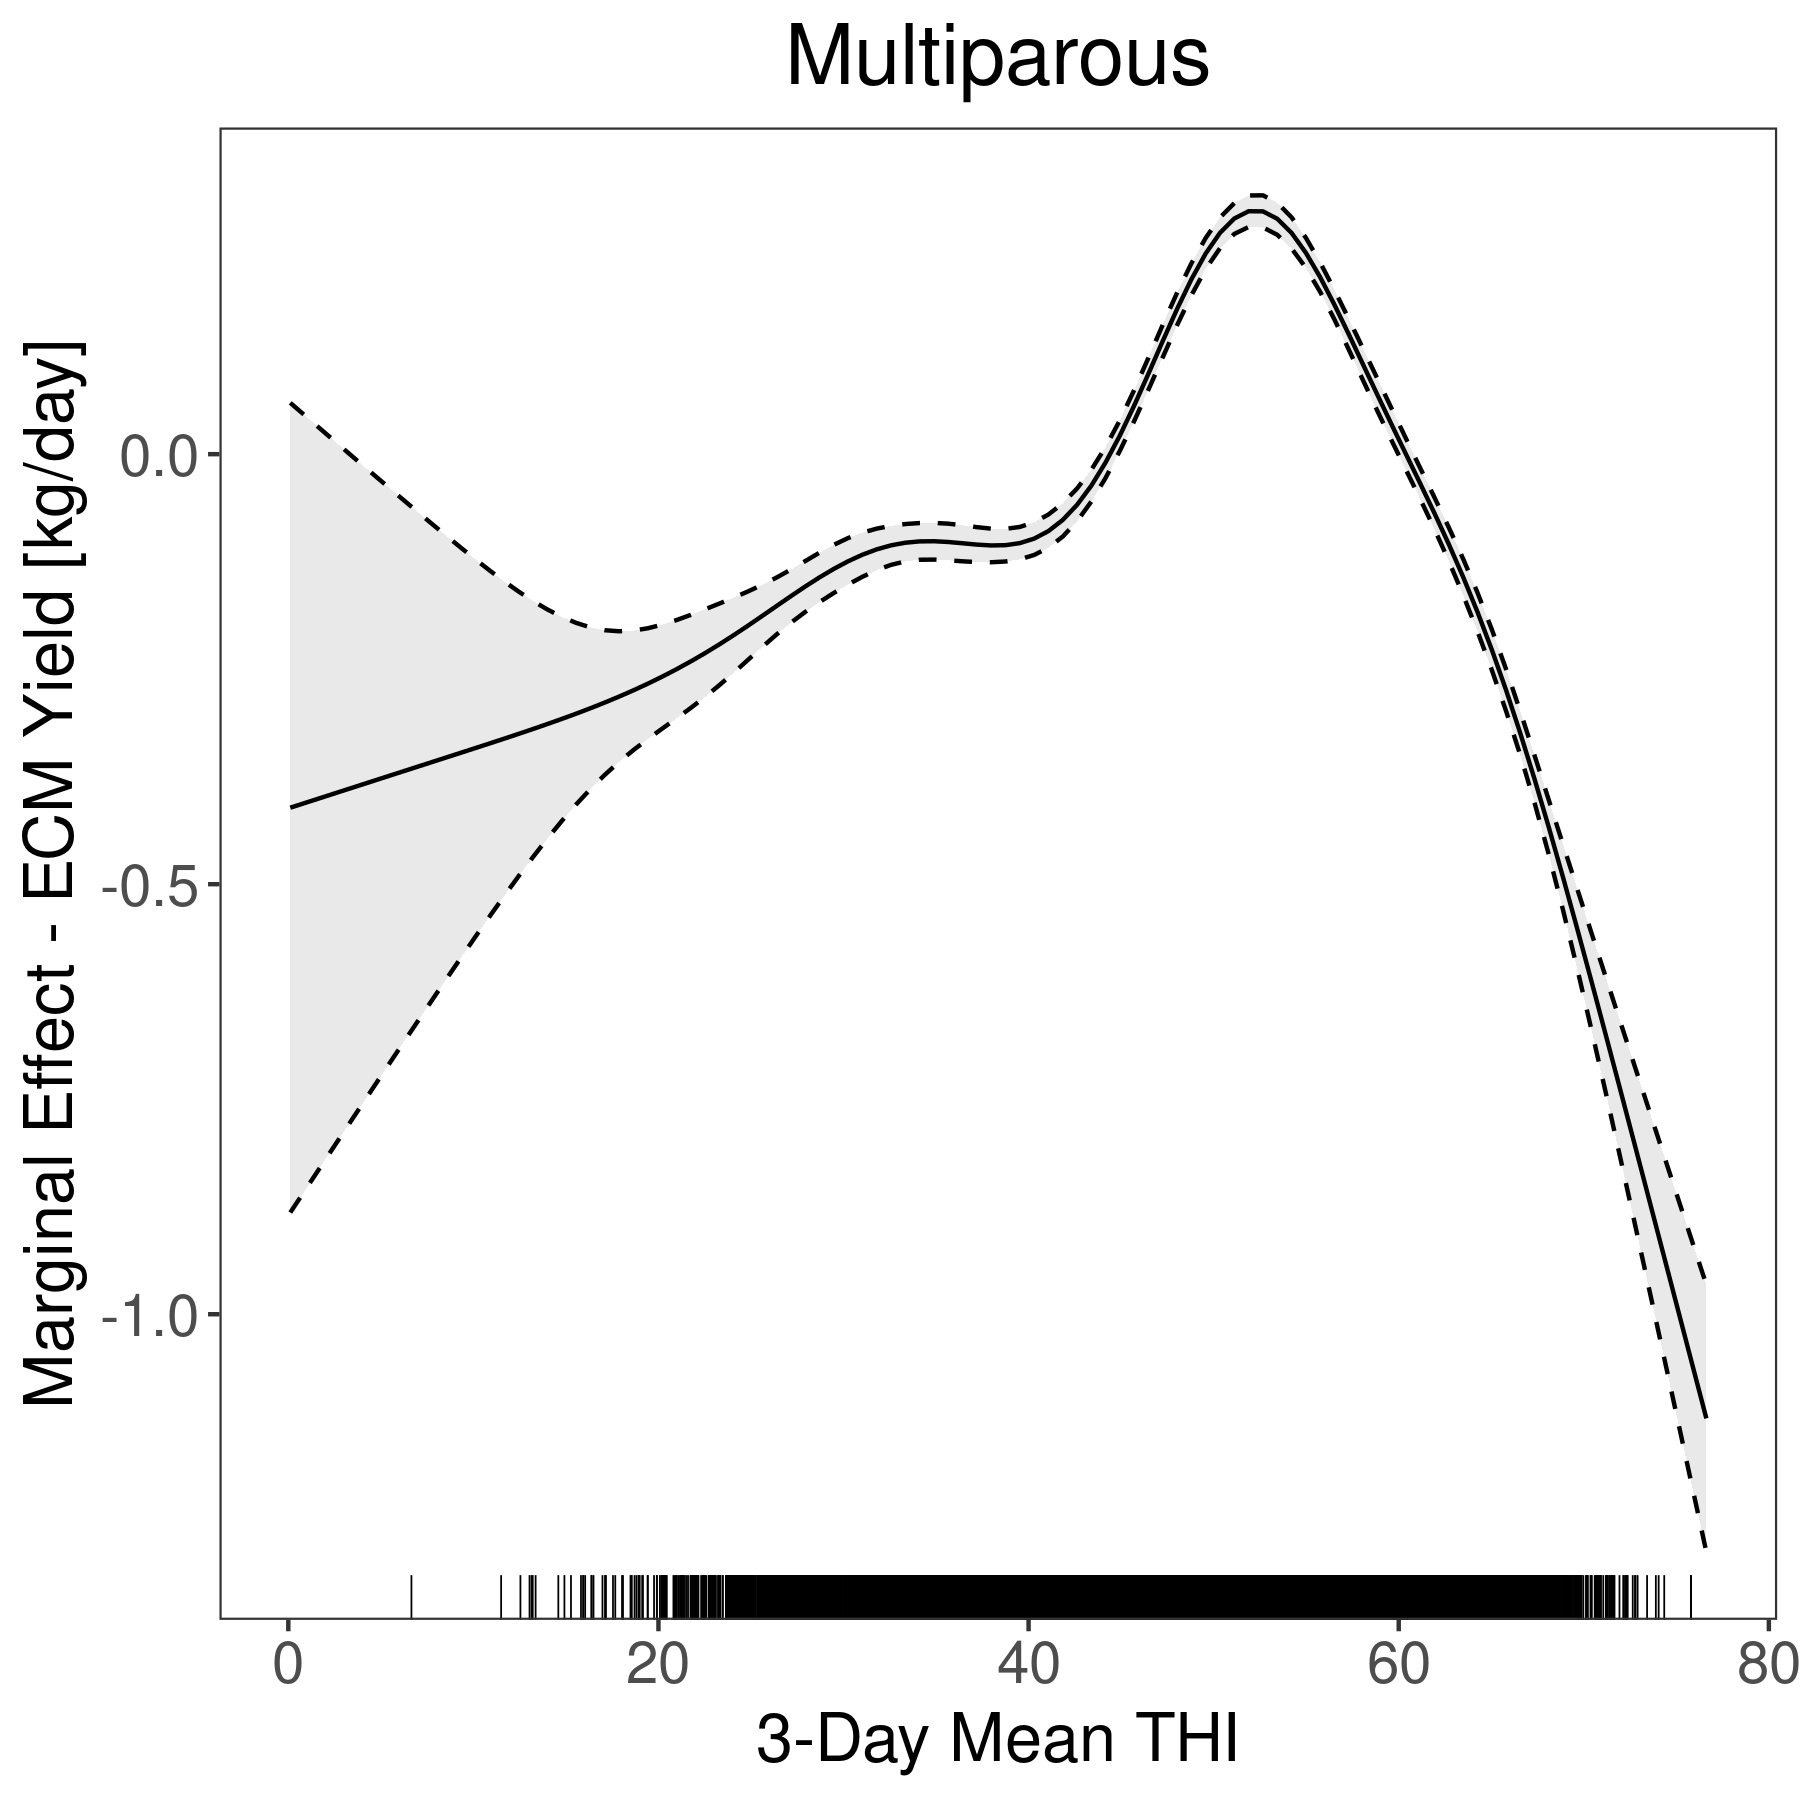
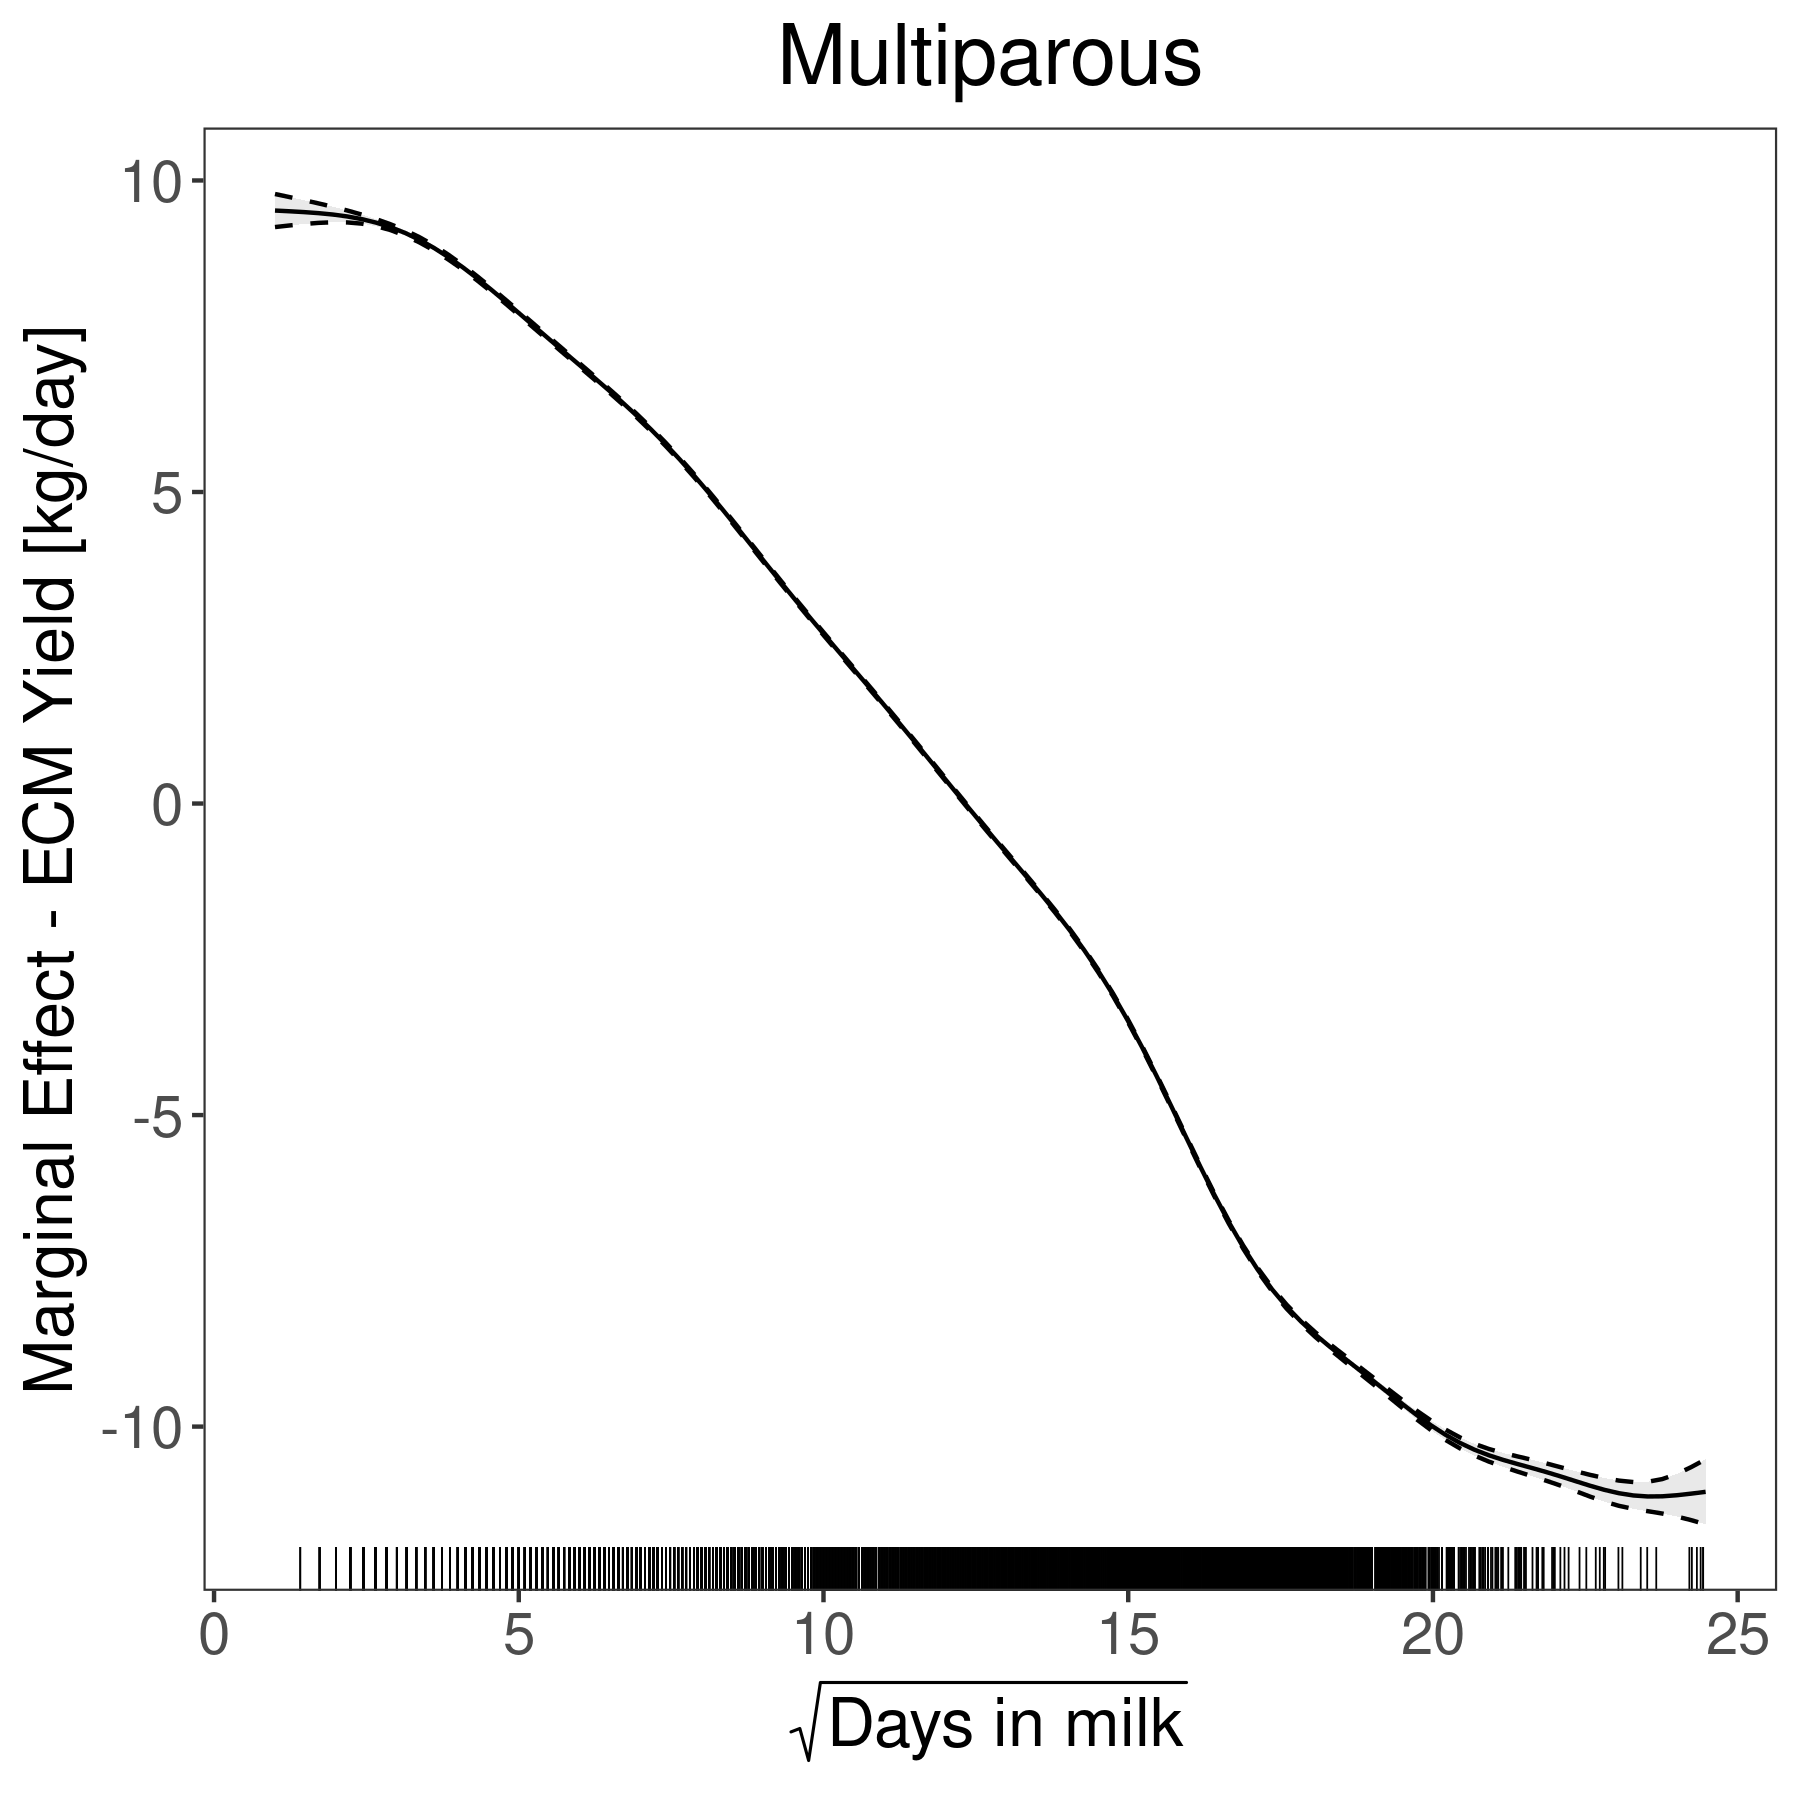
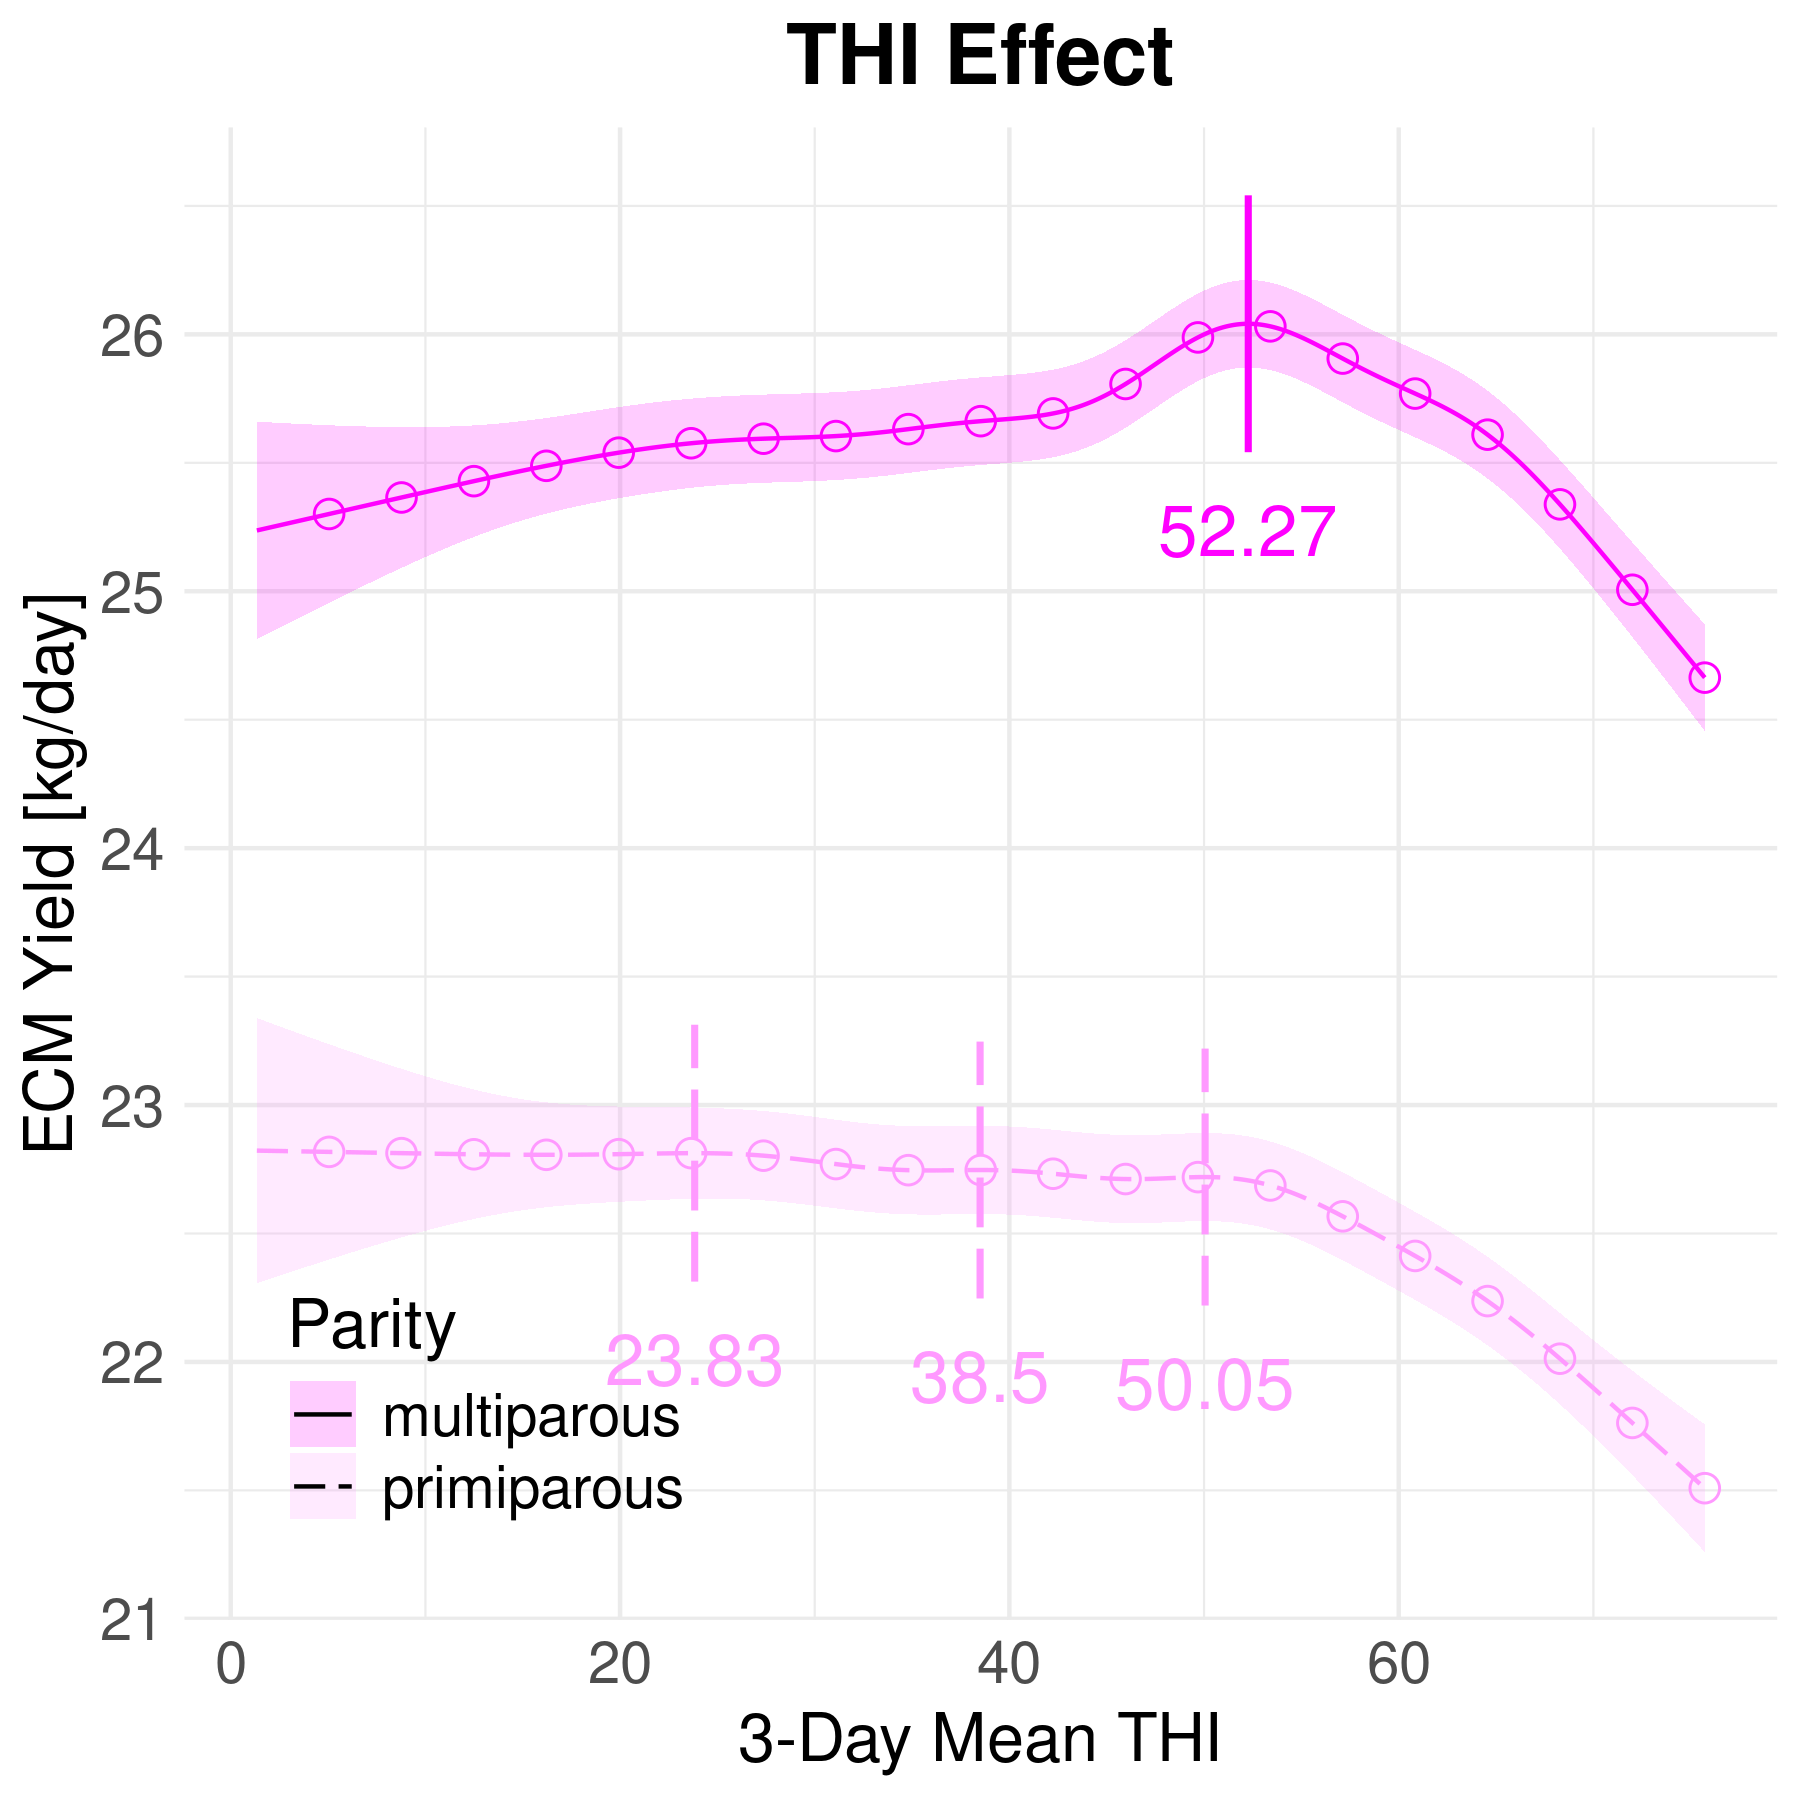
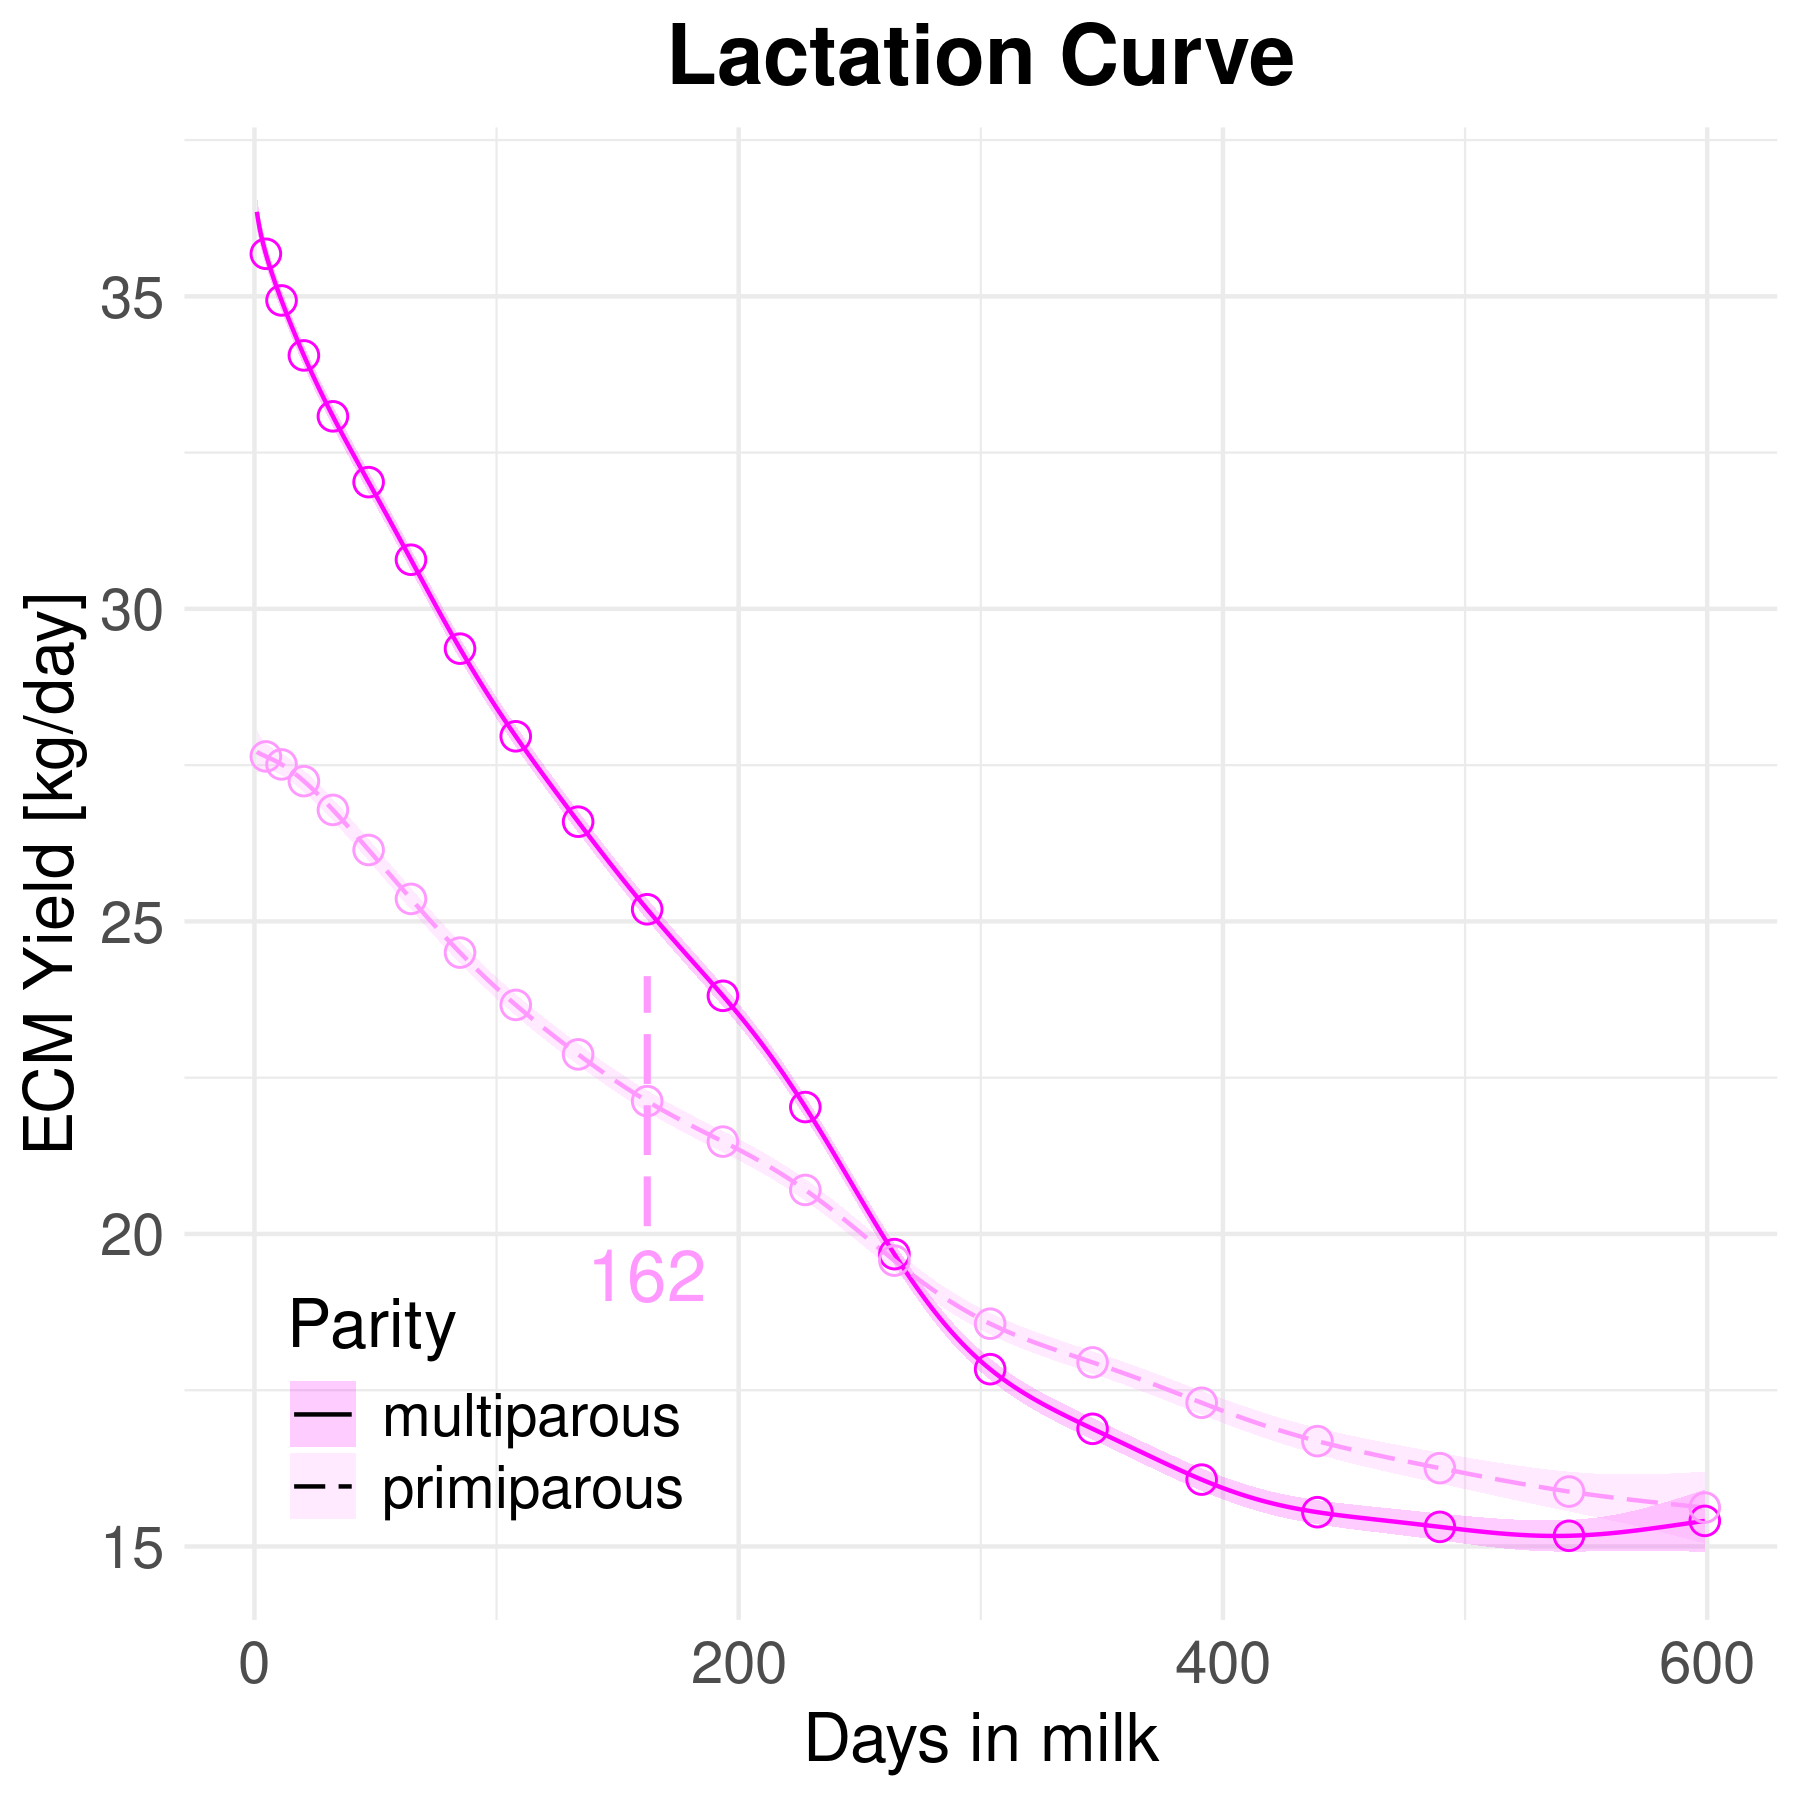
THI Effect and Lactation Curve
D.4.2: Split Period: Until 2010 - After 2010
D.4.2.1: Split Period: 1984 - 2010
Model Summary
| A. parametric coefficients | Estimate | Std. Error | t-value | p-value |
|---|---|---|---|---|
| (Intercept) | 18.6574 | 0.3504 | 53.2489 | \(< 0.0001\) |
| parityprimiparous | -3.1387 | 0.0130 | -242.3247 | \(< 0.0001\) |
| year1985 | 0.5924 | 0.1977 | 2.9963 | 0.0027 |
| year1986 | 0.5314 | 0.2944 | 1.8051 | 0.0711 |
| year1987 | 0.2646 | 0.3287 | 0.8049 | 0.4209 |
| year1988 | -0.0889 | 0.3543 | -0.2510 | 0.8018 |
| year1989 | 0.7936 | 0.3810 | 2.0827 | 0.0373 |
| year1990 | 1.2909 | 0.3896 | 3.3139 | 0.0009 |
| year1991 | 1.5349 | 0.3928 | 3.9080 | \(< 0.0001\) |
| year1992 | 1.8697 | 0.3991 | 4.6853 | \(< 0.0001\) |
| year1993 | 1.7970 | 0.3757 | 4.7832 | \(< 0.0001\) |
| year1994 | 1.6346 | 0.3831 | 4.2672 | \(< 0.0001\) |
| year1995 | 1.9864 | 0.3616 | 5.4932 | \(< 0.0001\) |
| year1996 | 2.2906 | 0.3599 | 6.3642 | \(< 0.0001\) |
| year1997 | 2.8227 | 0.3546 | 7.9605 | \(< 0.0001\) |
| year1998 | 3.7164 | 0.4462 | 8.3282 | \(< 0.0001\) |
| year1999 | 3.7134 | 0.4226 | 8.7877 | \(< 0.0001\) |
| year2000 | 3.6881 | 0.4271 | 8.6353 | \(< 0.0001\) |
| year2001 | 4.0909 | 0.4333 | 9.4403 | \(< 0.0001\) |
| year2002 | 4.1925 | 0.4333 | 9.6762 | \(< 0.0001\) |
| year2003 | 4.7166 | 0.4412 | 10.6903 | \(< 0.0001\) |
| year2004 | 5.3342 | 0.4443 | 12.0070 | \(< 0.0001\) |
| year2005 | 5.8354 | 0.4797 | 12.1651 | \(< 0.0001\) |
| year2006 | 5.8436 | 0.4795 | 12.1875 | \(< 0.0001\) |
| year2007 | 5.5932 | 0.4985 | 11.2199 | \(< 0.0001\) |
| year2008 | 5.9158 | 0.5046 | 11.7229 | \(< 0.0001\) |
| year2009 | 6.4499 | 0.5281 | 12.2140 | \(< 0.0001\) |
| year2010 | 7.1064 | 0.7553 | 9.4092 | \(< 0.0001\) |
| B. smooth terms | edf | Ref.df | F-value | p-value |
|---|---|---|---|---|
| s(thi_mean_t0_3d):paritymultiparous | 8.6994 | 8.6994 | 314.1151 | \(< 0.0001\) |
| s(thi_mean_t0_3d):parityprimiparous | 7.1424 | 7.1424 | 143.5337 | \(< 0.0001\) |
| s(days_in_milk_t):paritymultiparous | 13.5087 | 13.5087 | 161236.6570 | \(< 0.0001\) |
| s(days_in_milk_t):parityprimiparous | 12.1975 | 12.1975 | 14112.6321 | \(< 0.0001\) |
| Smooth Term Fixed Effect | Est. | SE | z | p |
|---|---|---|---|---|
| s(thi_mean_t0_3d):multiFx1 | 0.4342 | 0.0866 | 5.01 | \(< 1e-06\) |
| s(thi_mean_t0_3d):primiFx1 | 0.4046 | 0.1067 | 3.79 | 0.0002 |
| s(days_in_milk_):multiFx1 | -0.5972 | 0.4296 | -1.39 | 0.1645 |
| s(days_in_milk_):primiFx1 | -0.5188 | 0.4339 | -1.20 | 0.2319 |
| Variance Component | Estimated \( \sigma \) | |||
|---|---|---|---|---|
| \( \sigma_\alpha \) | 2.6516 | |||
| \( \sigma_\iota \) | 0.9288 | |||
| \( \sigma_\phi \) | 2.9589 | |||
| s(thi_mean_t0_3d):multi | 2.5013 | |||
| s(days_in_milk_):primi | 3.8774 | |||
| s(days_in_milk_):multi | 7.1478 | |||
| s(thi_mean_t0_3d):primi | 1.2666 | |||
| Residual | 3.2839 |
Model Diagnostics
THI Effect and Lactation Curve
D.4.2.2: Split Period: 2010 - 2023
Model Summary
| A. parametric coefficients | Estimate | Std. Error | t-value | p-value |
|---|---|---|---|---|
| (Intercept) | 23.9154 | 0.2931 | 81.5860 | \(< 0.0001\) |
| parityprimiparous | -3.9004 | 0.0167 | -232.8837 | \(< 0.0001\) |
| year2012 | -0.0690 | 0.3447 | -0.2002 | 0.8413 |
| year2013 | -0.3623 | 0.3299 | -1.0981 | 0.2722 |
| year2014 | 0.1886 | 0.3276 | 0.5756 | 0.5649 |
| year2015 | 0.5104 | 0.3329 | 1.5333 | 0.1252 |
| year2016 | 0.9654 | 0.3357 | 2.8755 | 0.0040 |
| year2017 | 1.2575 | 0.3307 | 3.8024 | \(< 0.0001\) |
| year2018 | 1.7924 | 0.3342 | 5.3623 | \(< 0.0001\) |
| year2019 | 1.9137 | 0.3315 | 5.7726 | \(< 0.0001\) |
| year2020 | 2.3420 | 0.3412 | 6.8648 | \(< 0.0001\) |
| year2021 | 2.6223 | 0.3210 | 8.1692 | \(< 0.0001\) |
| year2022 | 2.3548 | 0.3389 | 6.9490 | \(< 0.0001\) |
| year2023 | 2.6795 | 0.3323 | 8.0634 | \(< 0.0001\) |
| B. smooth terms | edf | Ref.df | F-value | p-value |
|---|---|---|---|---|
| s(thi_mean_t0_3d):paritymultiparous | 7.9356 | 7.9356 | 208.7322 | \(< 0.0001\) |
| s(thi_mean_t0_3d):parityprimiparous | 6.5668 | 6.5668 | 165.3686 | \(< 0.0001\) |
| s(days_in_milk_t):paritymultiparous | 13.4184 | 13.4184 | 85993.6942 | \(< 0.0001\) |
| s(days_in_milk_t):parityprimiparous | 12.3905 | 12.3905 | 6667.4461 | \(< 0.0001\) |
| Smooth Term Fixed Effect | Est. | SE | z | p |
|---|---|---|---|---|
| s(thi_mean_t0_3d):multiFx1 | -0.0875 | 0.0974 | -0.90 | 0.3691 |
| s(thi_mean_t0_3d):primiFx1 | -0.5661 | 0.1180 | -4.80 | \(< 1e-05\) |
| s(days_in_milk_):multiFx1 | -0.3719 | 0.4377 | -0.85 | 0.3955 |
| s(days_in_milk_):primiFx1 | 1.7240 | 0.5478 | 3.15 | 0.0017 |
| Variance Component | Estimated \( \sigma \) | |||
|---|---|---|---|---|
| \( \sigma_\alpha \) | 2.7517 | |||
| \( \sigma_\iota \) | 1.1372 | |||
| \( \sigma_\phi \) | 3.7572 | |||
| s(thi_mean_t0_3d):multi | 1.7293 | |||
| s(days_in_milk_):primi | 5.4432 | |||
| s(days_in_milk_):multi | 7.1565 | |||
| s(thi_mean_t0_3d):primi | 1.4283 | |||
| Residual | 3.9215 |
Model Diagnostics
THI Effect and Lactation Curve