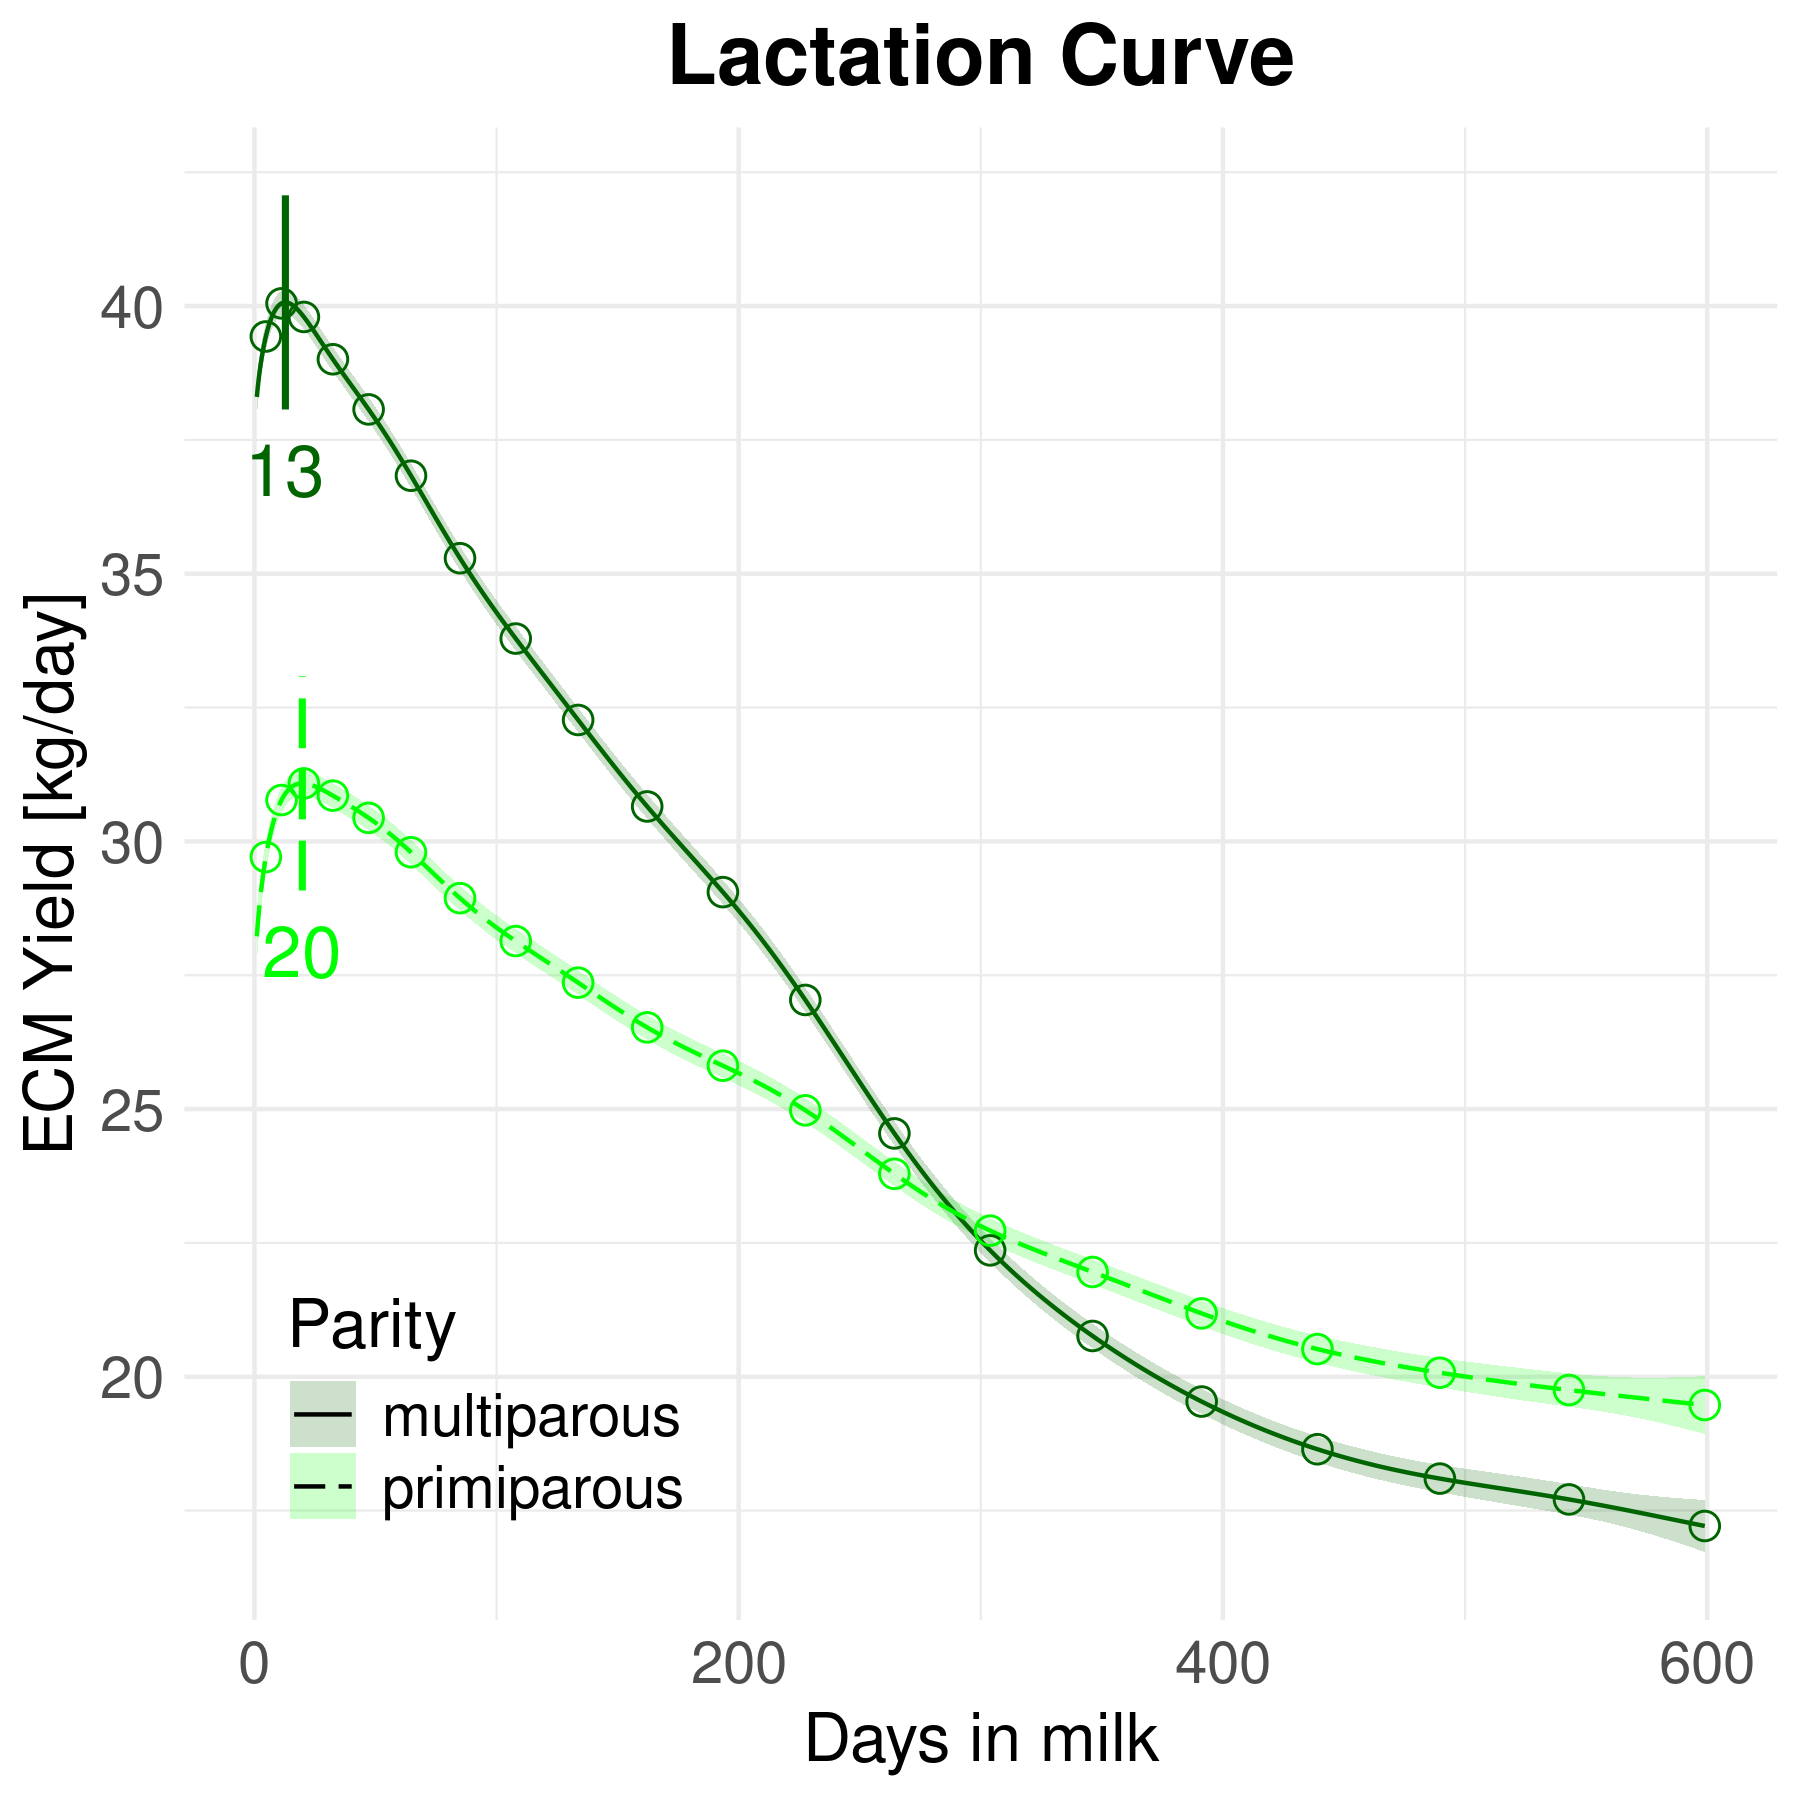
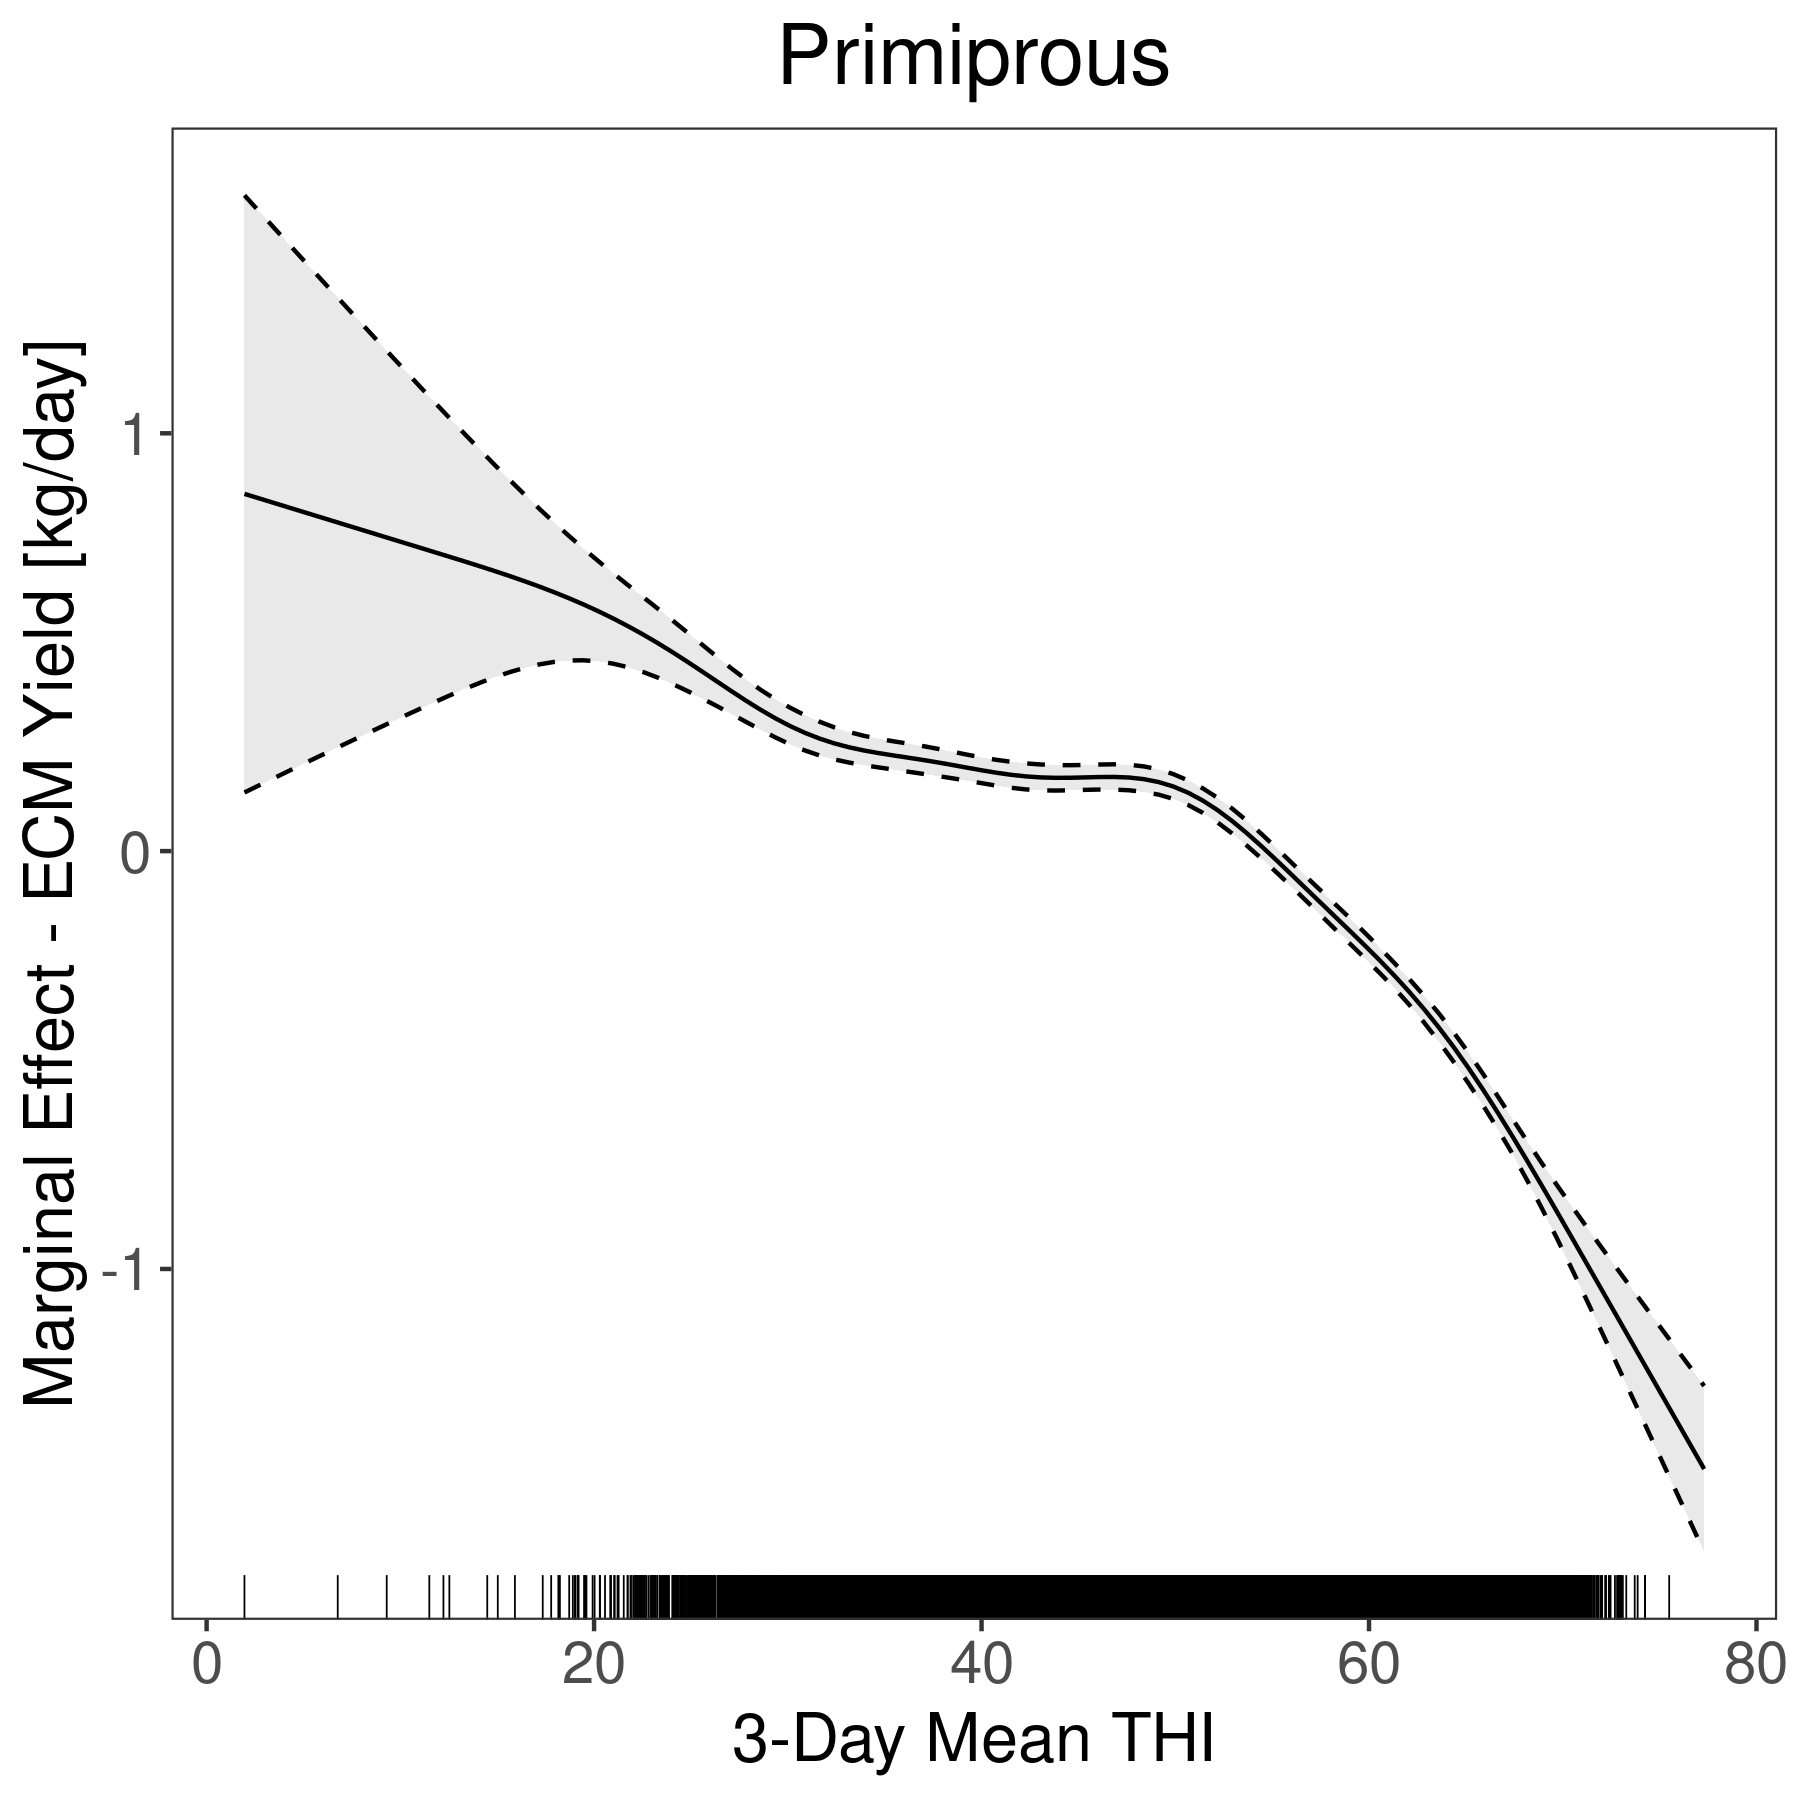
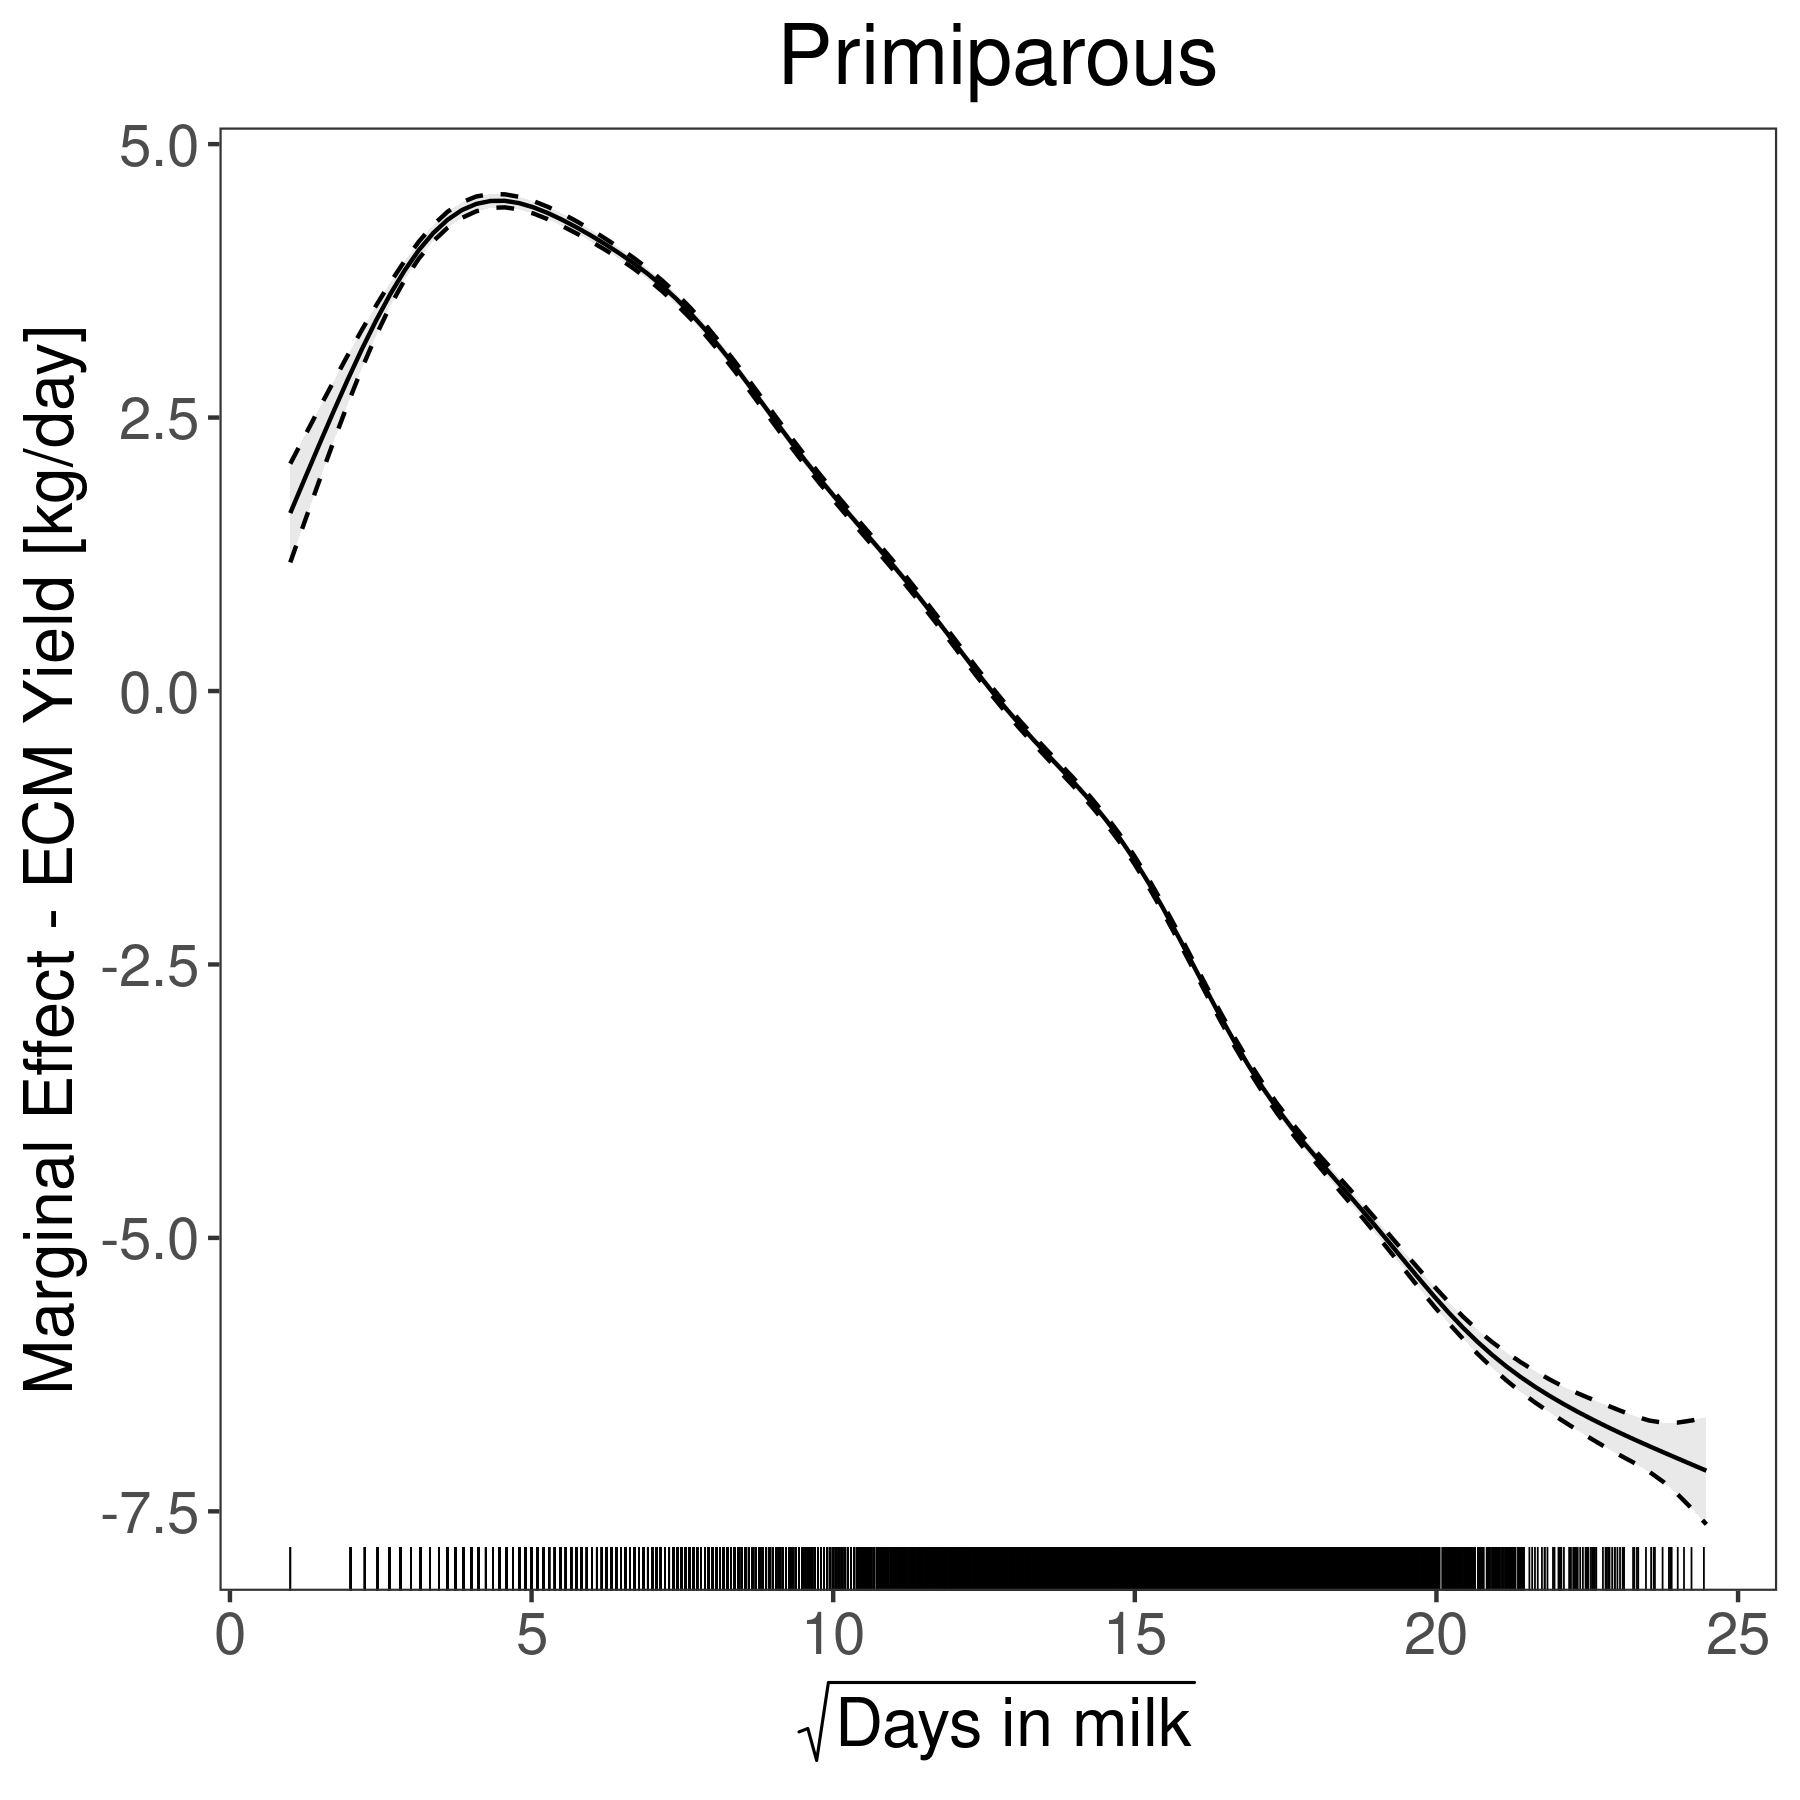
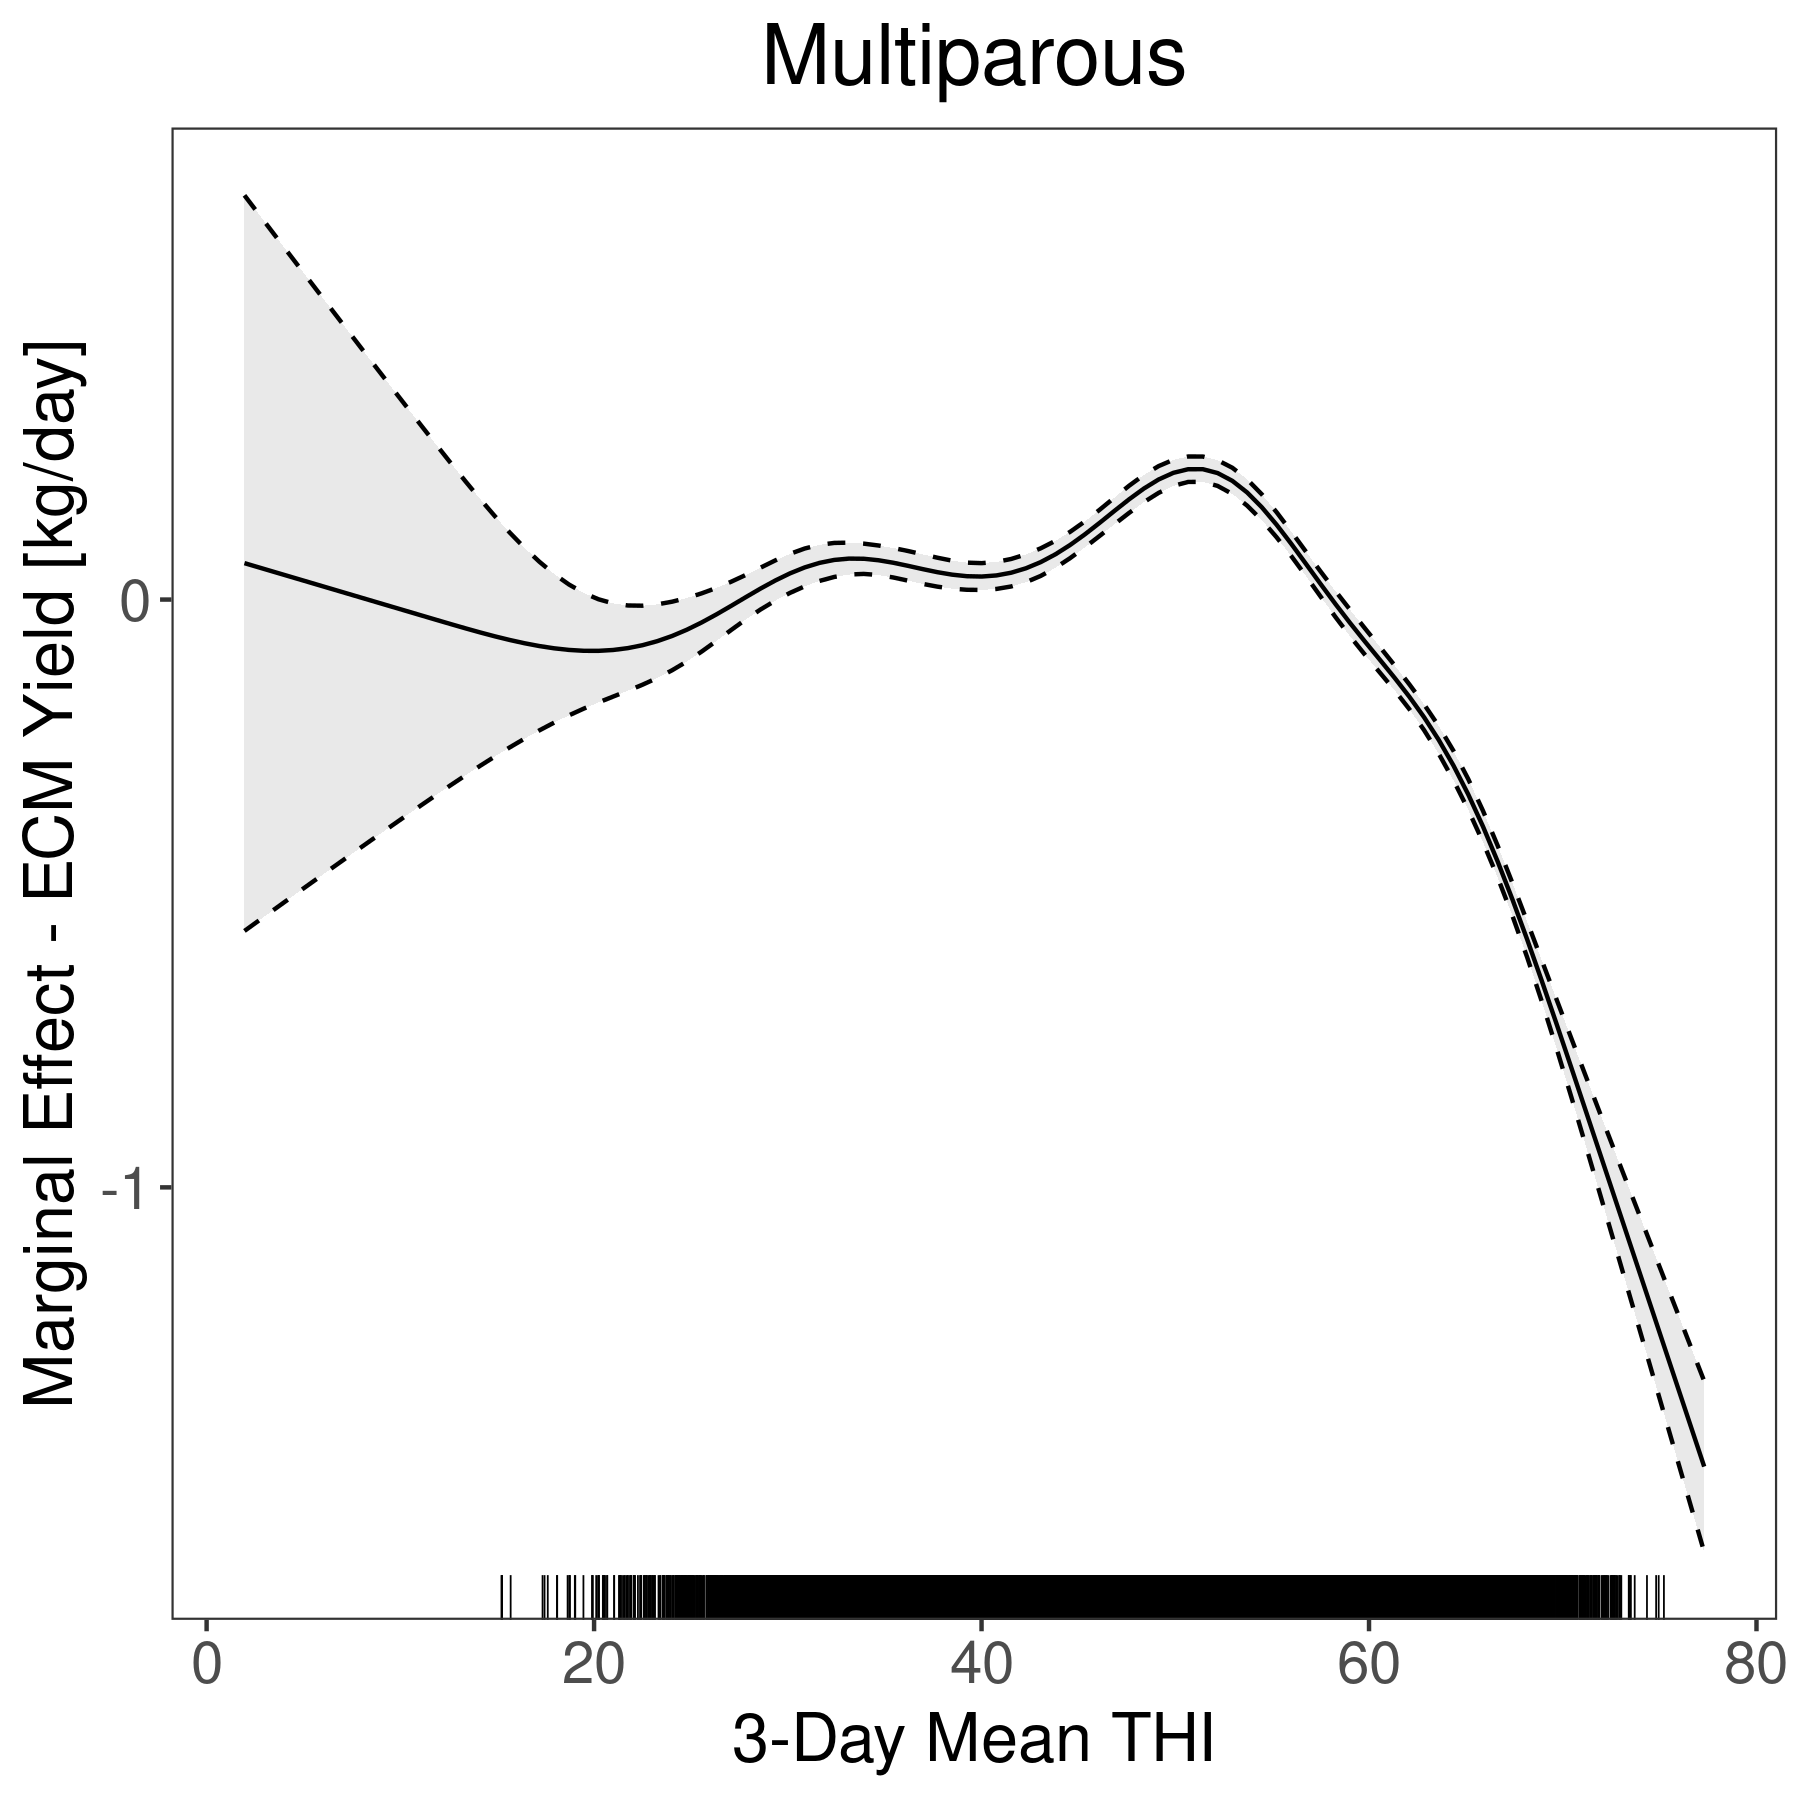
D.12 Jersey: ECM Yield
D.12.1: Full Period: 1998-2023
Model Summary
| A. parametric coefficients | Estimate | Std. Error | t-value | p-value |
|---|---|---|---|---|
| (Intercept) | 18.5383 | 0.8722 | 21.2546 | \(< 0.0001\) |
| parityprimiparous | -3.1781 | 0.0163 | -195.4078 | \(< 0.0001\) |
| year1999 | -0.8262 | 0.9761 | -0.8464 | 0.3973 |
| year2000 | 0.0183 | 0.9690 | 0.0189 | 0.9849 |
| year2001 | 0.7161 | 0.9324 | 0.7680 | 0.4425 |
| year2002 | 1.1984 | 0.9342 | 1.2828 | 0.1996 |
| year2003 | 1.6896 | 0.9407 | 1.7962 | 0.0725 |
| year2004 | 2.3125 | 0.9084 | 2.5456 | 0.0109 |
| year2005 | 2.6139 | 0.8927 | 2.9282 | 0.0034 |
| year2006 | 2.7400 | 0.8919 | 3.0722 | 0.0021 |
| year2007 | 2.5140 | 0.8873 | 2.8333 | 0.0046 |
| year2008 | 2.9241 | 0.8861 | 3.2999 | 0.0010 |
| year2009 | 3.0485 | 0.8928 | 3.4146 | 0.0006 |
| year2010 | 3.2974 | 0.8999 | 3.6642 | \(< 0.0005\) |
| year2011 | 3.5419 | 0.8911 | 3.9750 | \(< 0.0001\) |
| year2012 | 3.8750 | 0.8833 | 4.3869 | \(< 0.0001\) |
| year2013 | 3.8343 | 0.8801 | 4.3567 | \(< 0.0001\) |
| year2014 | 4.5334 | 0.8848 | 5.1234 | \(< 0.0001\) |
| year2015 | 4.6029 | 0.8831 | 5.2123 | \(< 0.0001\) |
| year2016 | 4.9300 | 0.8818 | 5.5910 | \(< 0.0001\) |
| year2017 | 5.2786 | 0.8865 | 5.9547 | \(< 0.0001\) |
| year2018 | 5.6528 | 0.8850 | 6.3875 | \(< 0.0001\) |
| year2019 | 6.0667 | 0.8797 | 6.8962 | \(< 0.0001\) |
| year2020 | 6.3867 | 0.8849 | 7.2176 | \(< 0.0001\) |
| year2021 | 6.4376 | 0.8848 | 7.2758 | \(< 0.0001\) |
| year2022 | 6.1875 | 0.8845 | 6.9955 | \(< 0.0001\) |
| year2023 | 6.4372 | 0.8763 | 7.3457 | \(< 0.0001\) |
| B. smooth terms | edf | Ref.df | F-value | p-value |
|---|---|---|---|---|
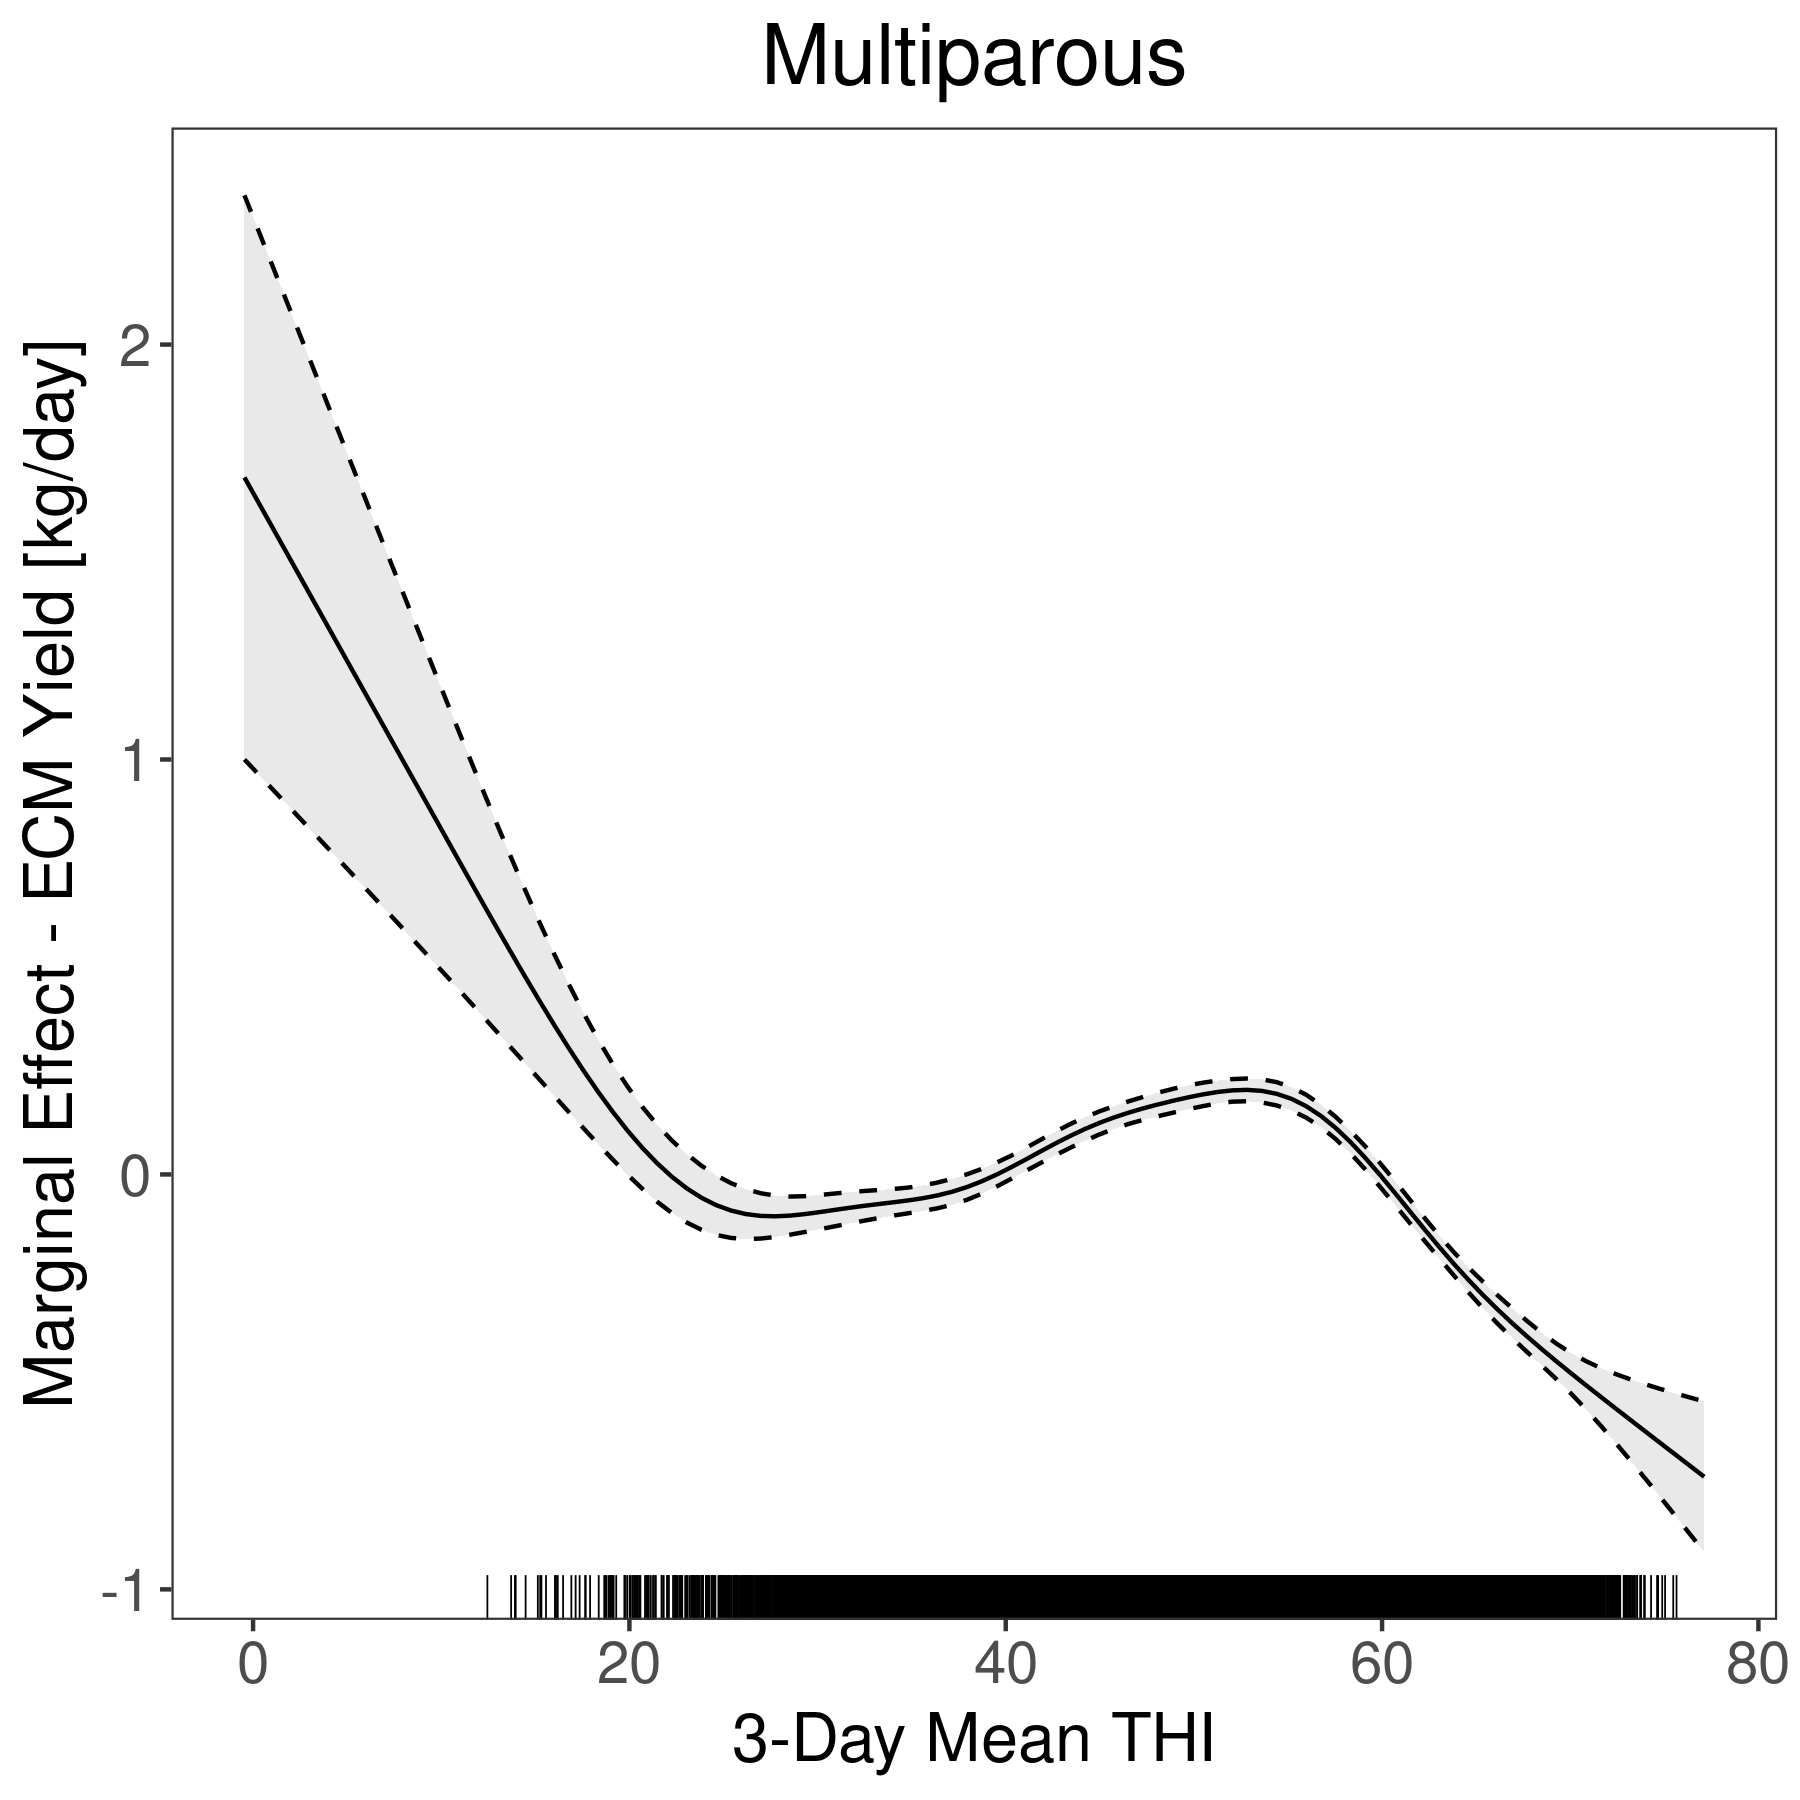
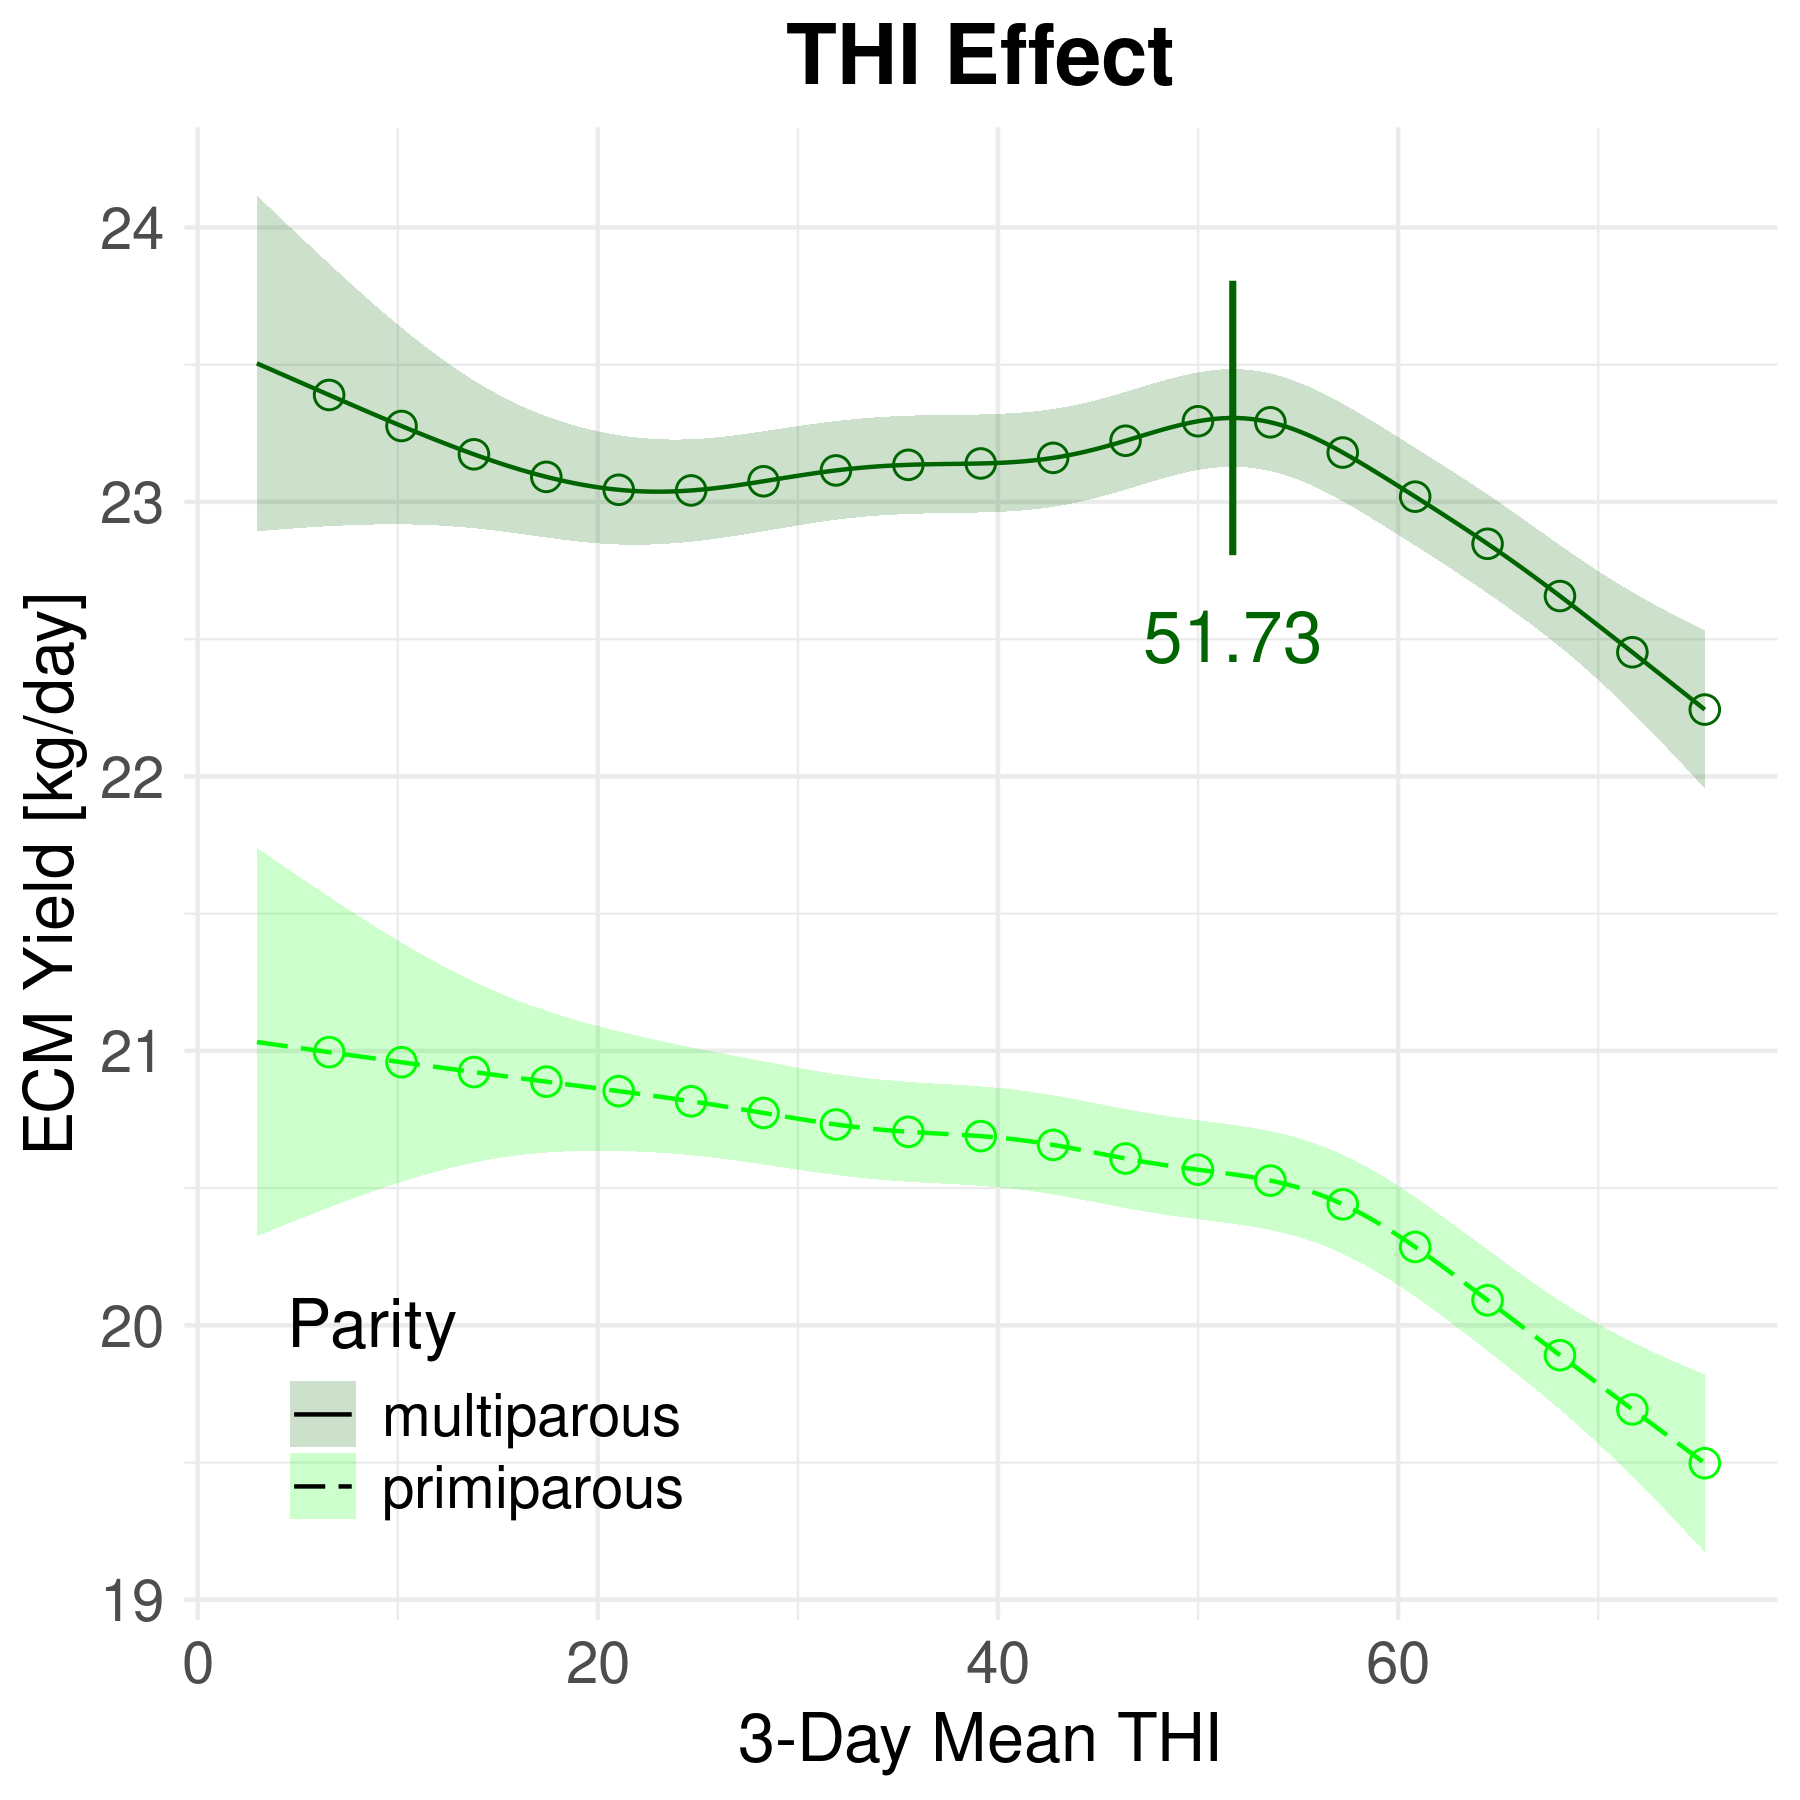
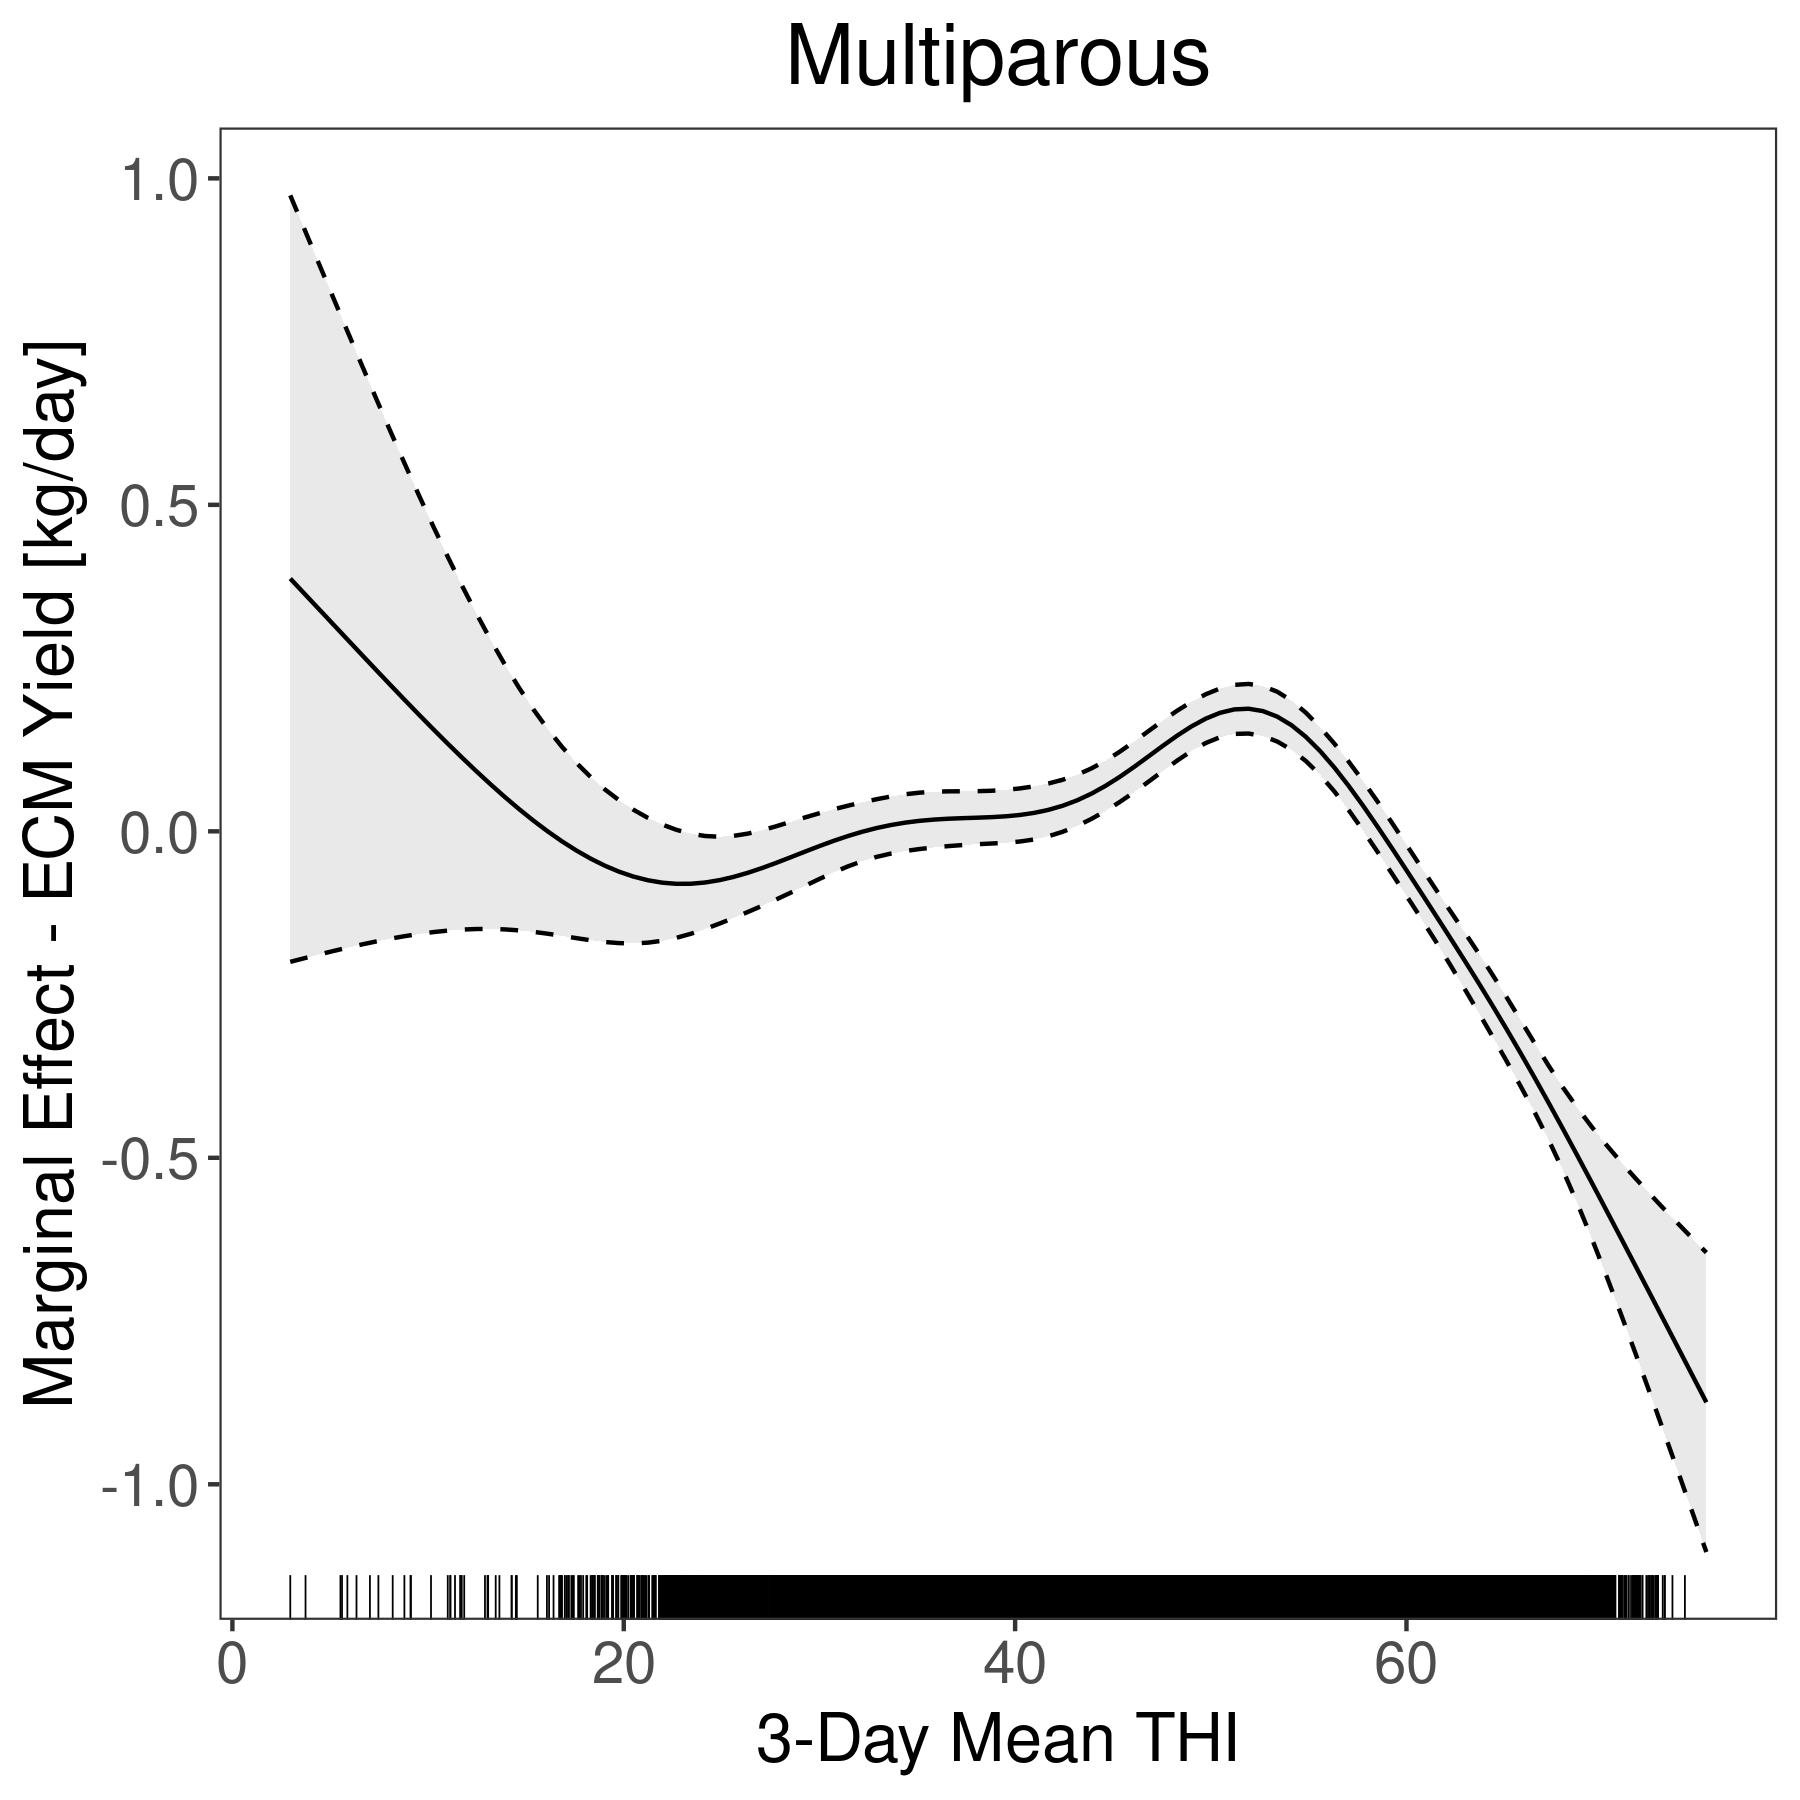
| s(thi_mean_t0_3d):paritymultiparous | 7.9519 | 7.9519 | 114.8914 | \(< 0.0001\) |
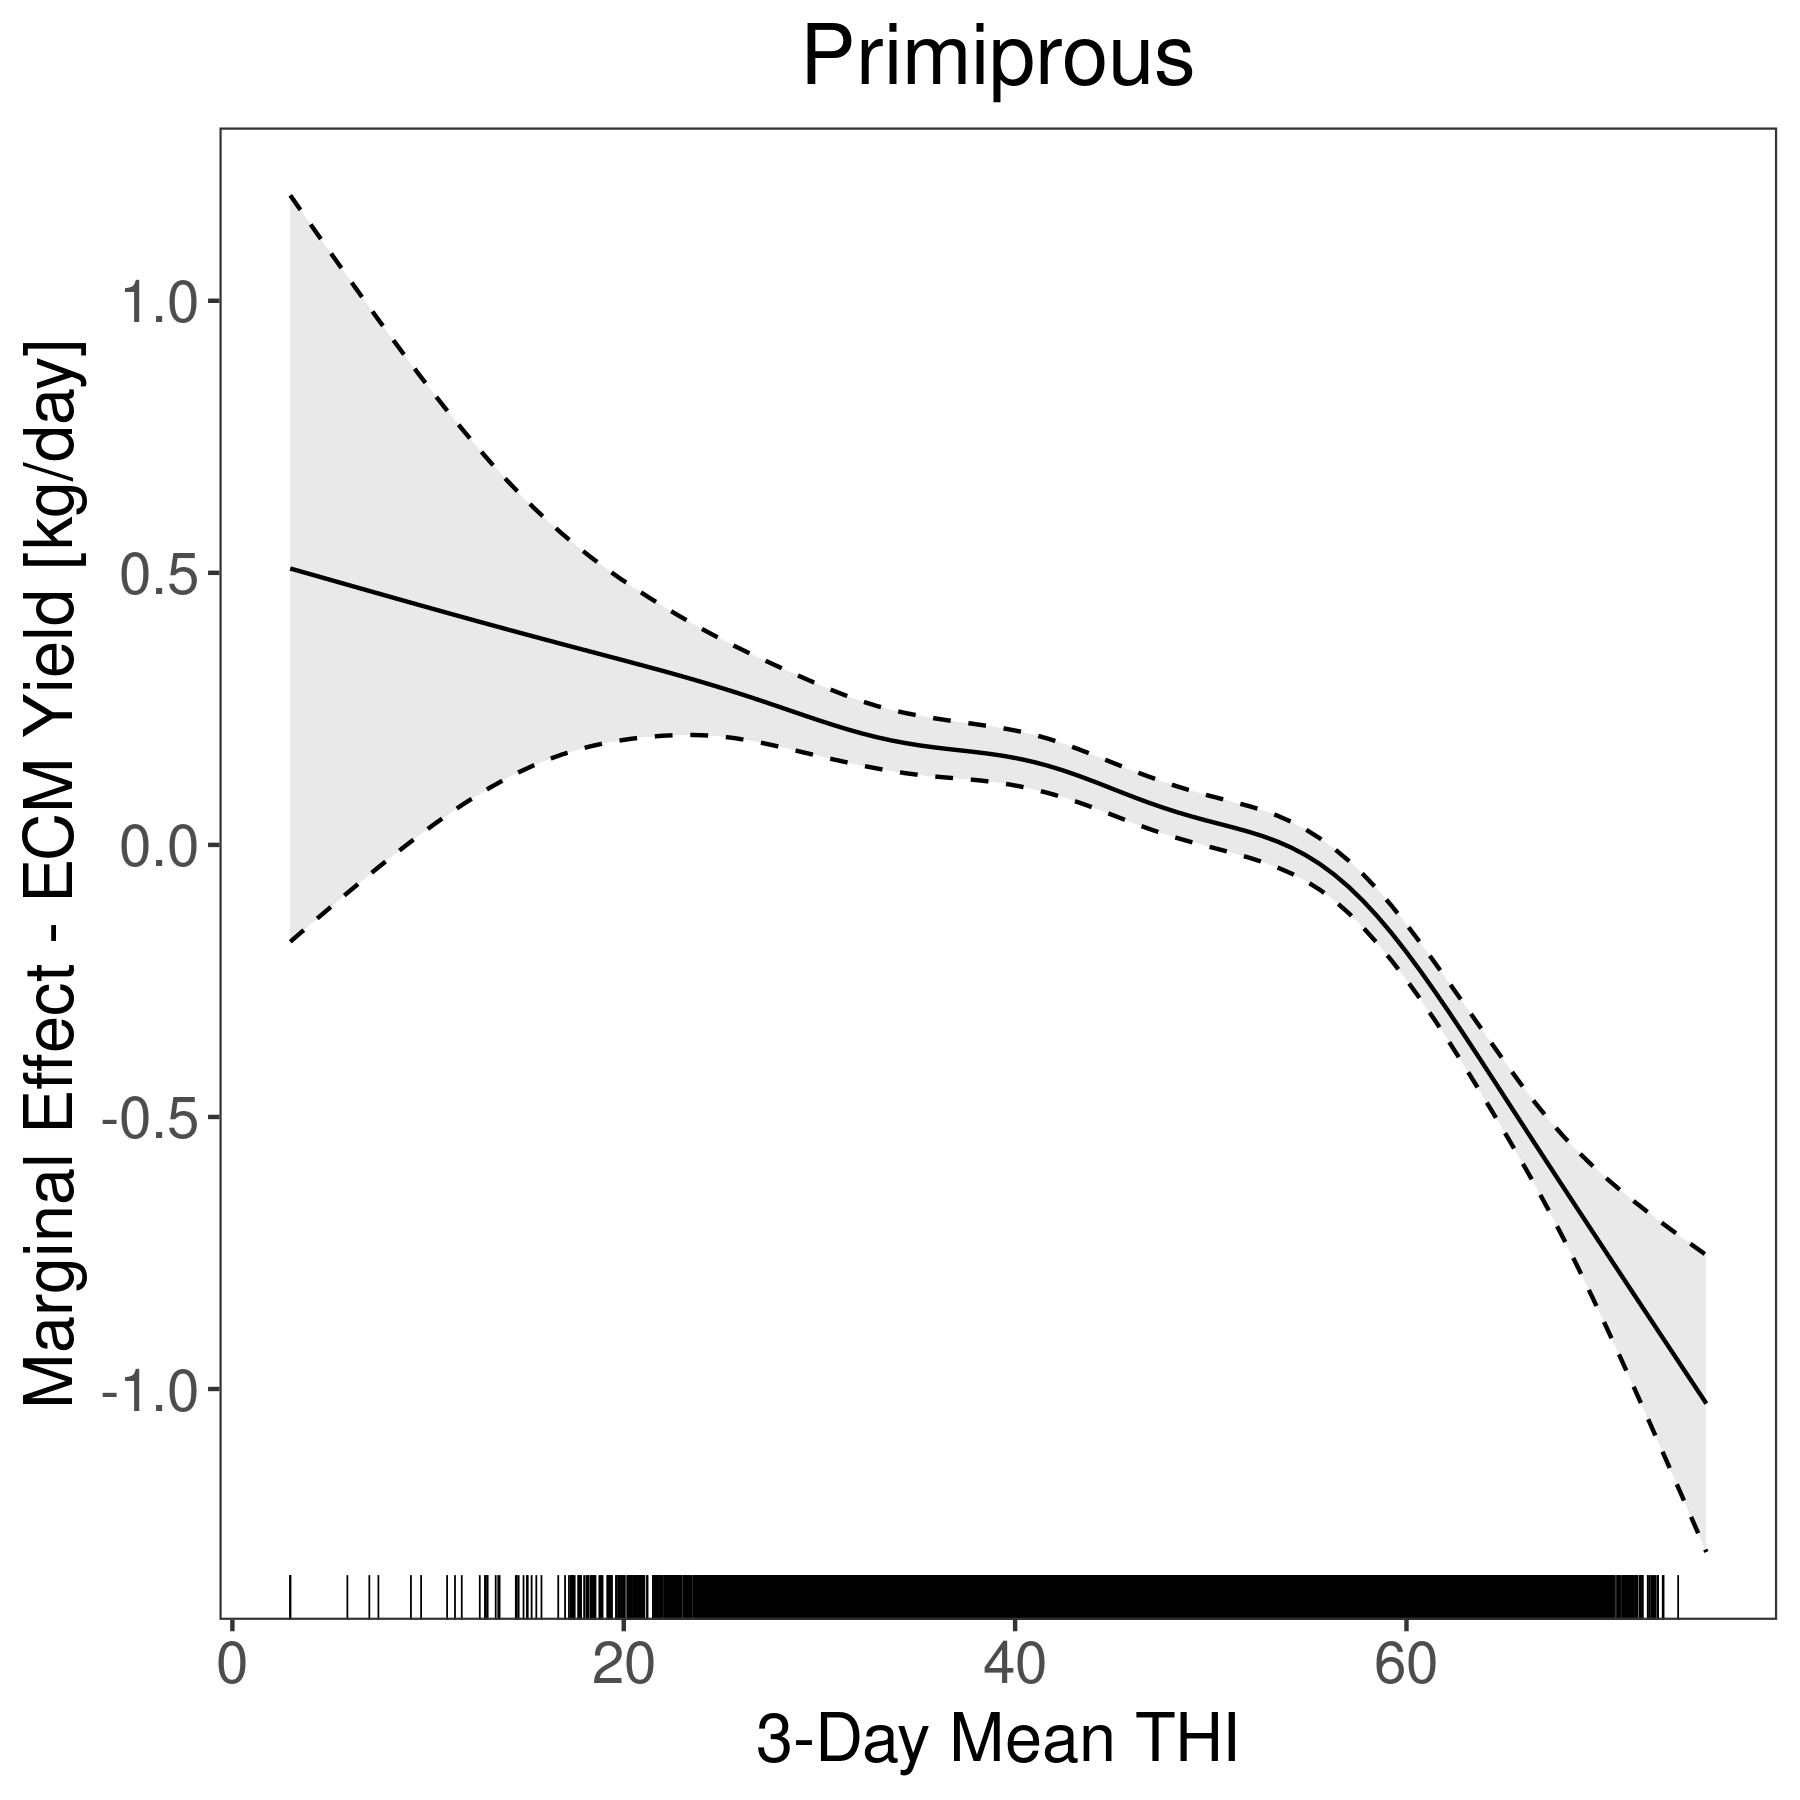
| s(thi_mean_t0_3d):parityprimiparous | 5.6644 | 5.6644 | 146.4984 | \(< 0.0001\) |
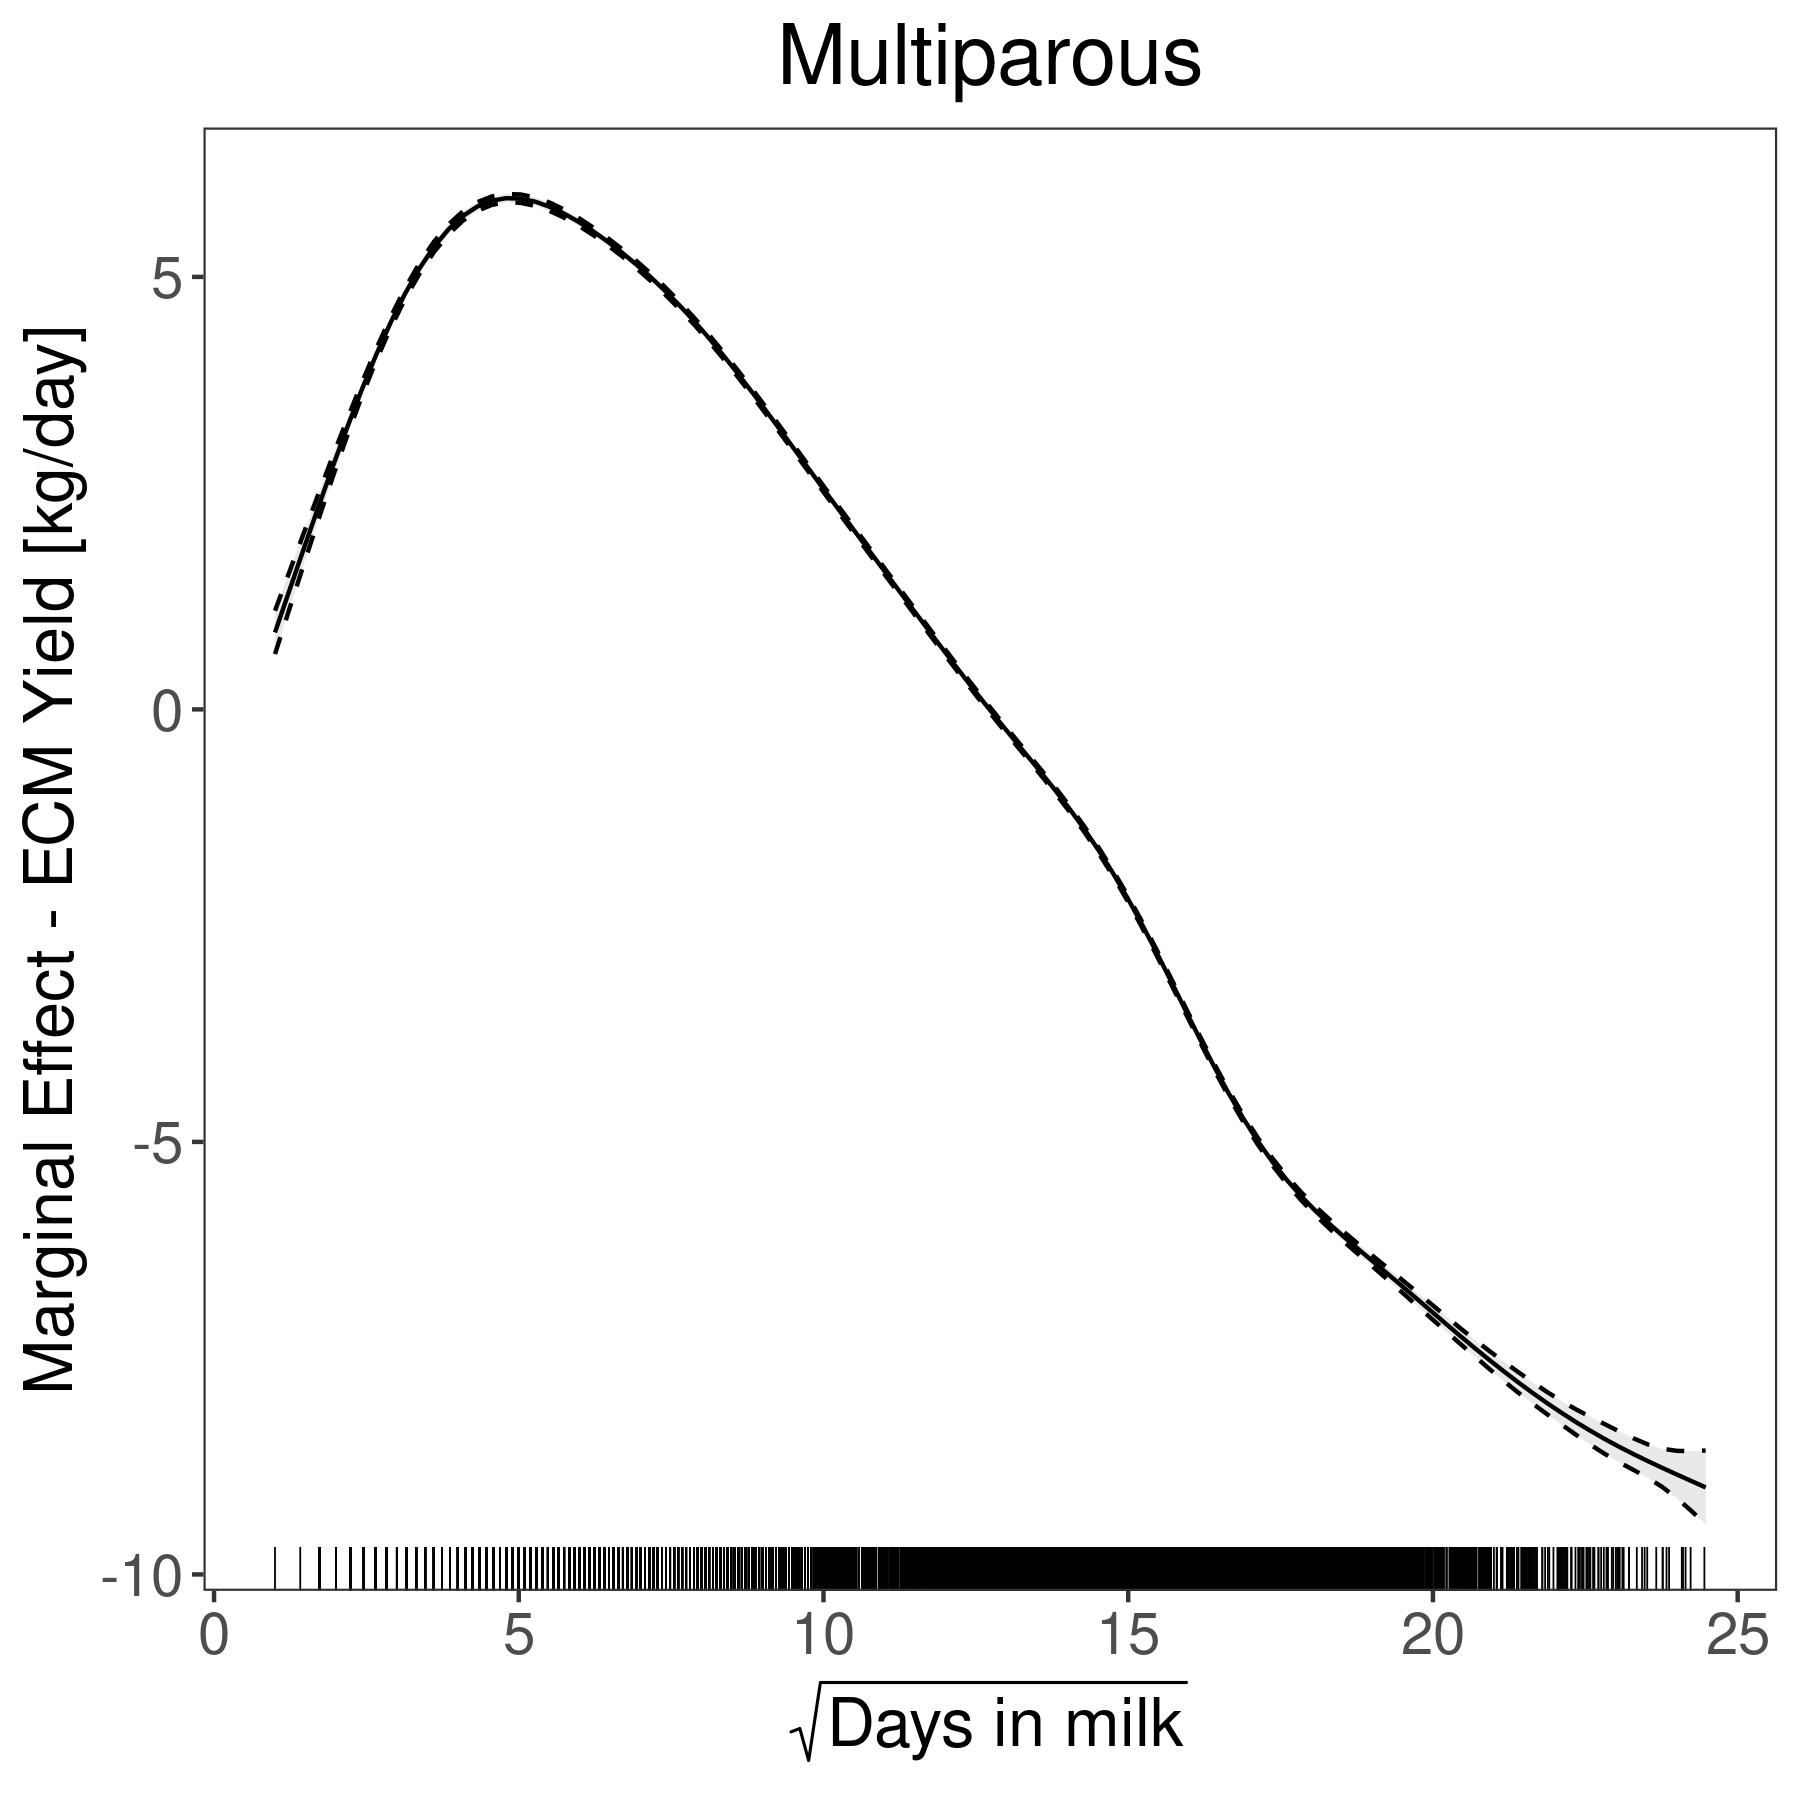
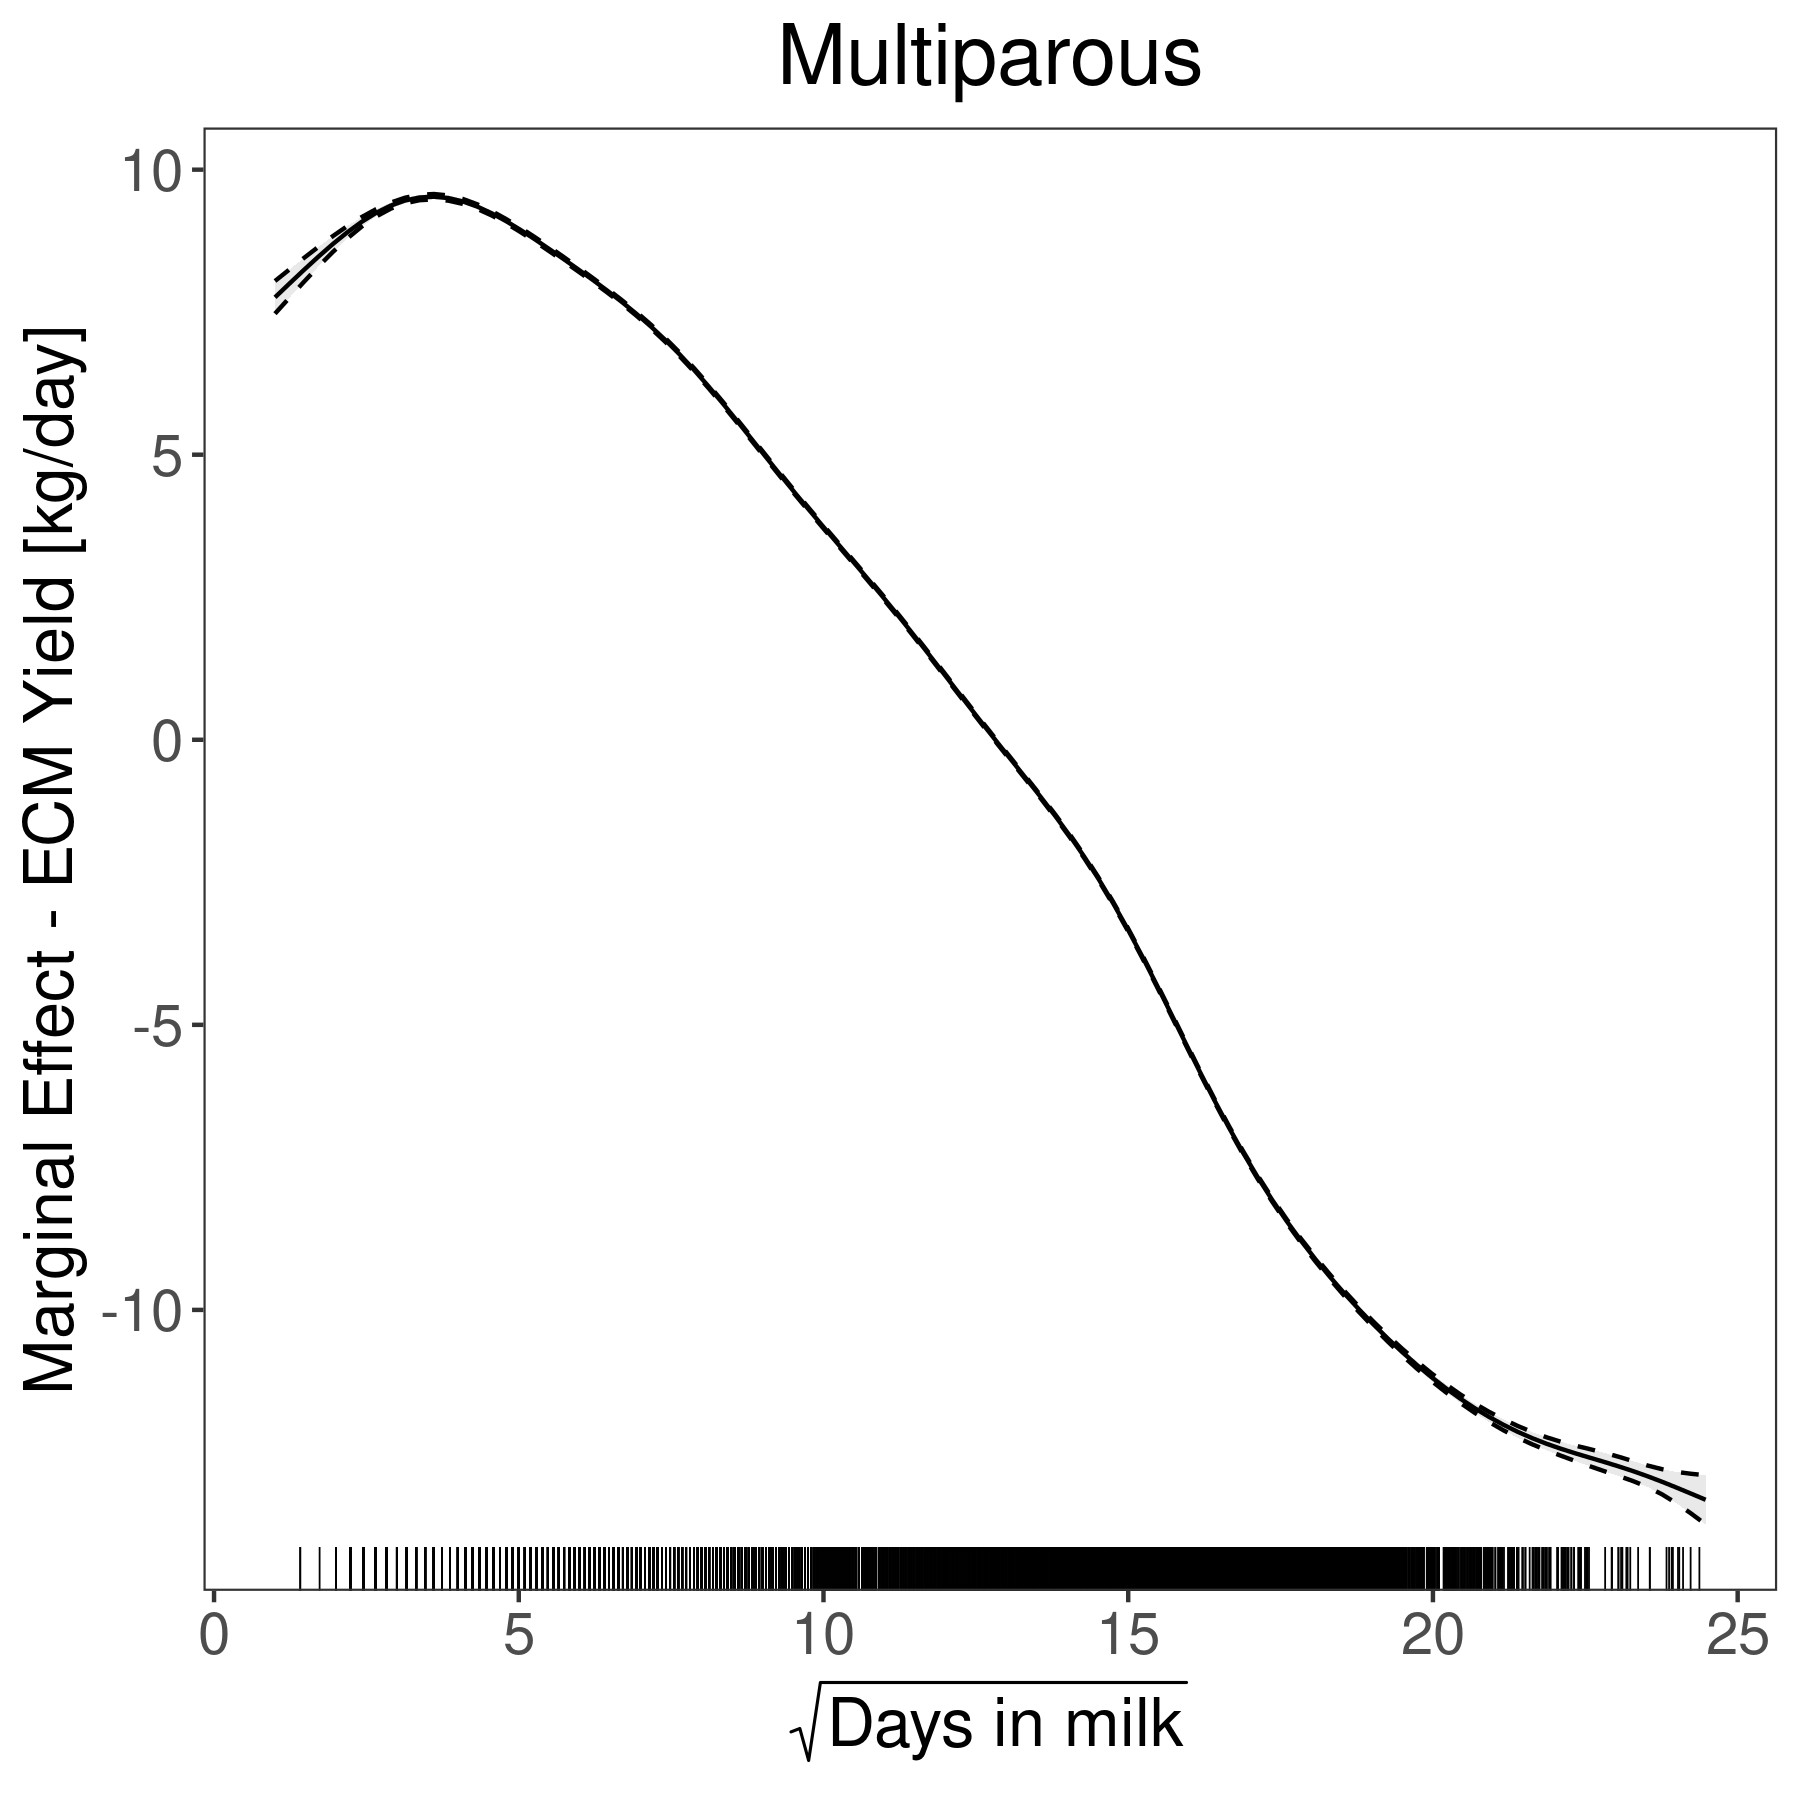
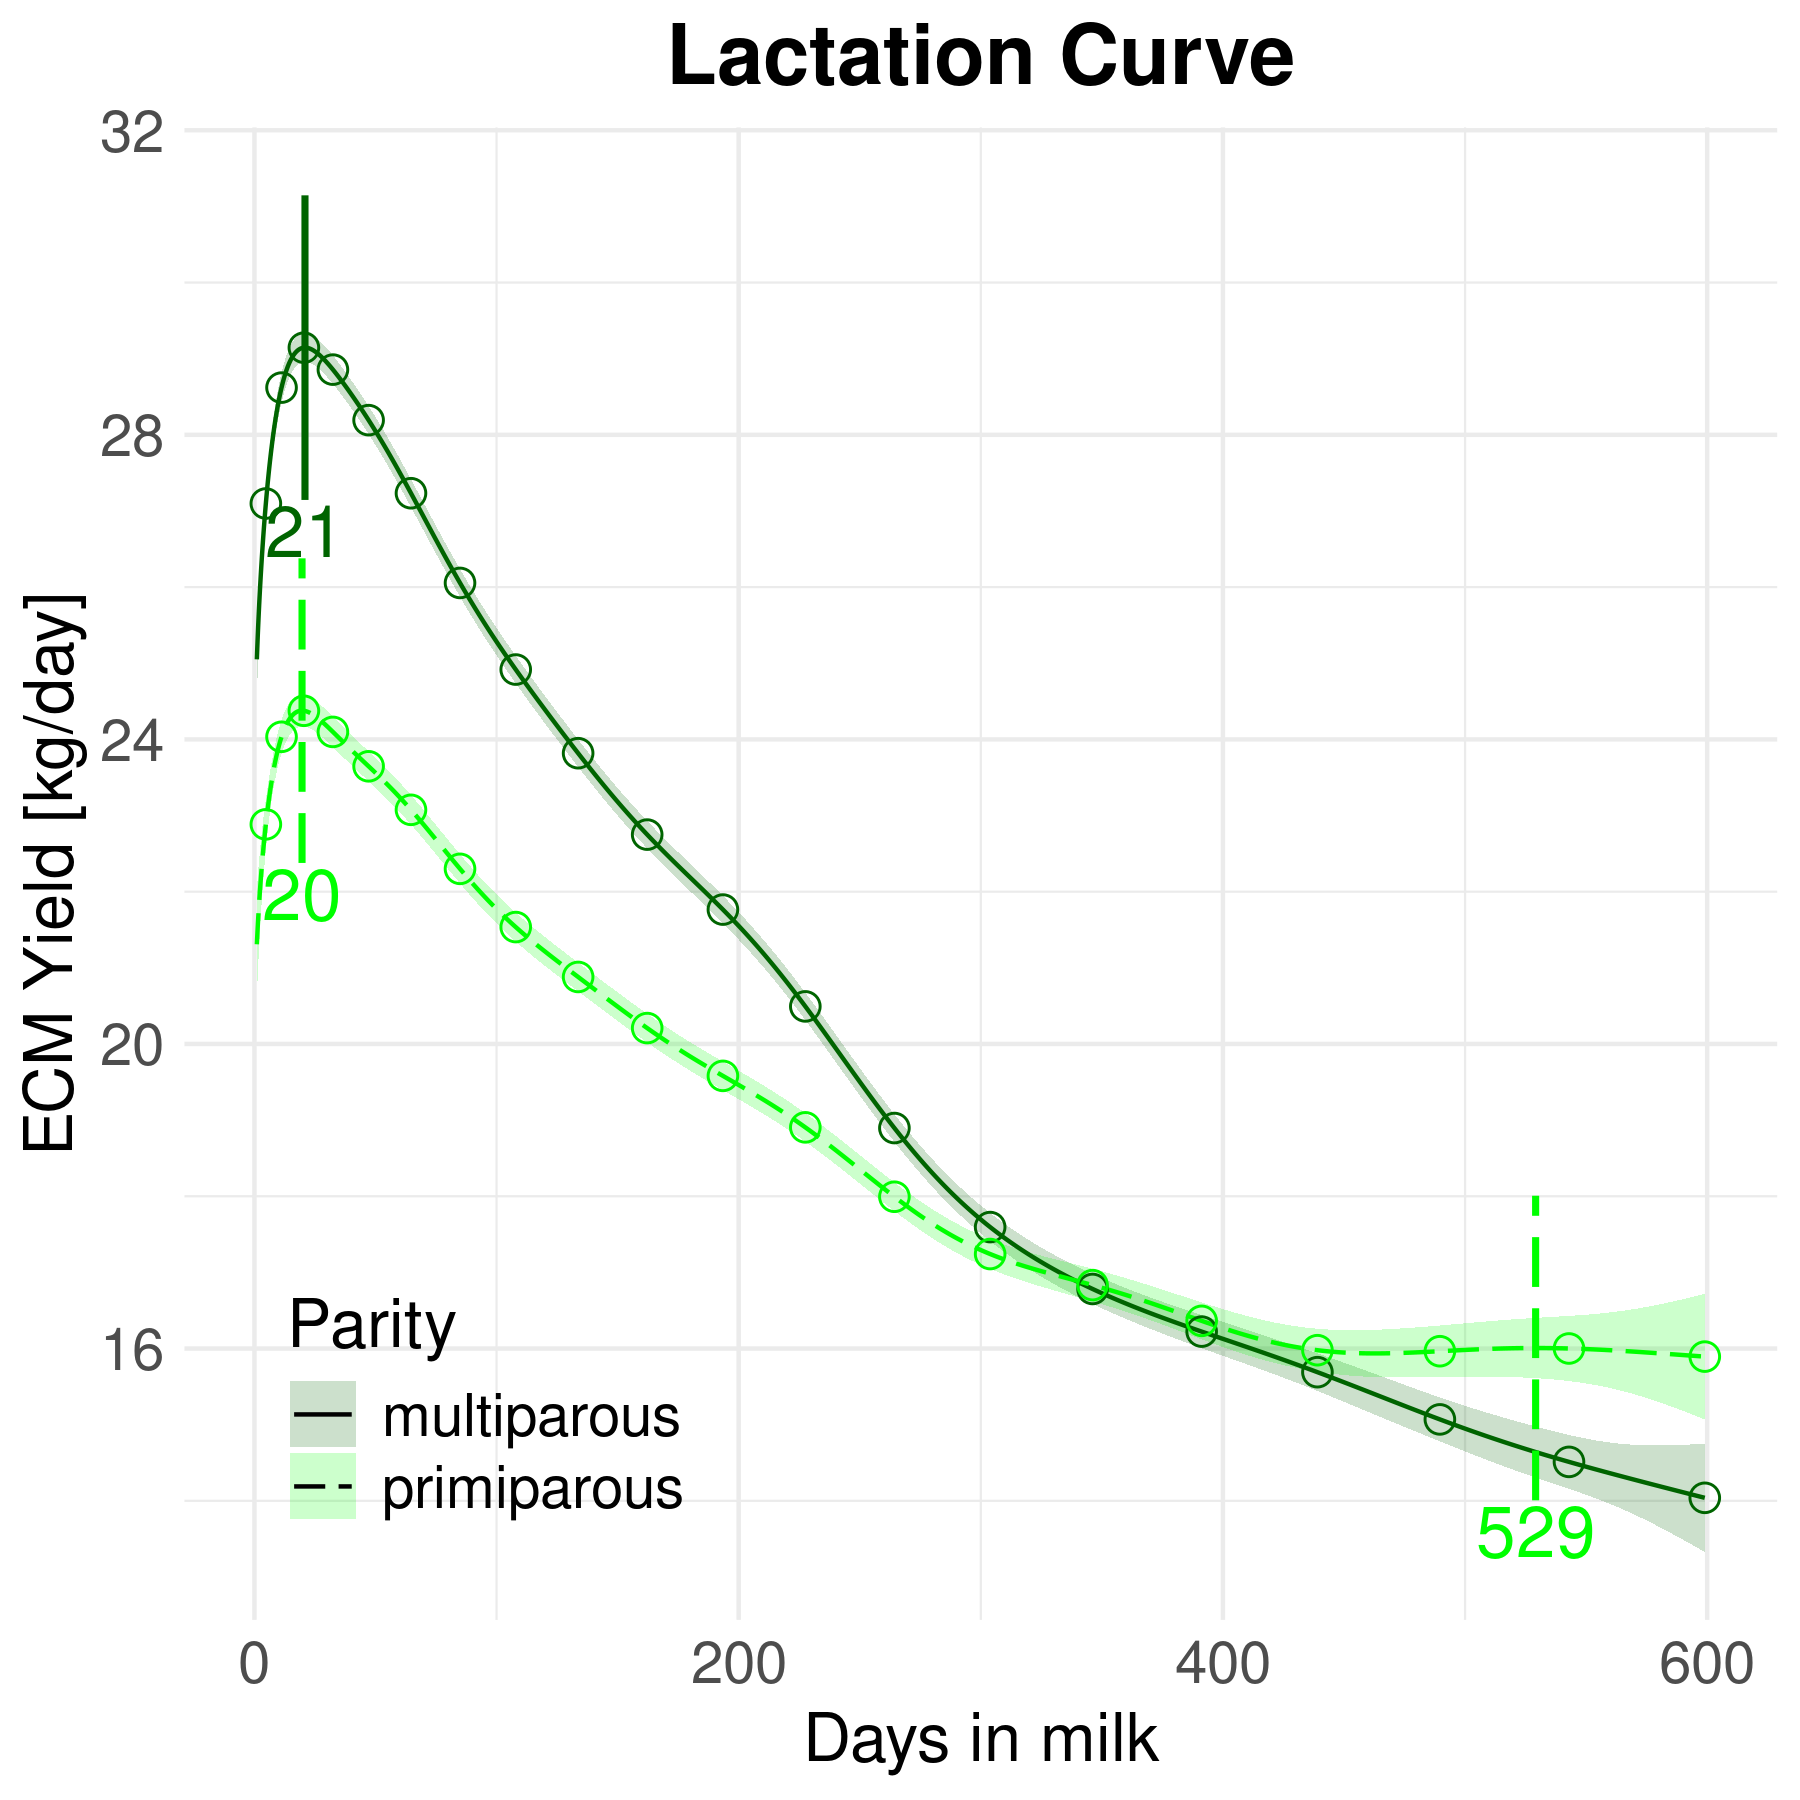
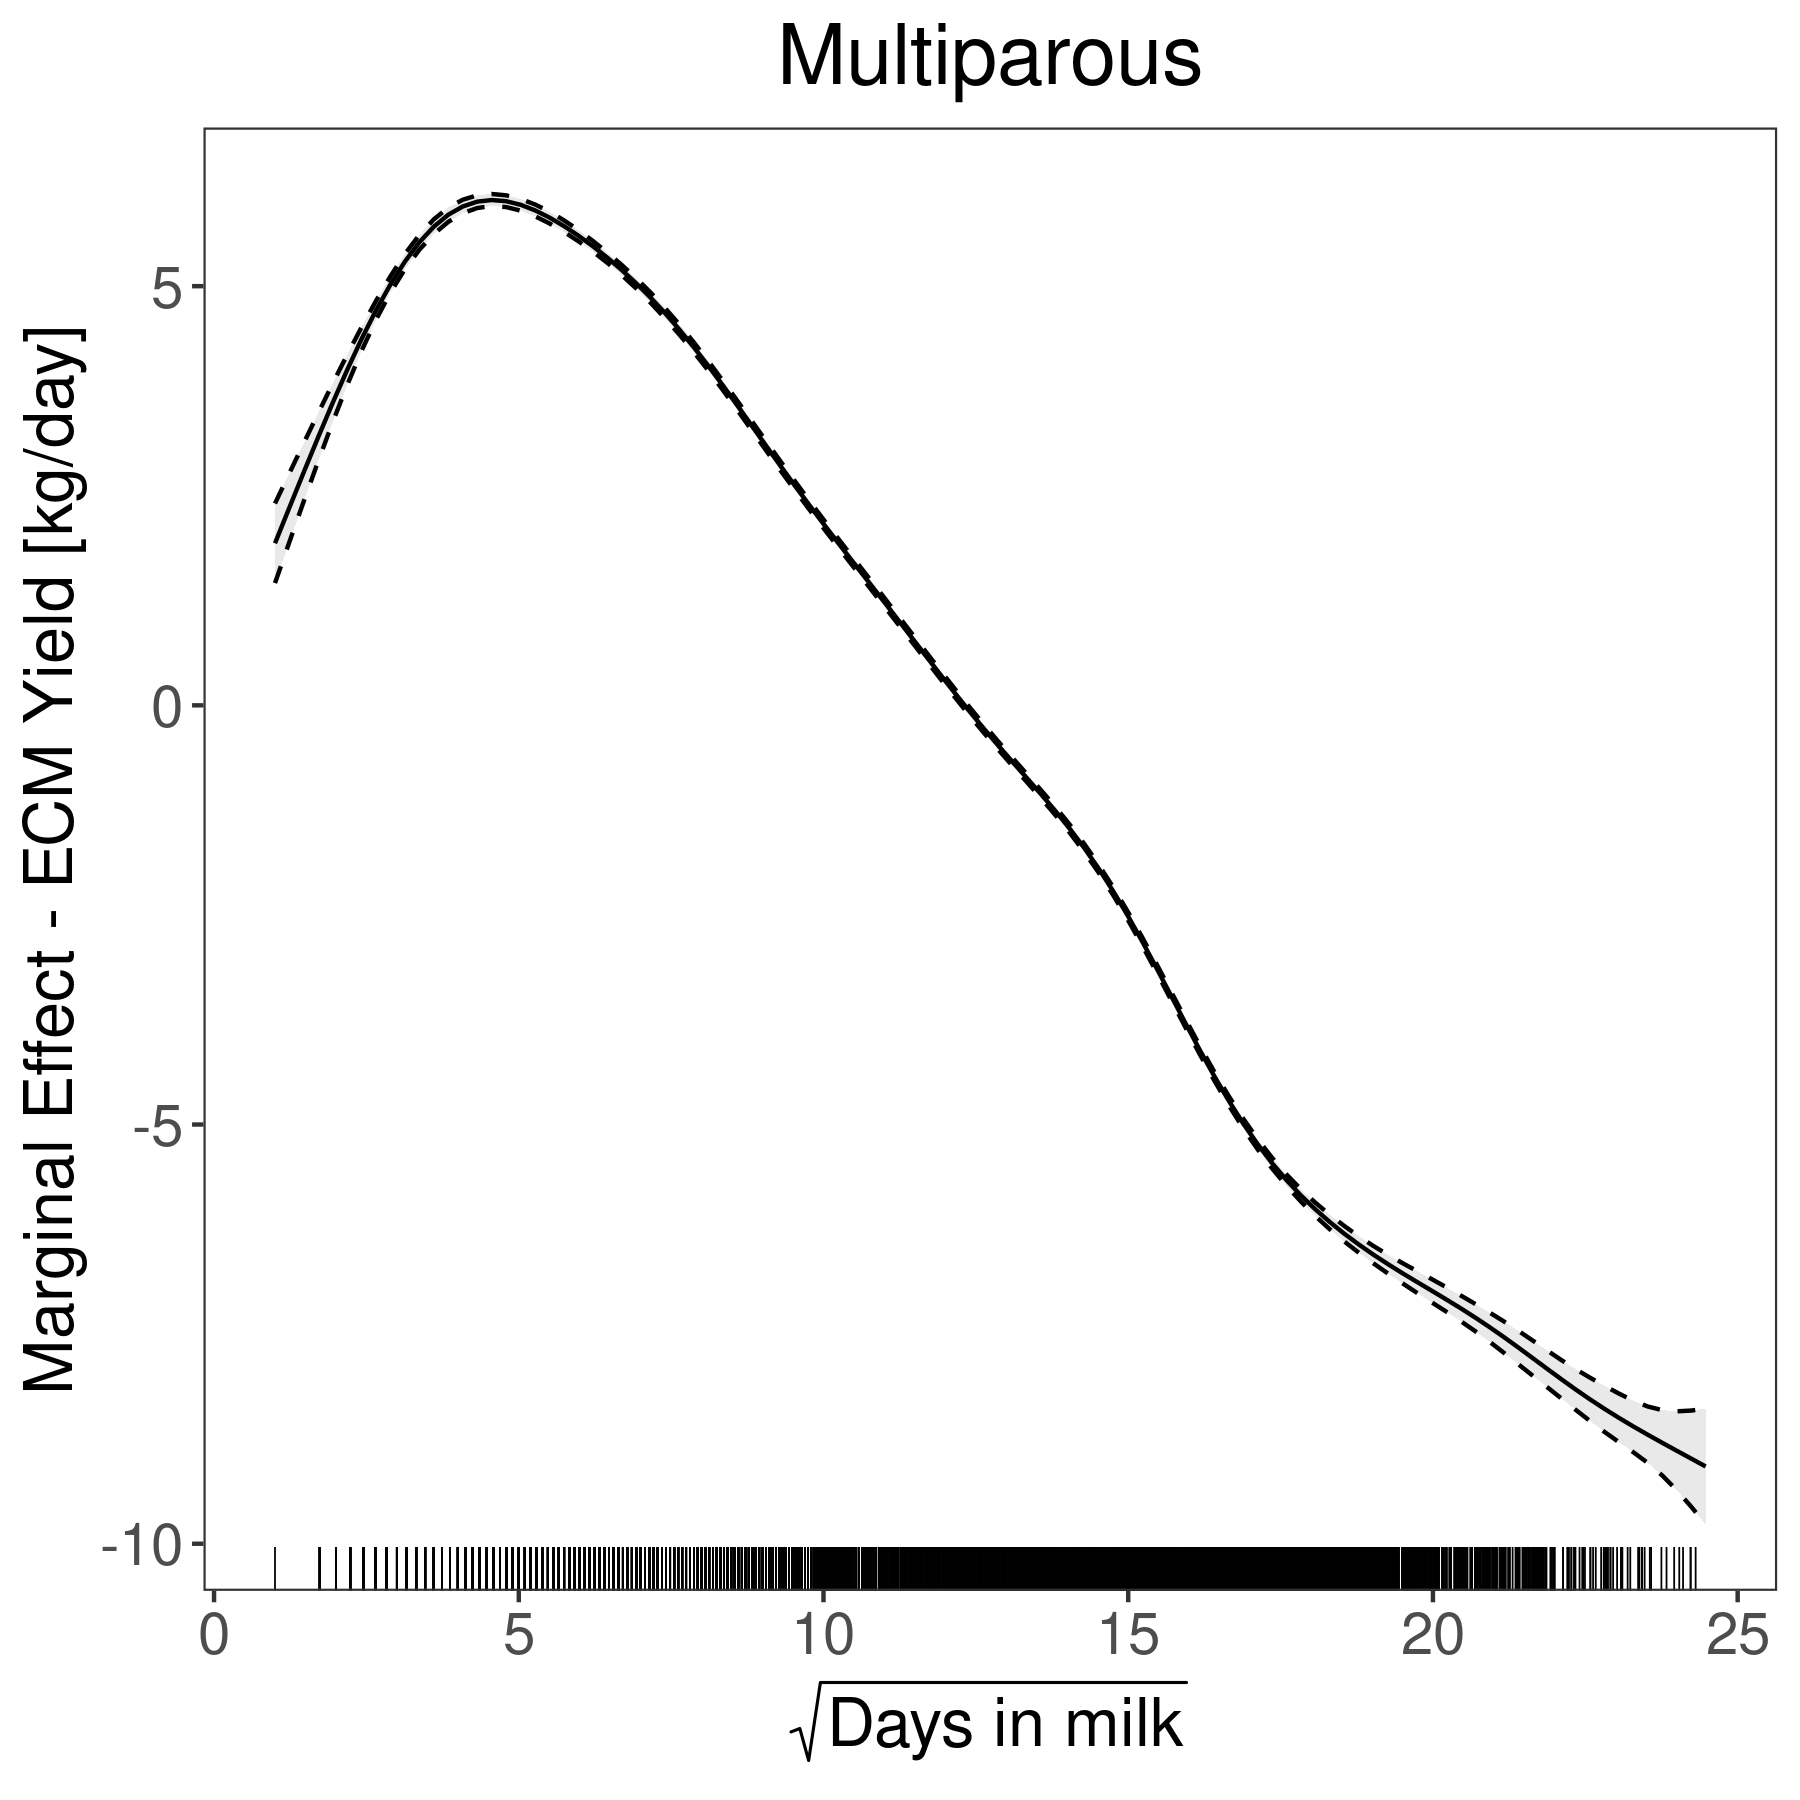
| s(days_in_milk_t):paritymultiparous | 13.5716 | 13.5716 | 34840.0802 | \(< 0.0001\) |
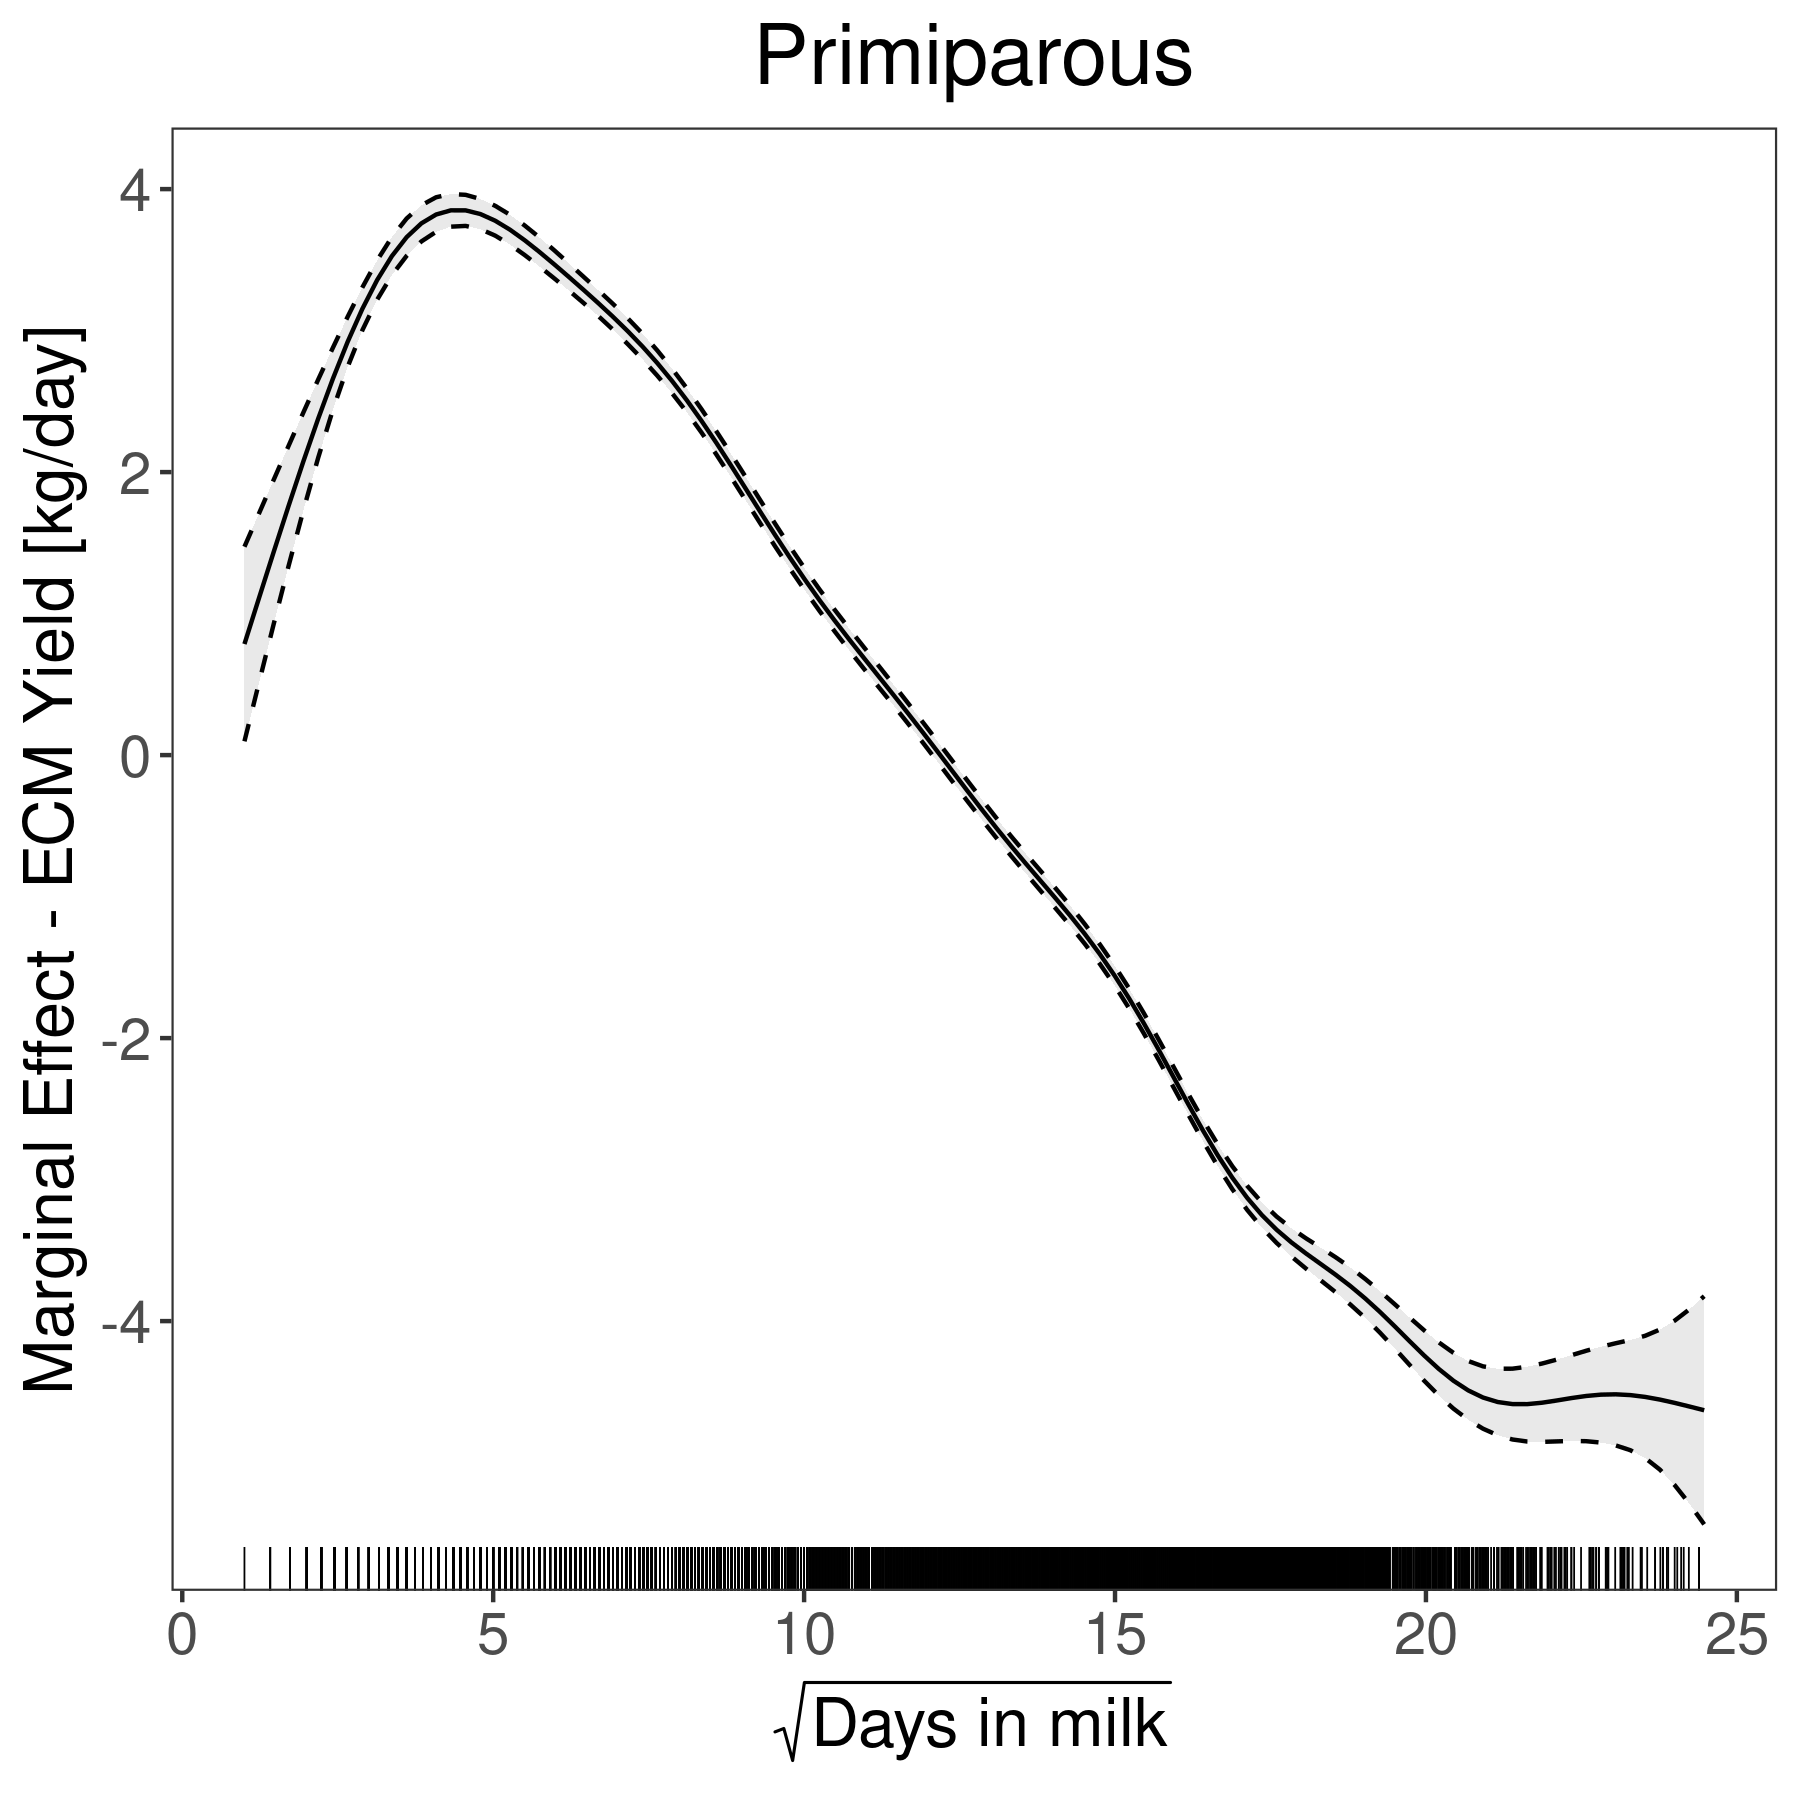
| s(days_in_milk_t):parityprimiparous | 13.0755 | 13.0755 | 3646.1487 | \(< 0.0001\) |
| Smooth Term Fixed Effect | Est. | SE | z | p |
|---|---|---|---|---|
| s(thi_mean_t0_3d):multiFx1 | 0.622797 | 0.111537 | 5.58 | \(< 1e-07\) |
| s(thi_mean_t0_3d):primiFx1 | 0.472103 | 0.115708 | 4.08 | \(< 1e-04\) |
| s(days_in_milk_):multiFx1 | 3.87517 | 0.426994 | 9.08 | \(< 1e-18\) |
| s(days_in_milk_):primiFx1 | 3.47422 | 0.603778 | 5.75 | \(< 1e-08\) |
| Variance Component | Estimated \( \sigma \) | |||
|---|---|---|---|---|
| \( \sigma_\alpha\) | 2.63725 | |||
| \( \sigma_\iota\) | 1.11866 | |||
| \( \sigma_\phi\) | 3.68271 | |||
| s(thi_mean_t0_3d):multi | 1.89398 | |||
| s(days_in_milk_):primi | 8.30084 | |||
| s(days_in_milk_):multi | 8.67344 | |||
| s(thi_mean_t0_3d):primi | 1.04356 | |||
| Residual | 3.85243 |
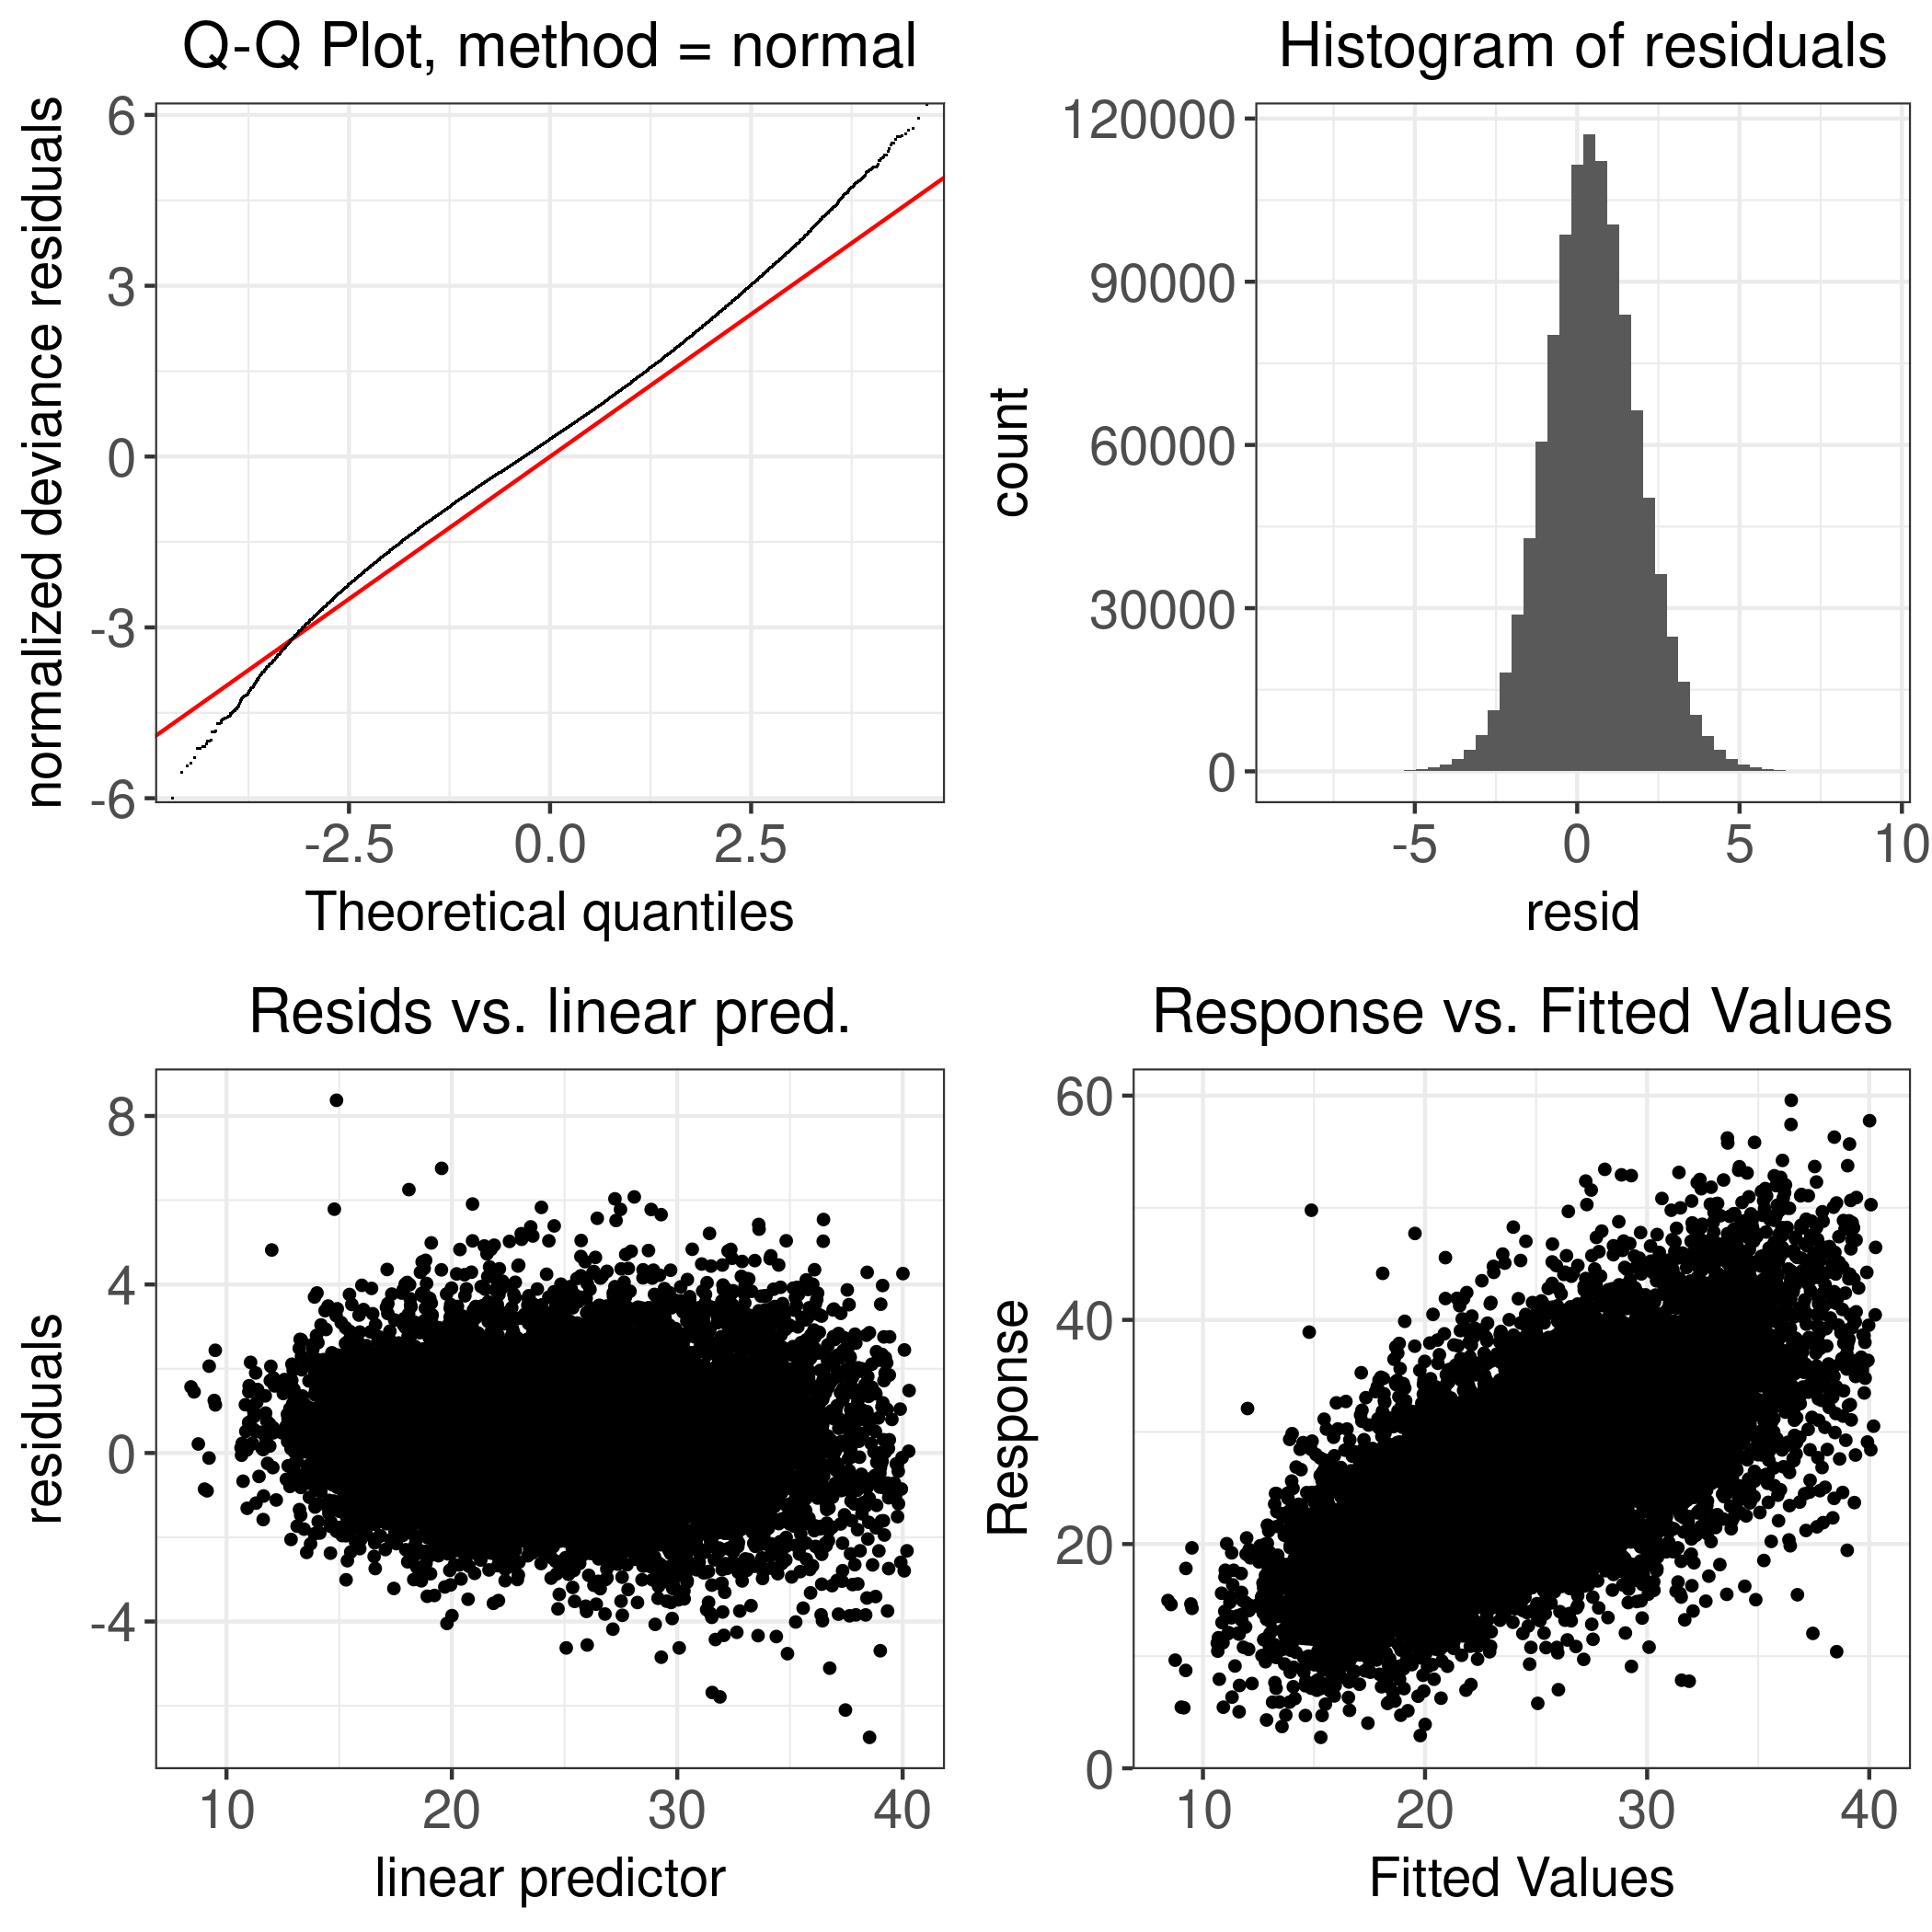
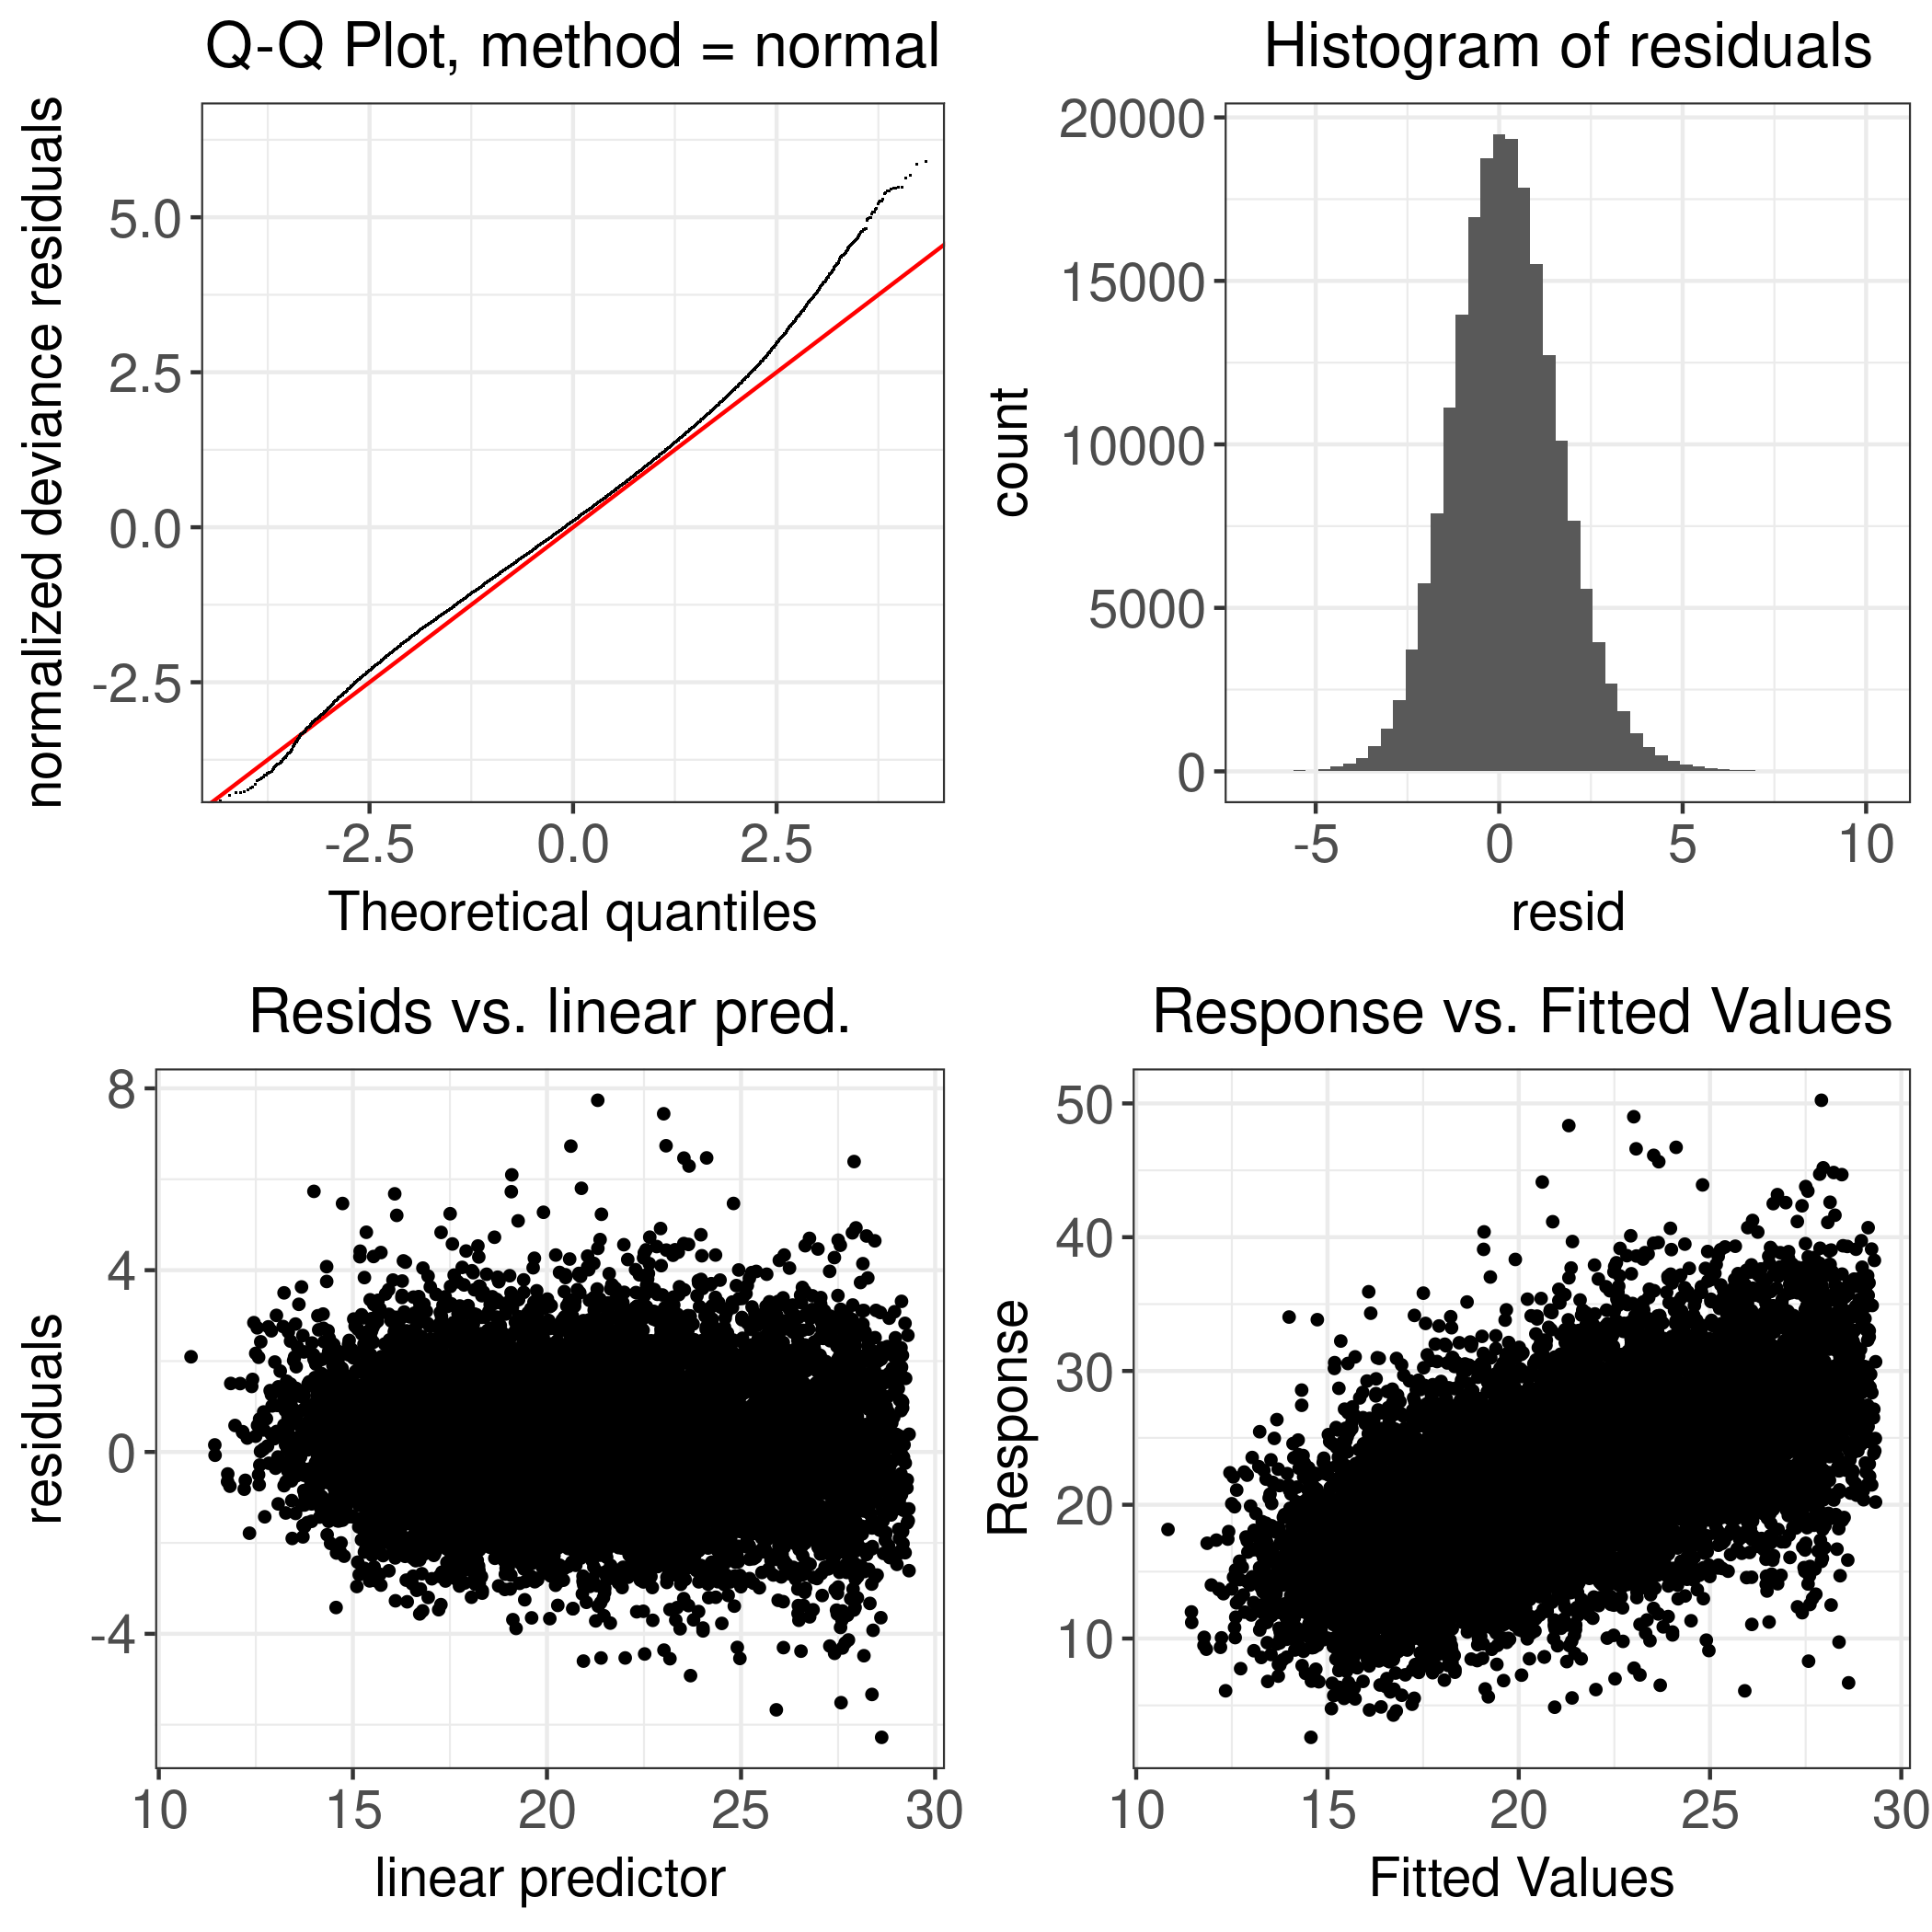
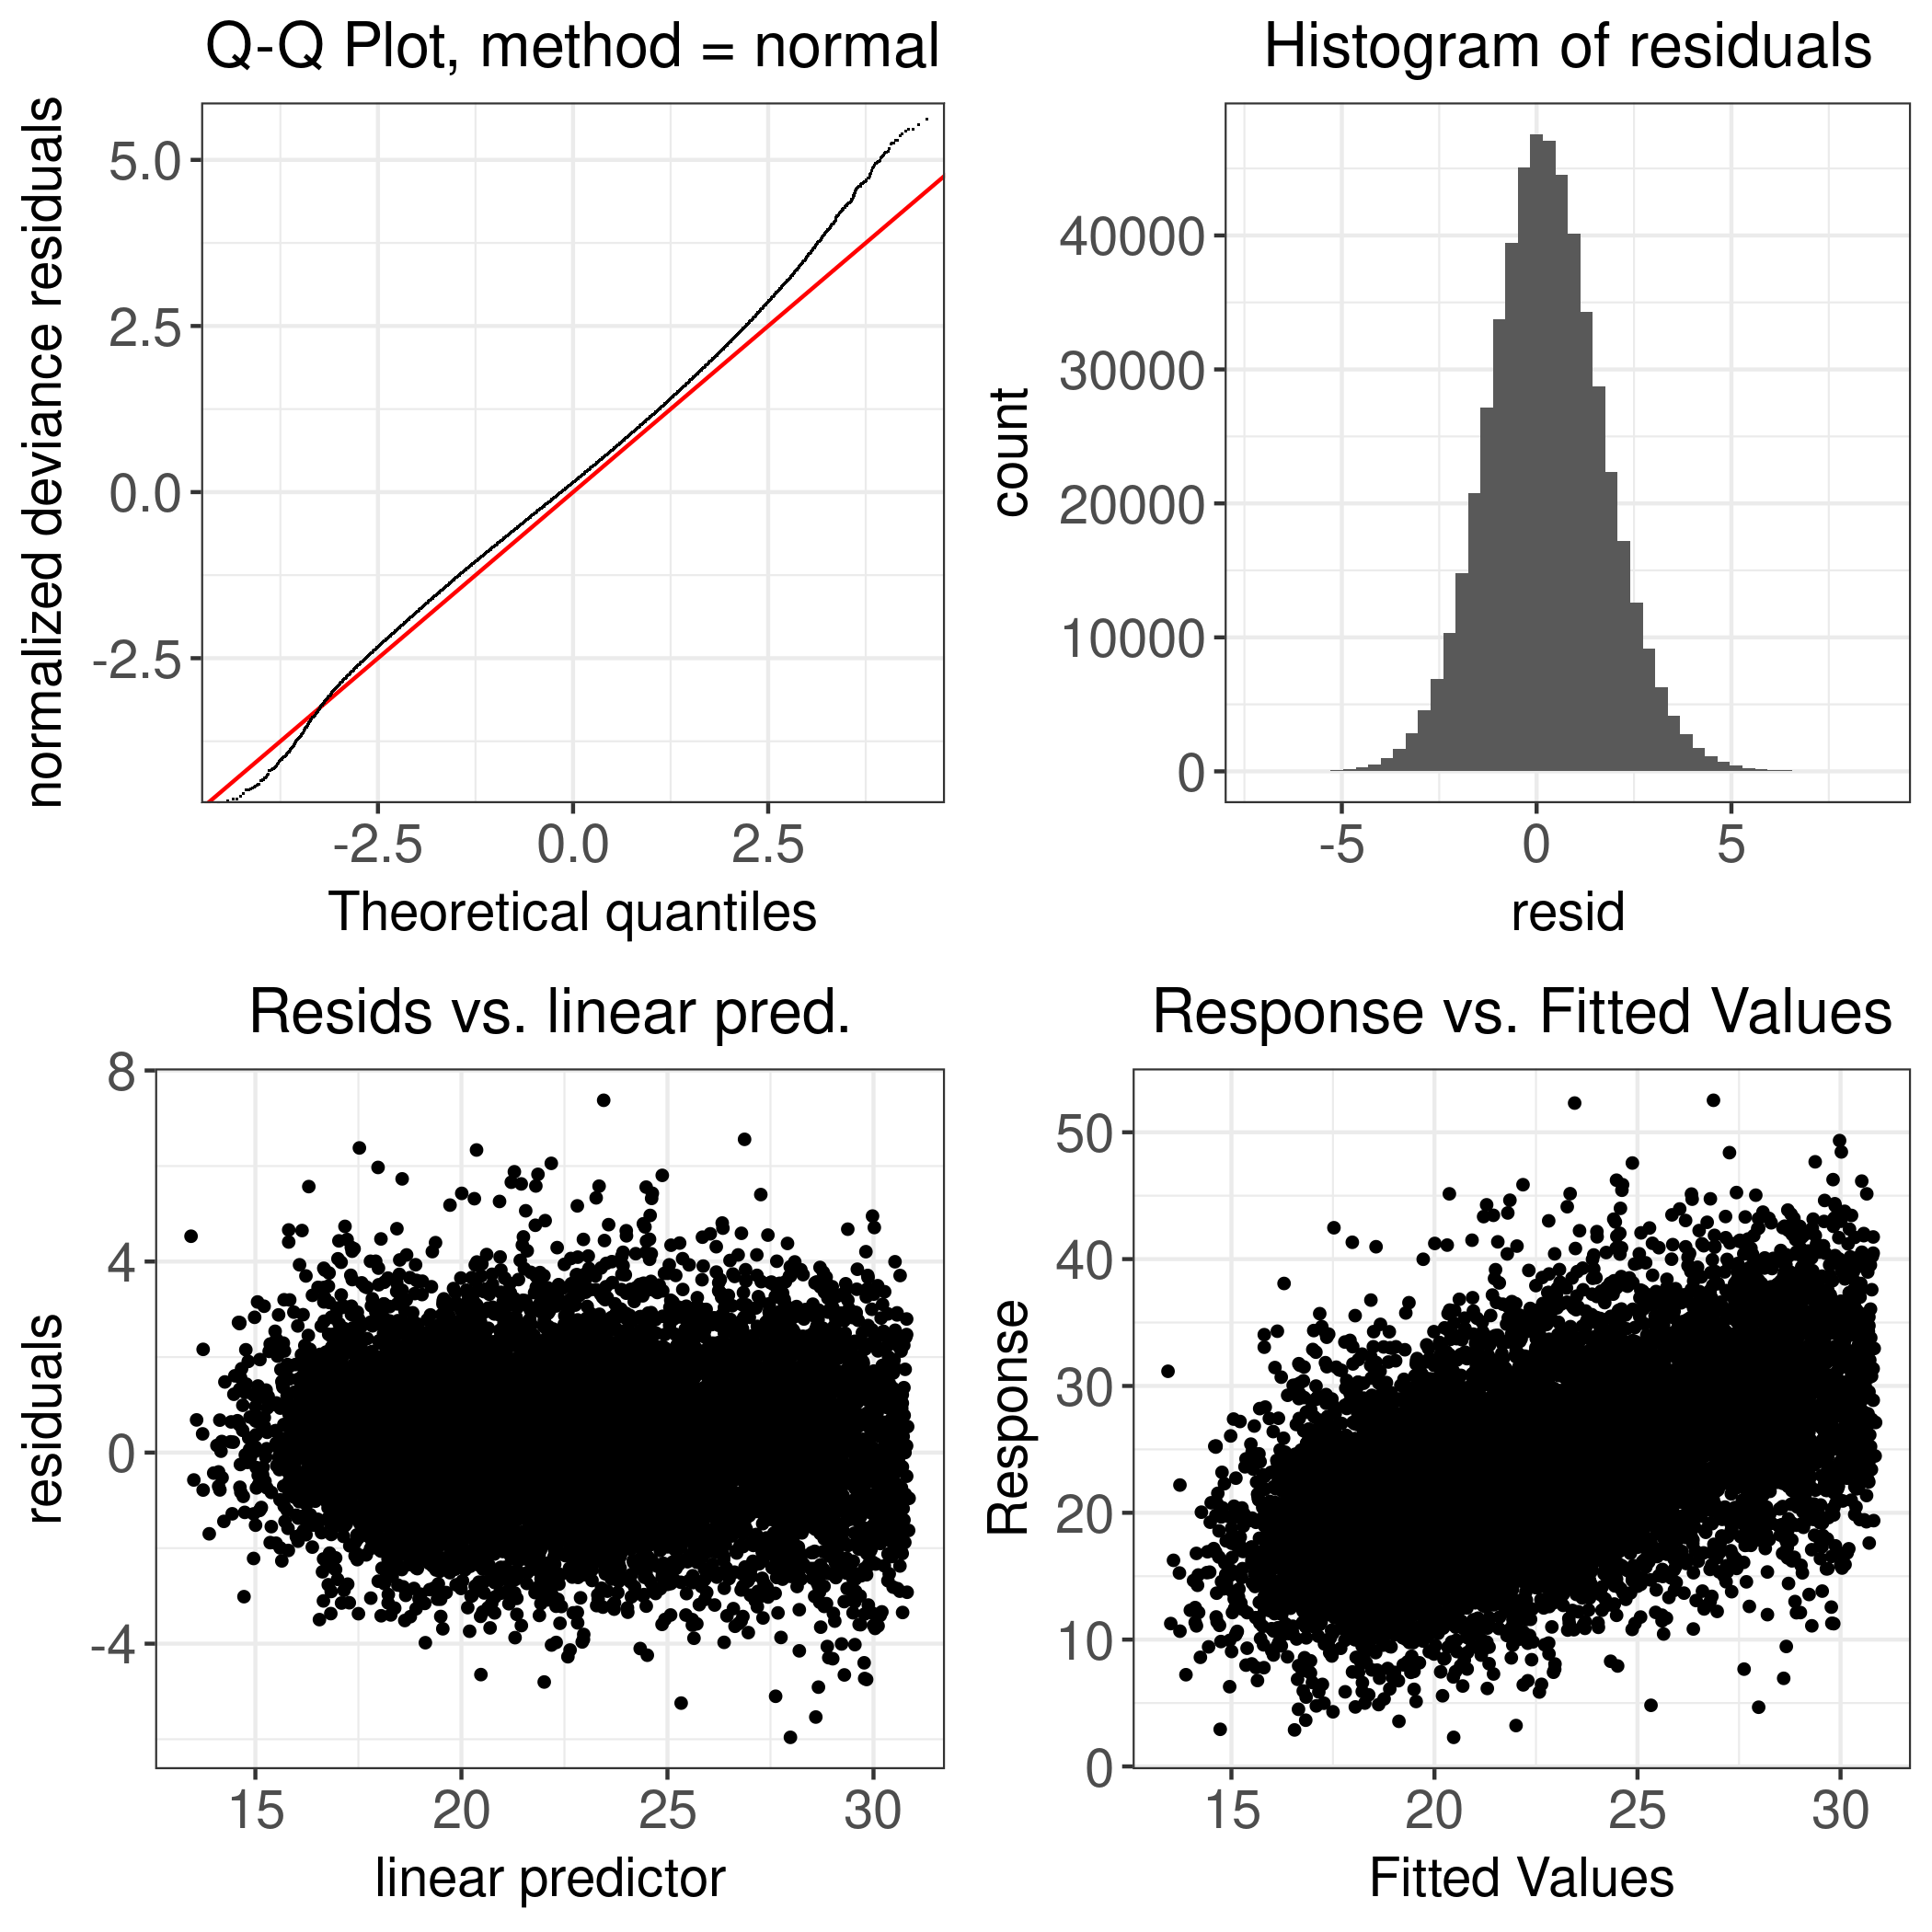
Model Diagnostics
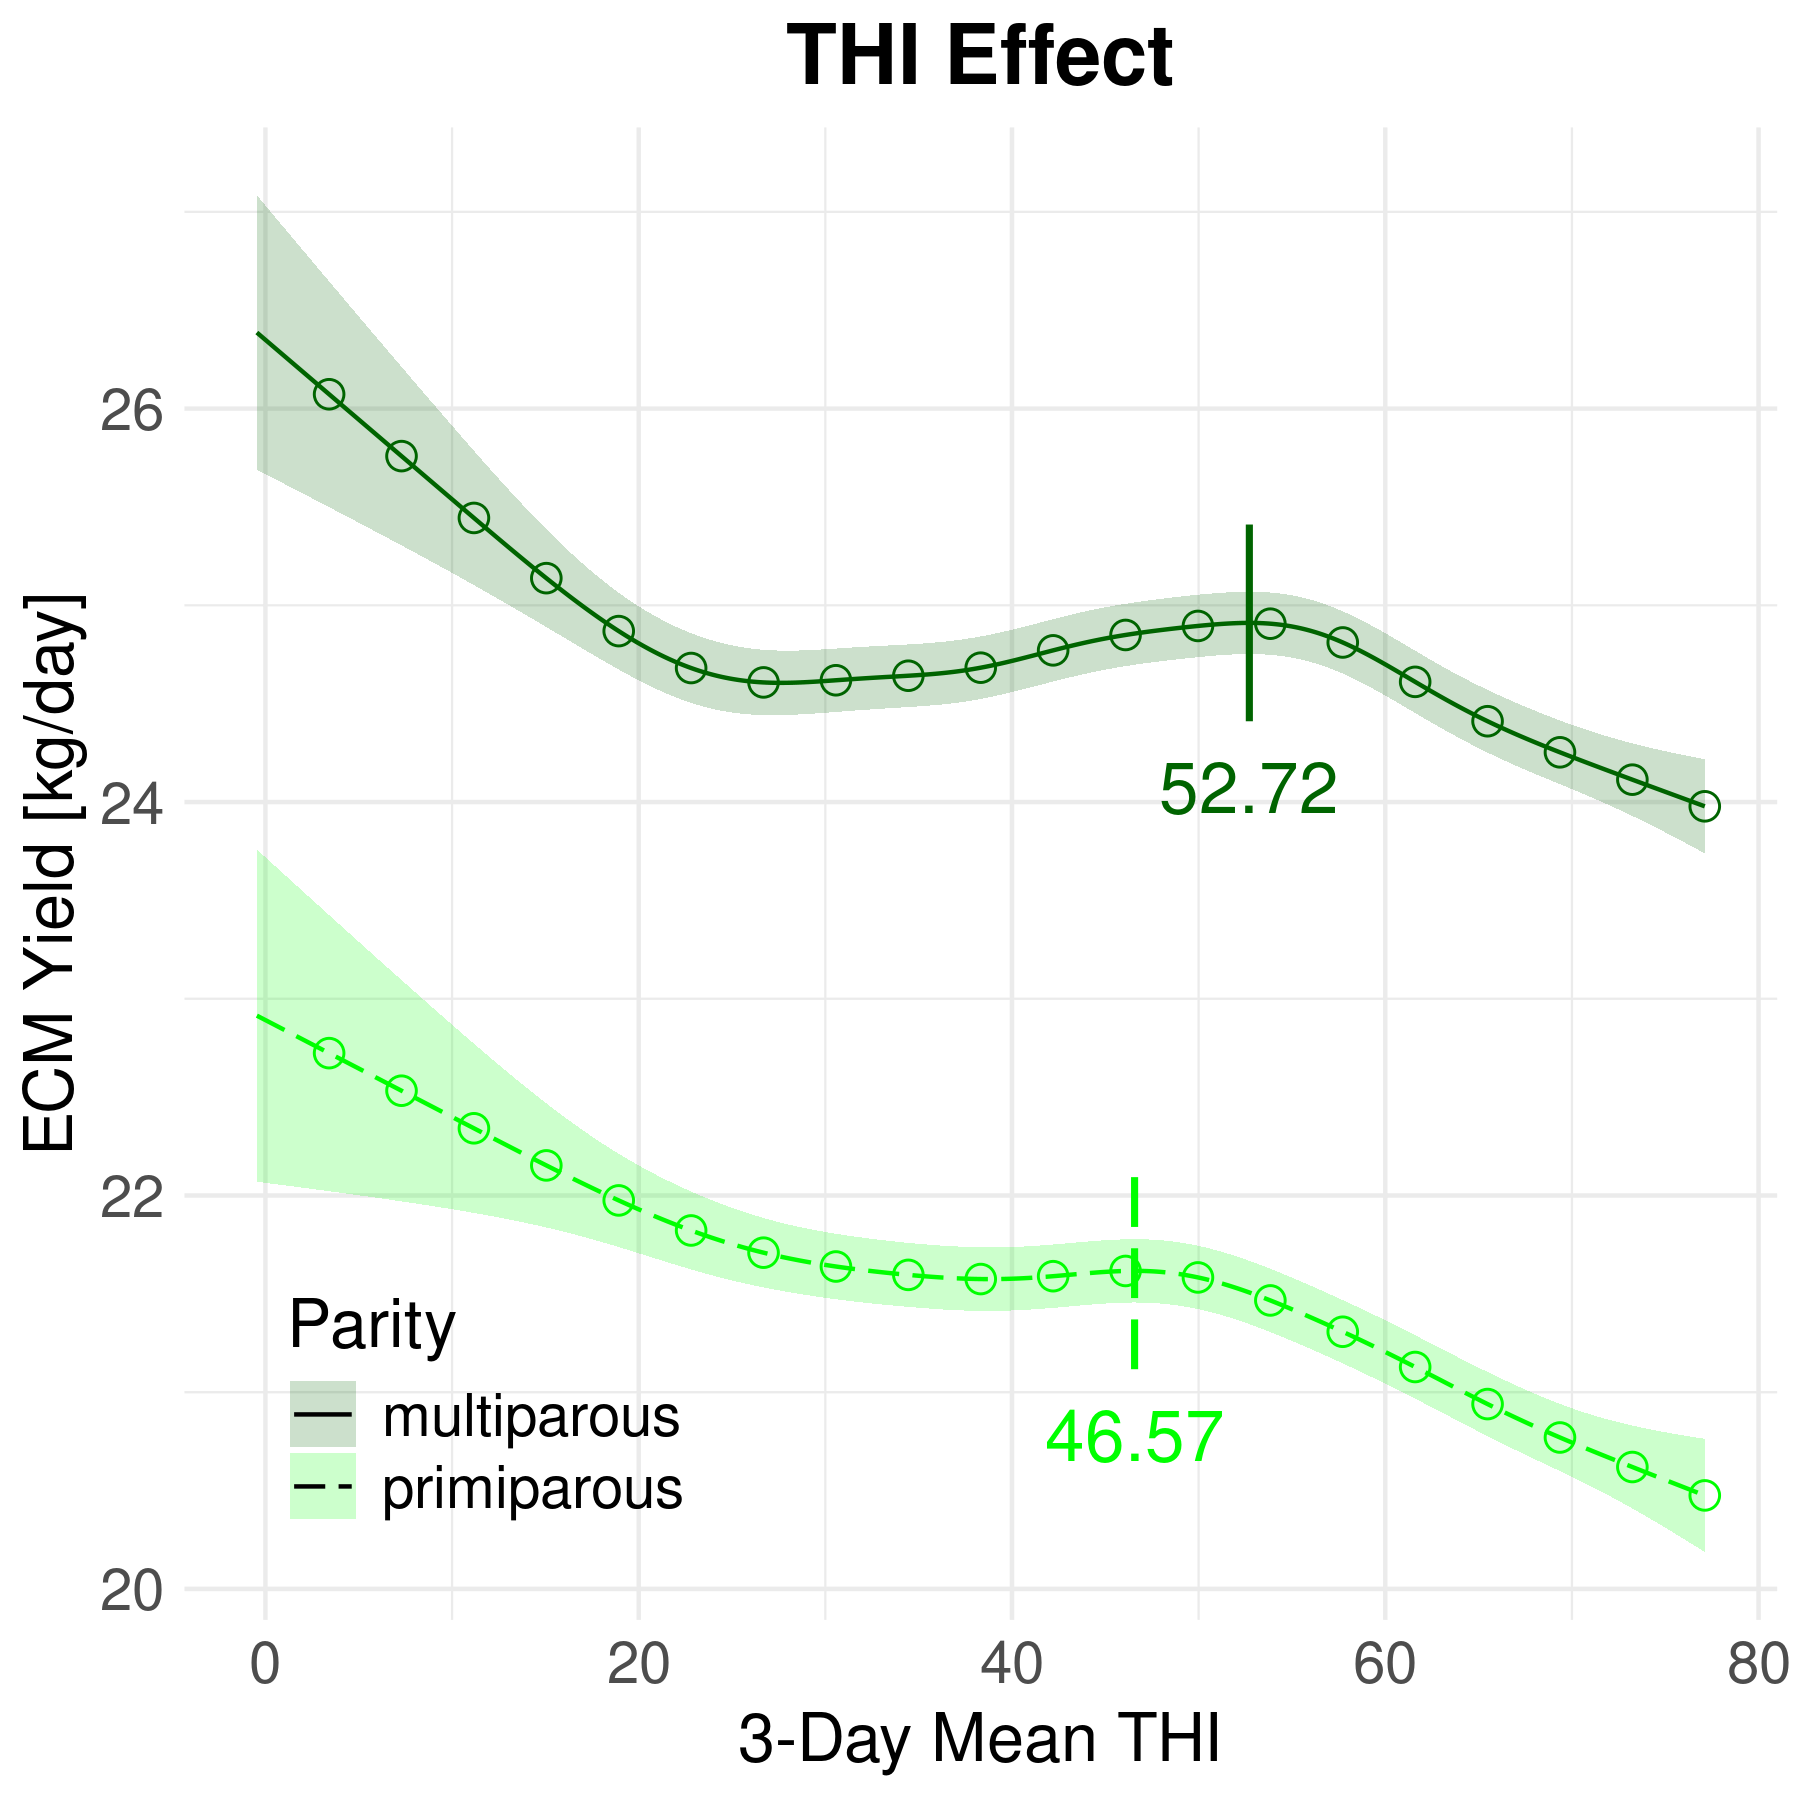
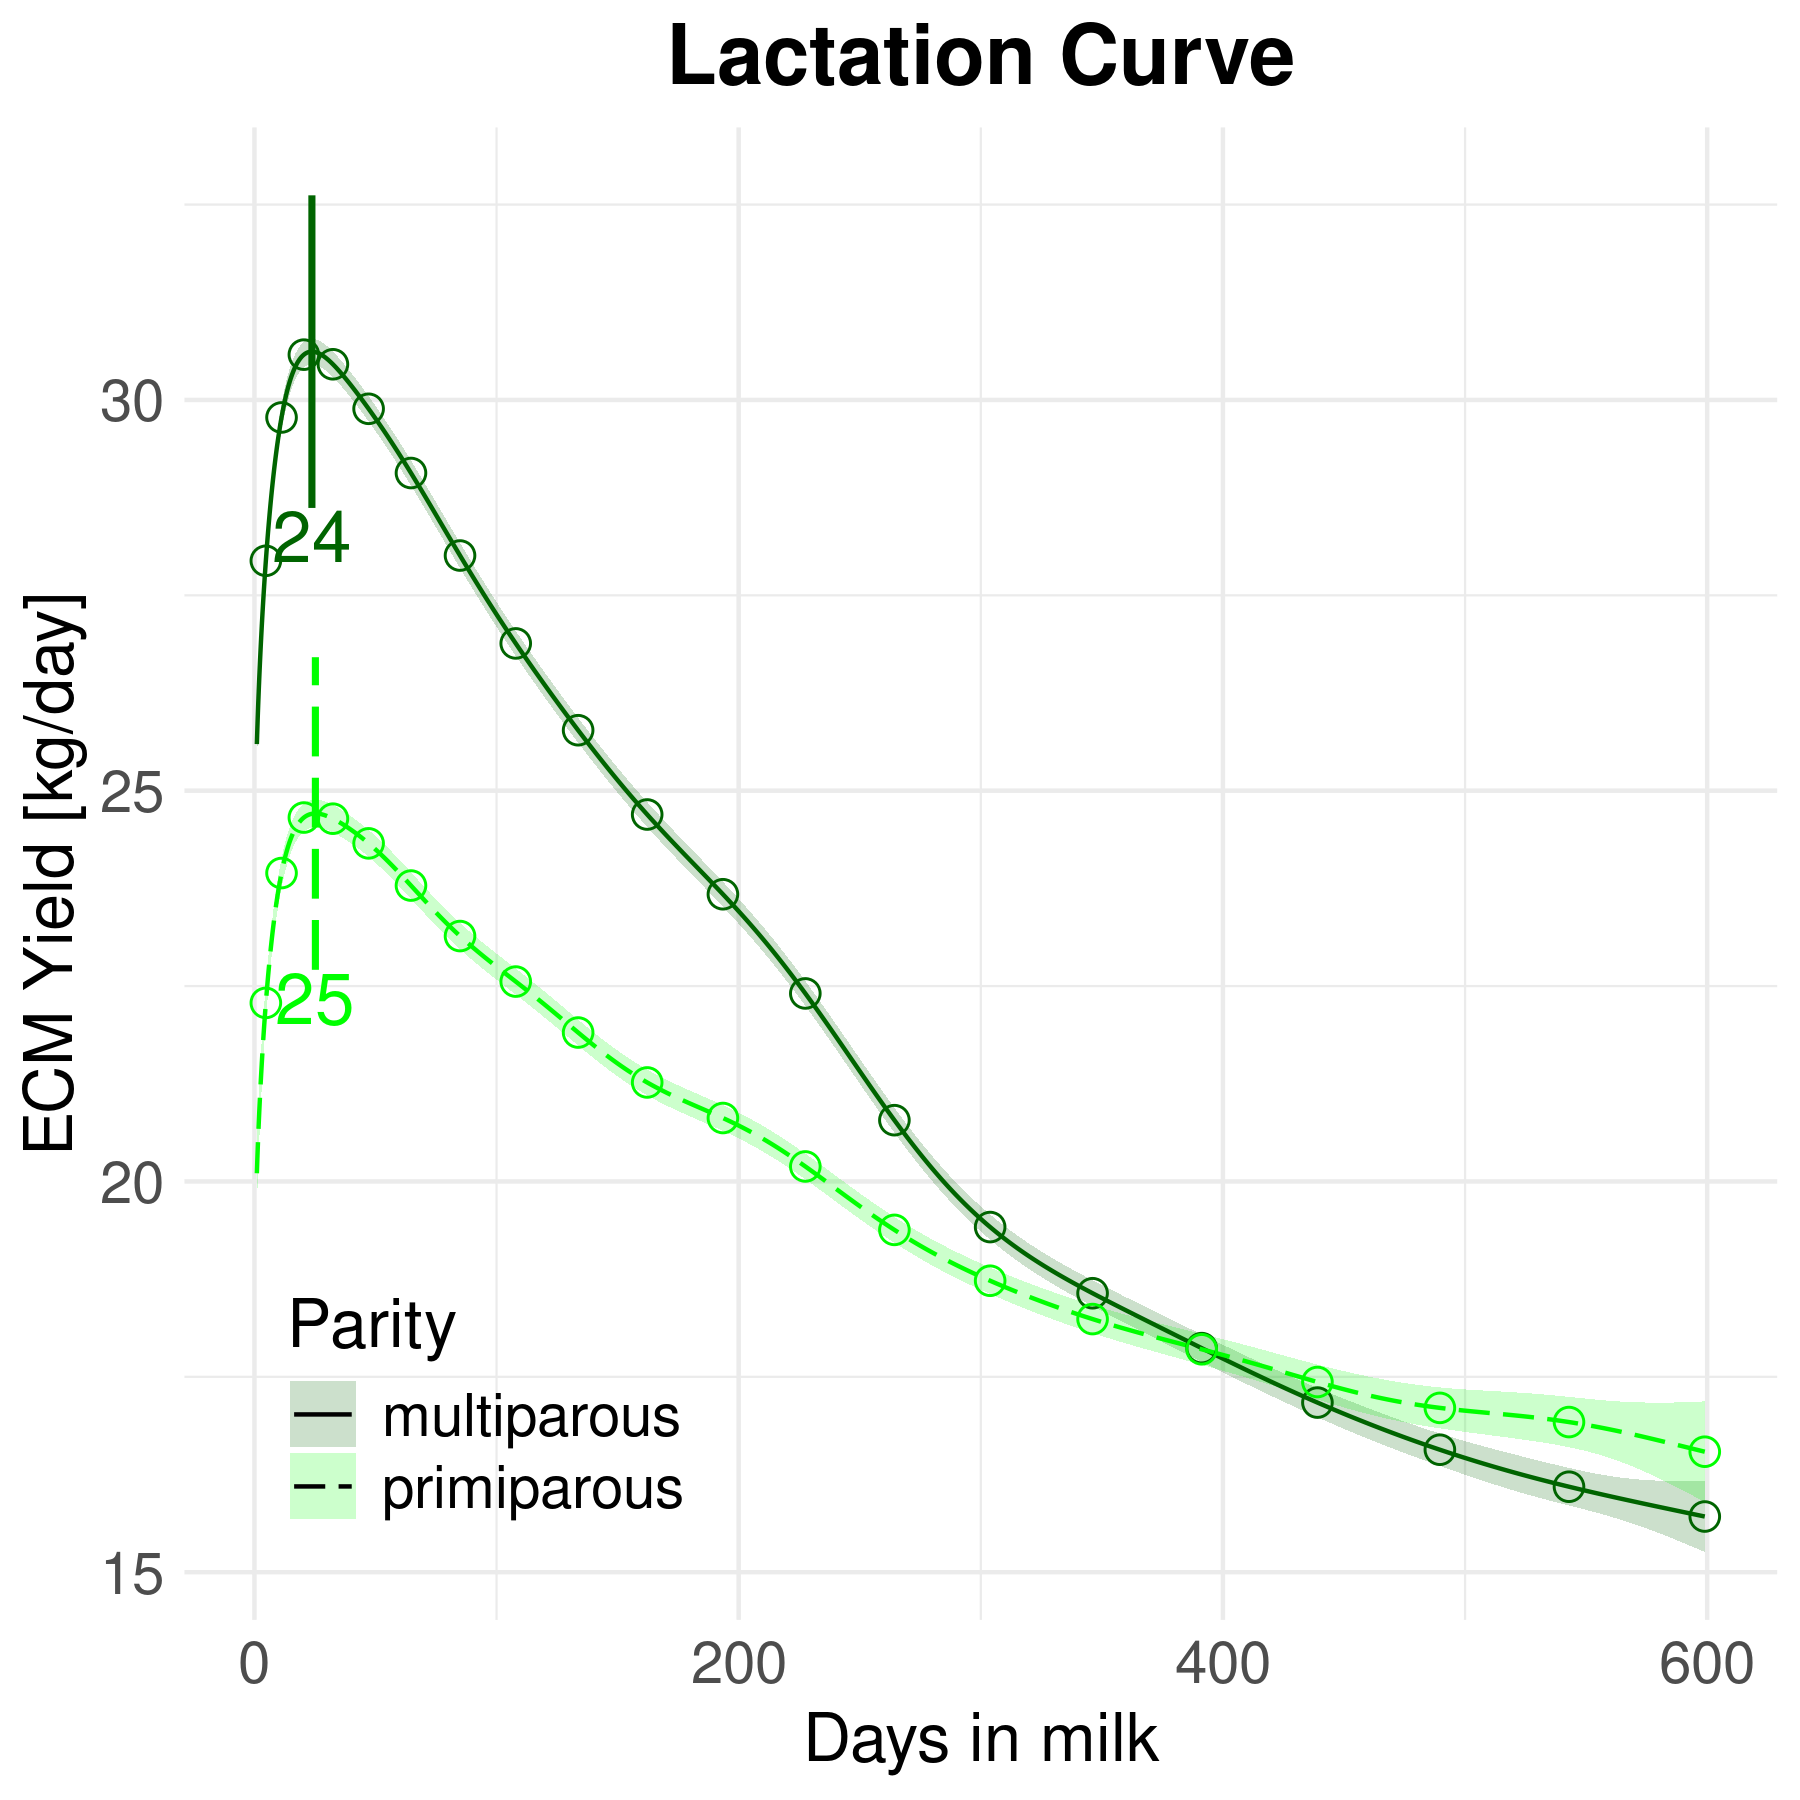
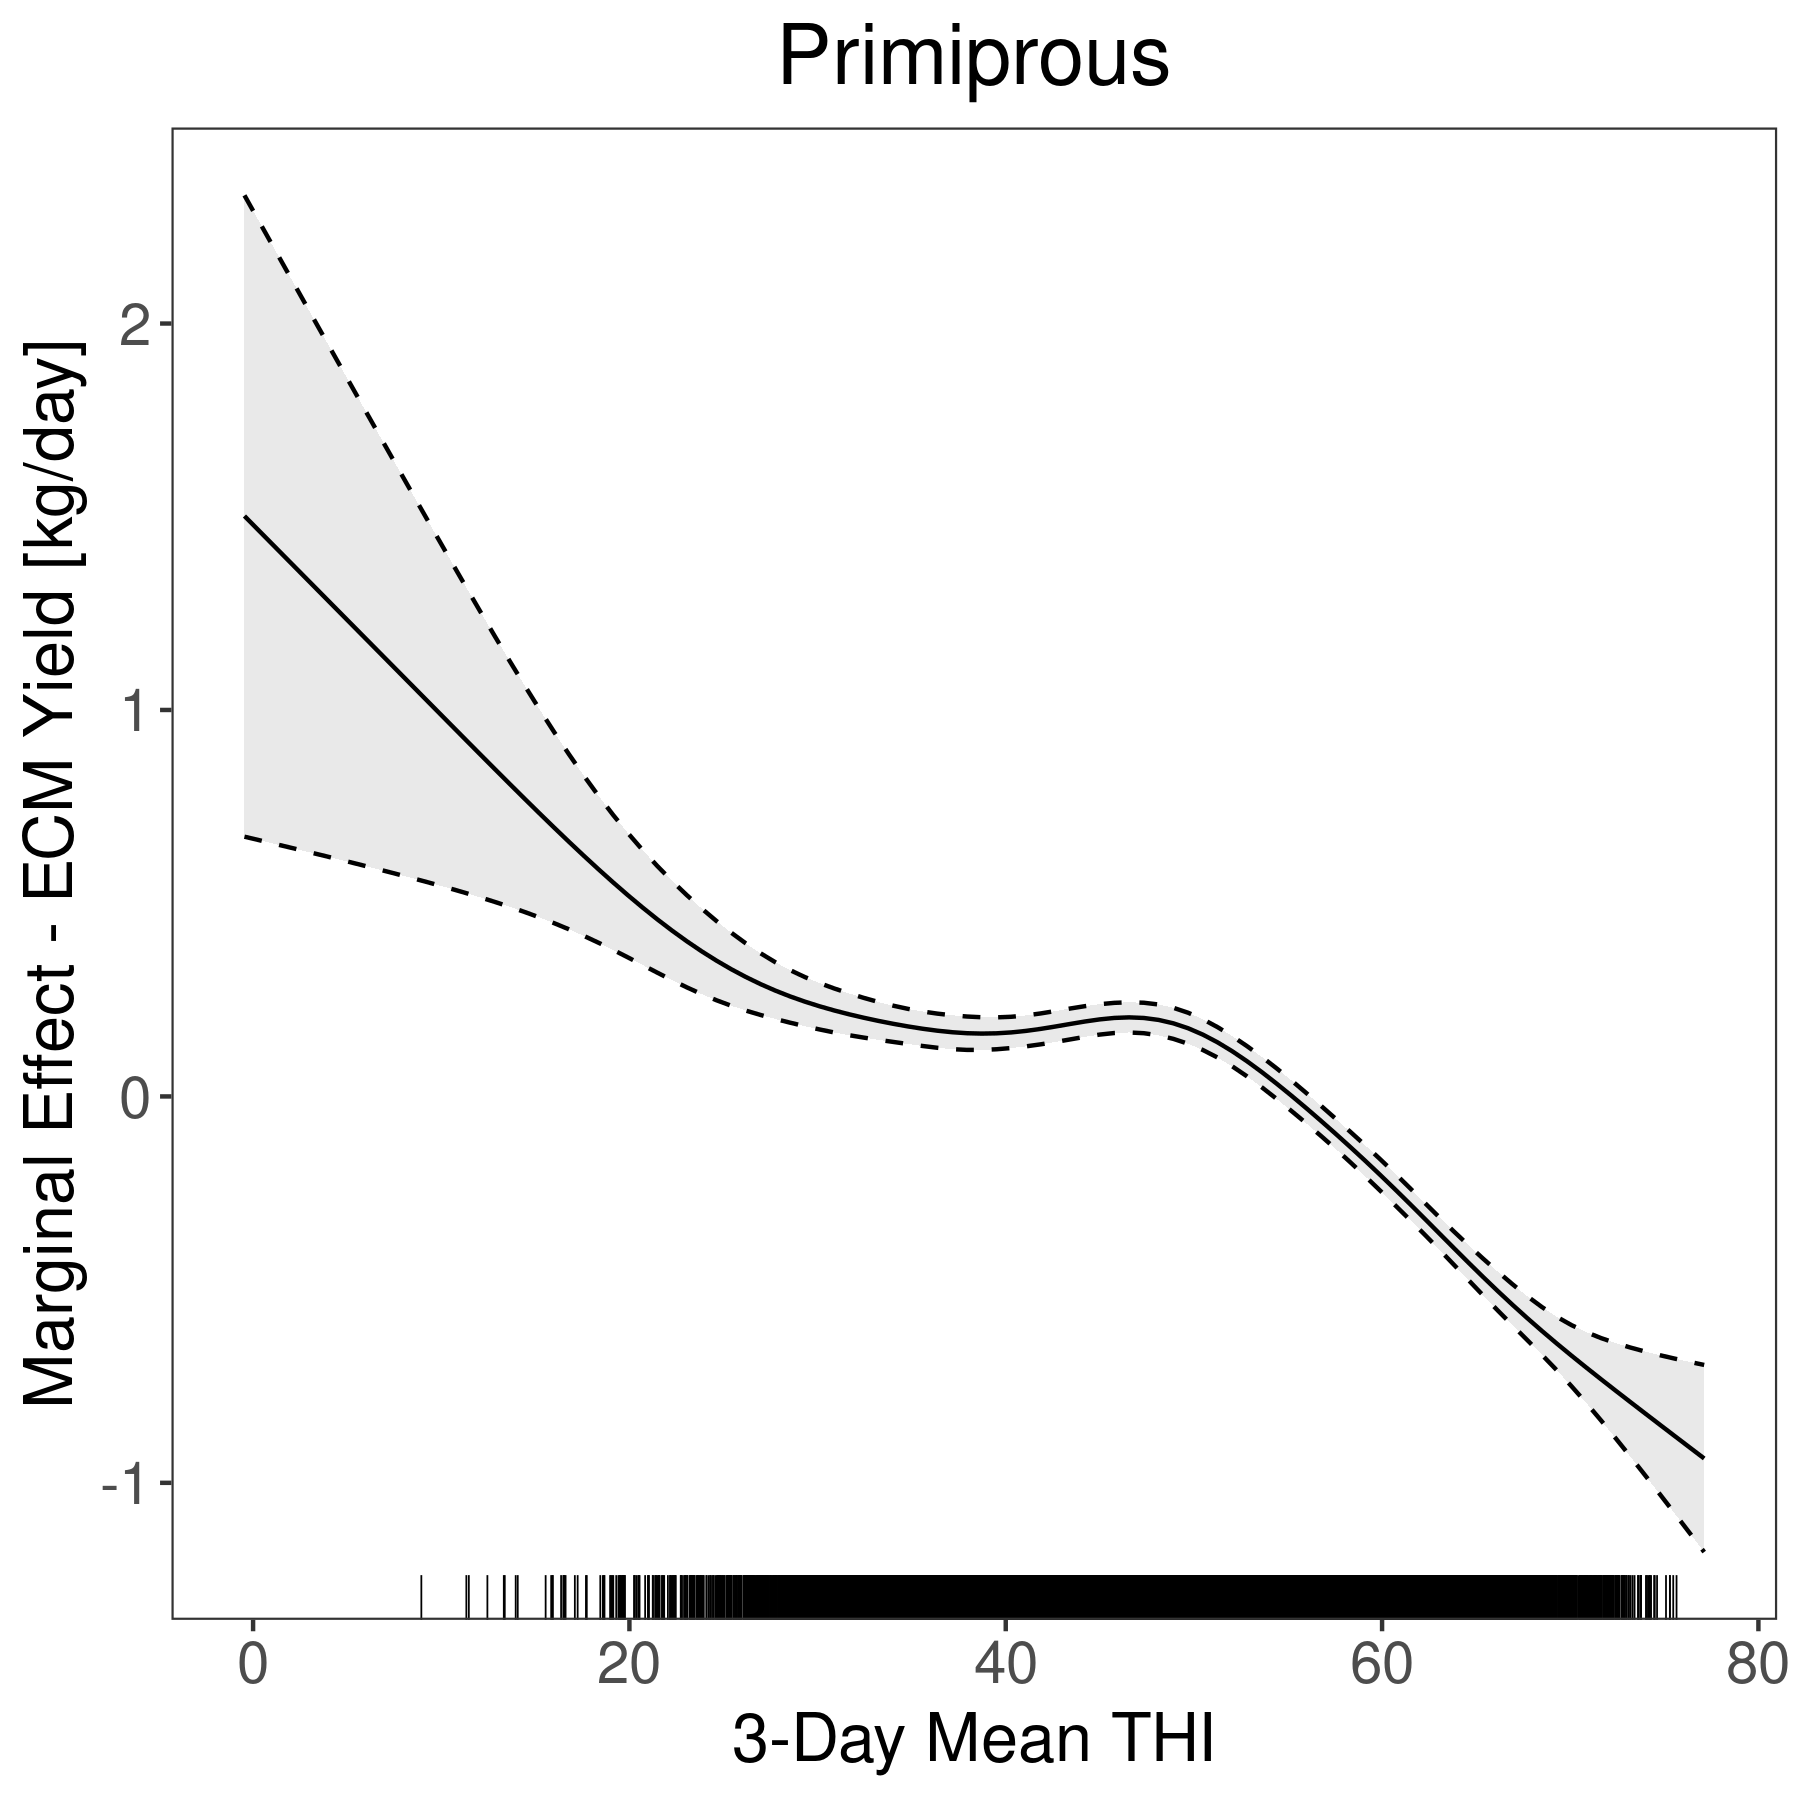
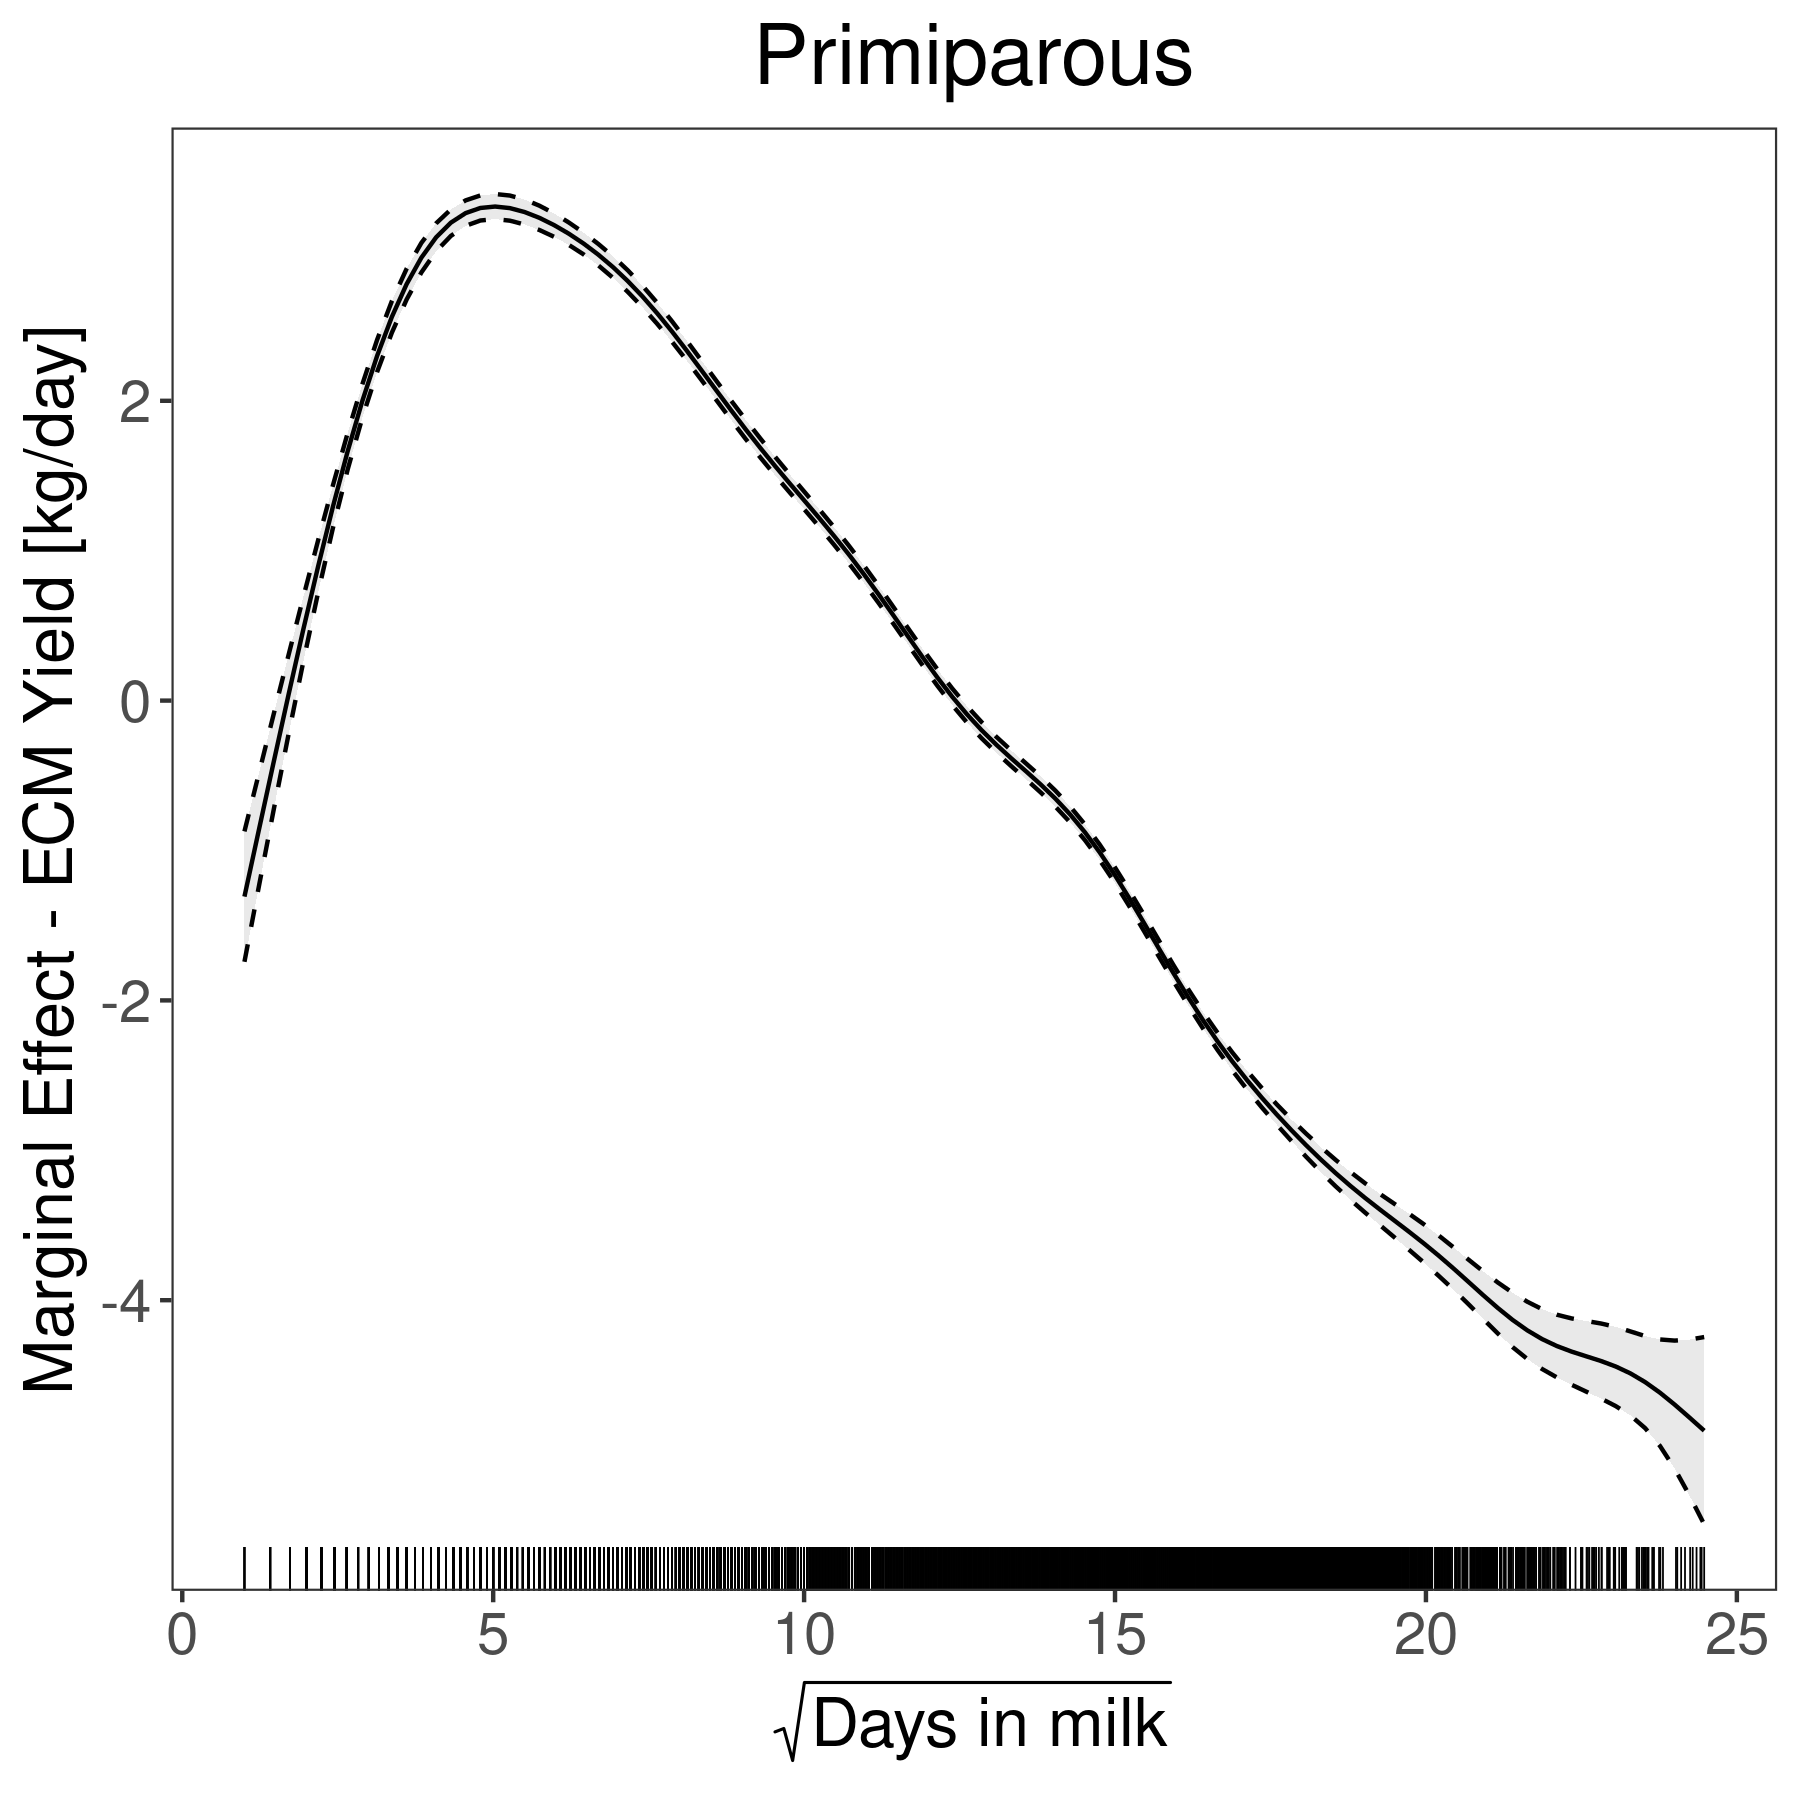
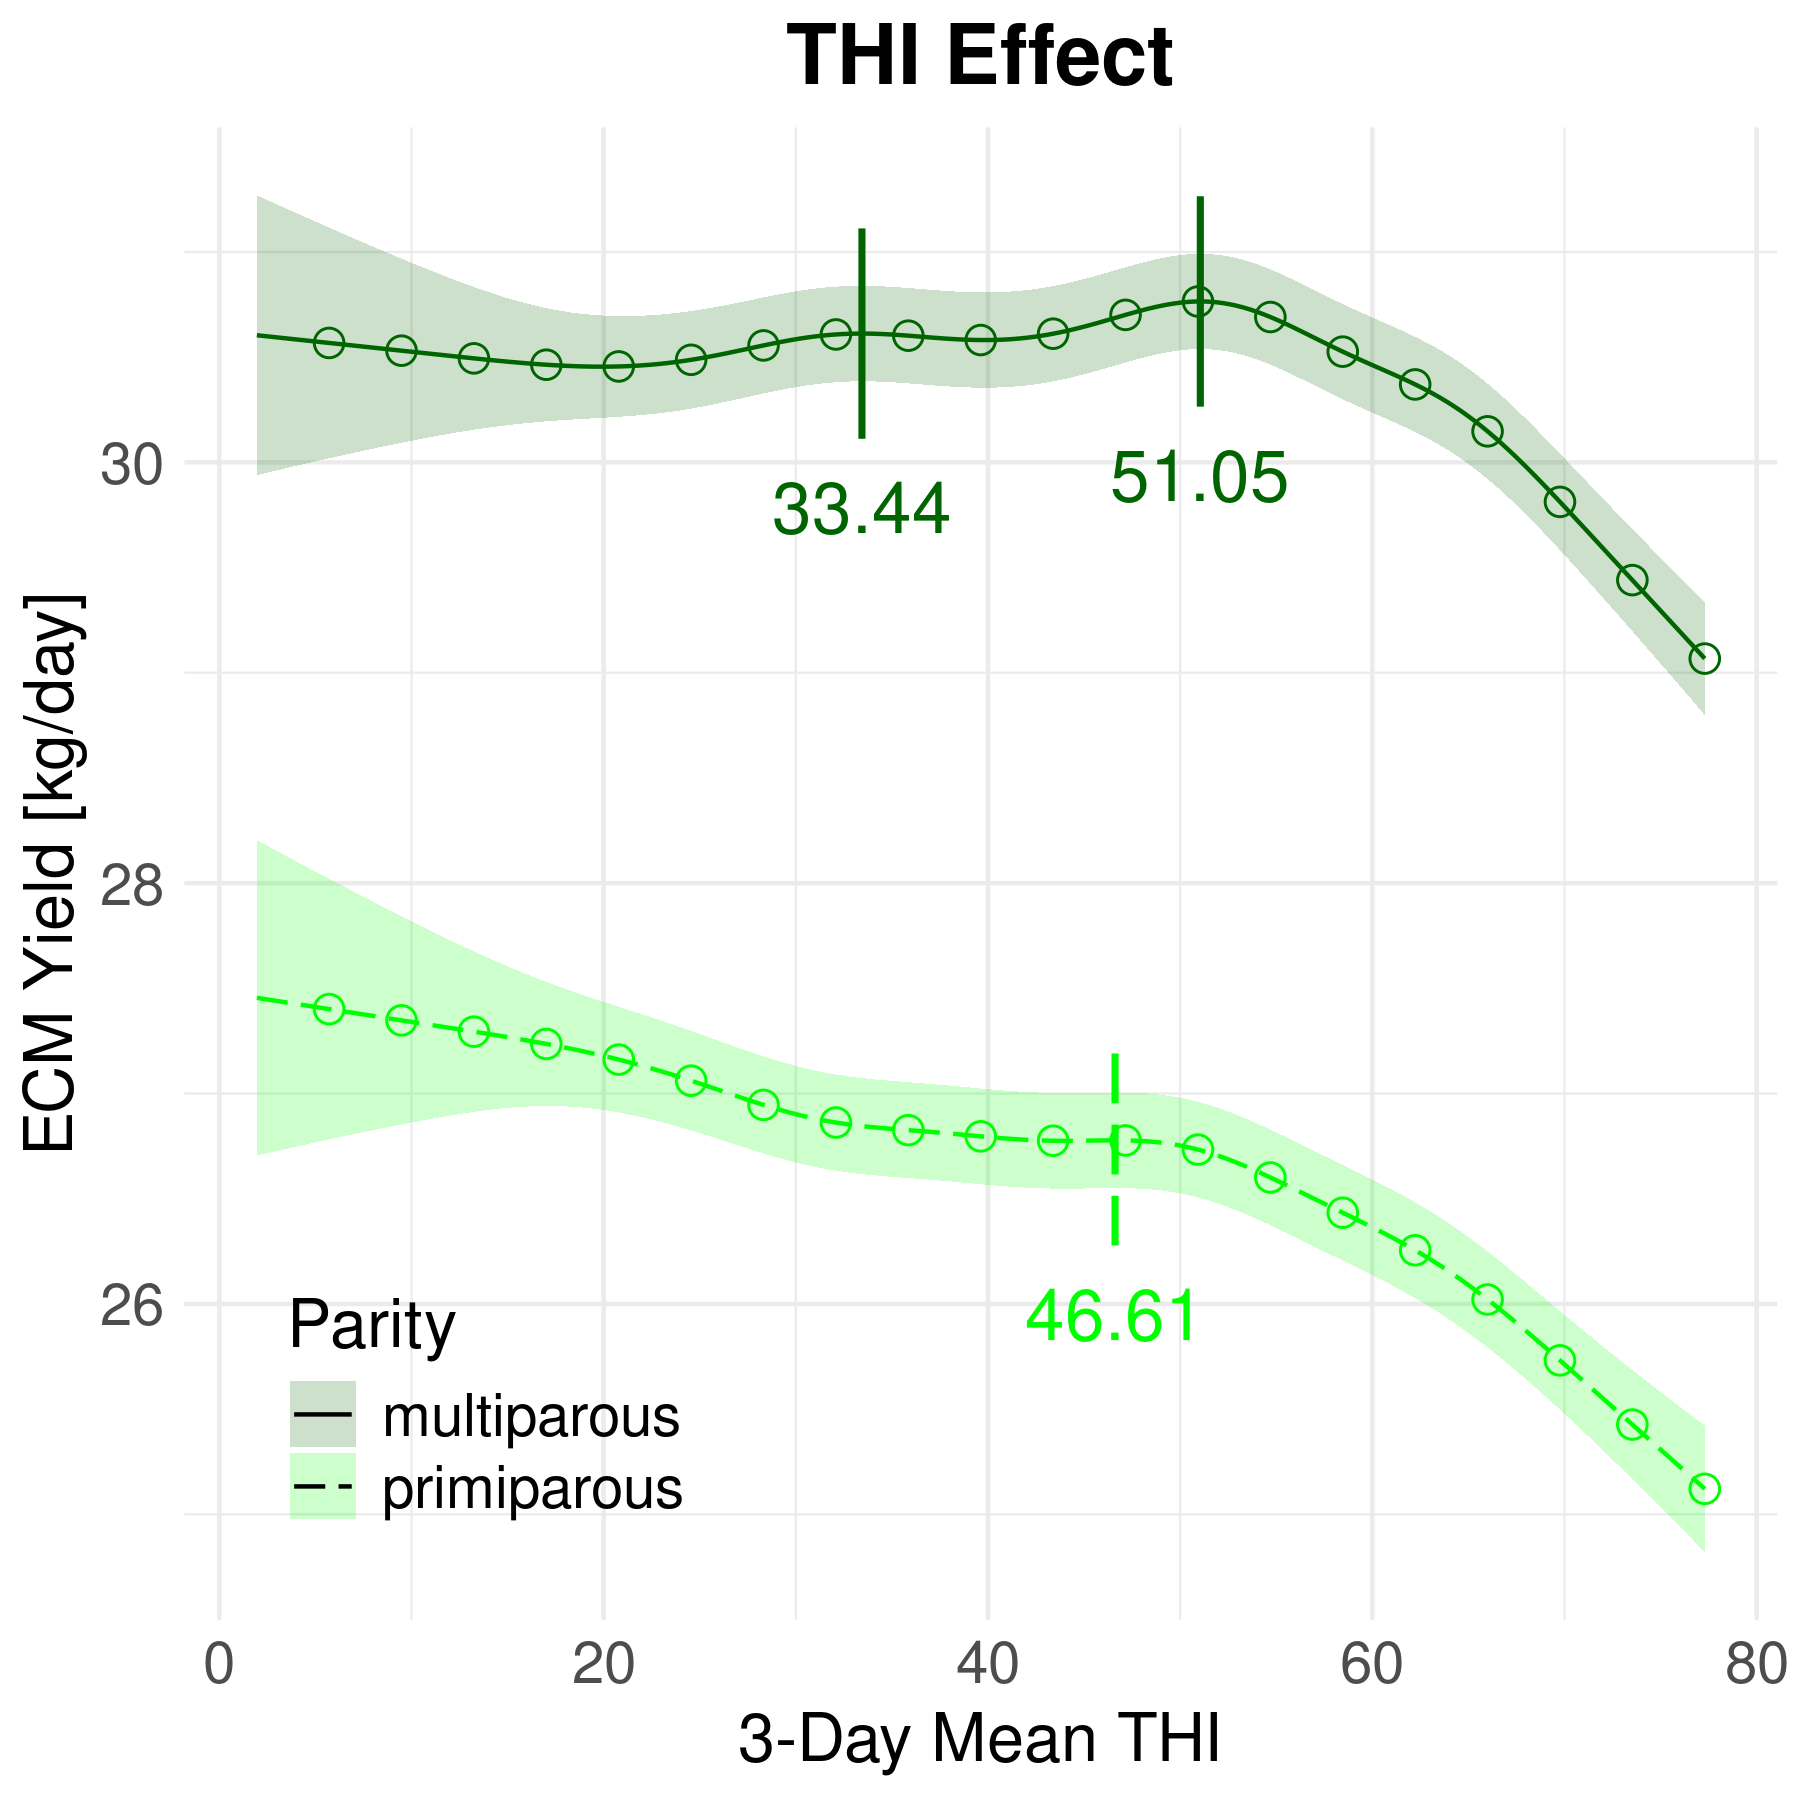
THI Effect and Lactation Curve
D.12.2: Split Period: Until 2010 - After 2010
D.12.2.1: Split Period: 1998 - 2010
Model Summary
| A. parametric coefficients | Estimate | Std. Error | t-value | p-value |
|---|---|---|---|---|
| (Intercept) | 18.2669 | 0.7578 | 24.1067 | \(< 0.0001\) |
| parityprimiparous | -2.5939 | 0.0256 | -101.3950 | \(< 0.0001\) |
| year1999 | -0.6468 | 0.8527 | -0.7586 | 0.4481 |
| year2000 | 0.2027 | 0.8311 | 0.2439 | 0.8073 |
| year2001 | 1.1265 | 0.8029 | 1.4030 | 0.1606 |
| year2002 | 1.8105 | 0.8042 | 2.2513 | 0.0244 |
| year2003 | 2.3125 | 0.7949 | 2.9093 | 0.0036 |
| year2004 | 3.0193 | 0.7861 | 3.8407 | 0.0001 |
| year2005 | 3.4202 | 0.7798 | 4.3858 | \(< 0.0001\) |
| year2006 | 3.6439 | 0.7756 | 4.6983 | \(< 0.0001\) |
| year2007 | 3.5288 | 0.7748 | 4.5543 | \(< 0.0001\) |
| year2008 | 4.0872 | 0.7753 | 5.2718 | \(< 0.0001\) |
| year2009 | 4.4202 | 0.7742 | 5.7095 | \(< 0.0001\) |
| year2010 | 4.8513 | 0.7709 | 6.2932 | \(< 0.0001\) |
| B. smooth terms | edf | Ref.df | F-value | p-value |
|---|---|---|---|---|
| s(thi_mean_t0_3d):paritymultiparous | 6.7718 | 6.7718 | 42.2573 | \(< 0.0001\) |
| s(thi_mean_t0_3d):parityprimiparous | 4.9785 | 4.9785 | 51.3939 | \(< 0.0001\) |
| s(days_in_milk_t):paritymultiparous | 12.8146 | 12.8146 | 11531.2301 | \(< 0.0001\) |
| s(days_in_milk_t):parityprimiparous | 11.8206 | 11.8206 | 1844.1937 | \(< 0.0001\) |
| Smooth Term Fixed Effect | Est. | SE | z | p |
|---|---|---|---|---|
| s(thi_mean_t0_3d):multiFx1 | 0.556587 | 0.166586 | 3.34 | 0.0008 |
| s(thi_mean_t0_3d):primiFx1 | 0.399362 | 0.171063 | 2.33 | 0.0196 |
| s(days_in_milk_):multiFx1 | 3.05618 | 0.696401 | 4.39 | \(< 1e-04\) |
| s(days_in_milk_):primiFx1 | 2.77329 | 0.788521 | 3.52 | 0.0004 |
| Variance Component | Estimated \( \sigma \) | |||
|---|---|---|---|---|
| \( \sigma_\alpha\) | 2.53036 | |||
| \( \sigma_\iota\) | 1.11190 | |||
| \( \sigma_\phi\) | 3.27697 | |||
| s(thi_mean_t0_3d):multi | 1.72458 | |||
| s(days_in_milk_):primi | 6.95605 | |||
| s(days_in_milk_):multi | 8.30984 | |||
| s(thi_mean_t0_3d):primi | 1.22781 | |||
| Residual | 3.49403 |
Model Diagnostics
THI Effect and Lactation Curve
D.12.2.2: Split Period: 2010 - 2023
Model Summary
| A. parametric coefficients | Estimate | Std. Error | t-value | p-value |
|---|---|---|---|---|
| (Intercept) | 21.9720 | 0.1946 | 112.8937 | \(< 0.0001\) |
| parityprimiparous | -3.2946 | 0.0213 | -154.9018 | \(< 0.0001\) |
| year2012 | 0.2540 | 0.2259 | 1.1242 | 0.2609 |
| year2013 | 0.2118 | 0.2609 | 0.8118 | 0.4169 |
| year2014 | 0.8891 | 0.2536 | 3.5061 | 0.0005 |
| year2015 | 0.9643 | 0.2528 | 3.8138 | 0.0001 |
| year2016 | 1.2941 | 0.2389 | 5.4180 | \(< 0.0001\) |
| year2017 | 1.6423 | 0.2463 | 6.6682 | \(< 0.0001\) |
| year2018 | 2.0143 | 0.2347 | 8.5841 | \(< 0.0001\) |
| year2019 | 2.4266 | 0.2273 | 10.6763 | \(< 0.0001\) |
| year2020 | 2.7412 | 0.2476 | 11.0717 | \(< 0.0001\) |
| year2021 | 2.7795 | 0.2468 | 11.2643 | \(< 0.0001\) |
| year2022 | 2.5202 | 0.2486 | 10.1379 | \(< 0.0001\) |
| year2023 | 2.7349 | 0.2213 | 12.3600 | \(< 0.0001\) |
| B. smooth terms | edf | Ref.df | F-value | p-value |
|---|---|---|---|---|
| s(thi_mean_t0_3d):paritymultiparous | 7.8183 | 7.8183 | 101.7990 | \(< 0.0001\) |
| s(thi_mean_t0_3d):parityprimiparous | 5.9748 | 5.9748 | 101.4406 | \(< 0.0001\) |
| s(days_in_milk_t):paritymultiparous | 13.4448 | 13.4448 | 25136.3559 | \(< 0.0001\) |
| s(days_in_milk_t):parityprimiparous | 12.6212 | 12.6212 | 2246.7077 | \(< 0.0001\) |
| Smooth Term Fixed Effect | Est. | SE | z | p |
|---|---|---|---|---|
| s(thi_mean_t0_3d):multiFx1 | -0.690297 | 0.130414 | -5.29 | \(< 1e-06\) |
| s(thi_mean_t0_3d):primiFx1 | -0.514106 | 0.148913 | -3.45 | 0.0006 |
| s(days_in_milk_):multiFx1 | 3.86596 | 0.476176 | 8.12 | \(< 1e-15\) |
| s(days_in_milk_):primiFx1 | 3.43391 | 0.653845 | 5.25 | \(< 1e-06\) |
| Variance Component | Estimated \( \sigma \) | |||
|---|---|---|---|---|
| \( \sigma_\alpha\) | 2.60104 | |||
| \( \sigma_\iota\) | 1.16946 | |||
| \( \sigma_\phi\) | 3.90069 | |||
| s(thi_mean_t0_3d):multi | 2.10256 | |||
| s(days_in_milk_):primi | 7.40217 | |||
| s(days_in_milk_):multi | 8.58295 | |||
| s(thi_mean_t0_3d):primi | 1.46353 | |||
| Residual | 3.91111 |
Model Diagnostics
THI Effect and Lactation Curve