D.11 Jersey: Milk Yield
D.11.1: Full Period: 1998-2023
Model Summary
| A. parametric coefficients | Estimate | Std. Error | t-value | p-value |
|---|---|---|---|---|
| (Intercept) | 13.7621 | 0.7123 | 19.3200 | \(< 0.0001\) |
| parityprimiparous | -2.0196 | 0.0125 | -162.2099 | \(< 0.0001\) |
| year1999 | -0.5788 | 0.7821 | -0.7401 | 0.4592 |
| year2000 | 0.1706 | 0.7908 | 0.2158 | 0.8292 |
| year2001 | 0.6872 | 0.7611 | 0.9029 | 0.3666 |
| year2002 | 1.1345 | 0.7621 | 1.4886 | 0.1366 |
| year2003 | 1.6274 | 0.7688 | 2.1169 | 0.0343 |
| year2004 | 2.1381 | 0.7407 | 2.8868 | 0.0039 |
| year2005 | 2.3294 | 0.7283 | 3.1986 | 0.0014 |
| year2006 | 2.6162 | 0.7276 | 3.5957 | 0.0003 |
| year2007 | 2.4384 | 0.7239 | 3.3683 | 0.0008 |
| year2008 | 2.6780 | 0.7231 | 3.7037 | 0.0002 |
| year2009 | 2.9302 | 0.7281 | 4.0244 | \(< 0.0001\) |
| year2010 | 3.1502 | 0.7338 | 4.2930 | \(< 0.0001\) |
| year2011 | 3.3587 | 0.7275 | 4.6169 | \(< 0.0001\) |
| year2012 | 3.6206 | 0.7210 | 5.0218 | \(< 0.0001\) |
| year2013 | 3.6943 | 0.7185 | 5.1417 | \(< 0.0001\) |
| year2014 | 4.3000 | 0.7222 | 5.9540 | \(< 0.0001\) |
| year2015 | 4.4102 | 0.7209 | 6.1173 | \(< 0.0001\) |
| year2016 | 4.6309 | 0.7199 | 6.4324 | \(< 0.0001\) |
| year2017 | 5.0141 | 0.7237 | 6.9289 | \(< 0.0001\) |
| year2018 | 5.3353 | 0.7225 | 7.3848 | \(< 0.0001\) |
| year2019 | 5.6806 | 0.7183 | 7.9088 | \(< 0.0001\) |
| year2020 | 5.9019 | 0.7223 | 8.1711 | \(< 0.0001\) |
| year2021 | 5.9578 | 0.7225 | 8.2465 | \(< 0.0001\) |
| year2022 | 5.9243 | 0.7222 | 8.2033 | \(< 0.0001\) |
| year2023 | 6.0294 | 0.7156 | 8.4255 | \(< 0.0001\) |
| B. smooth terms | edf | Ref.df | F-value | p-value |
|---|---|---|---|---|
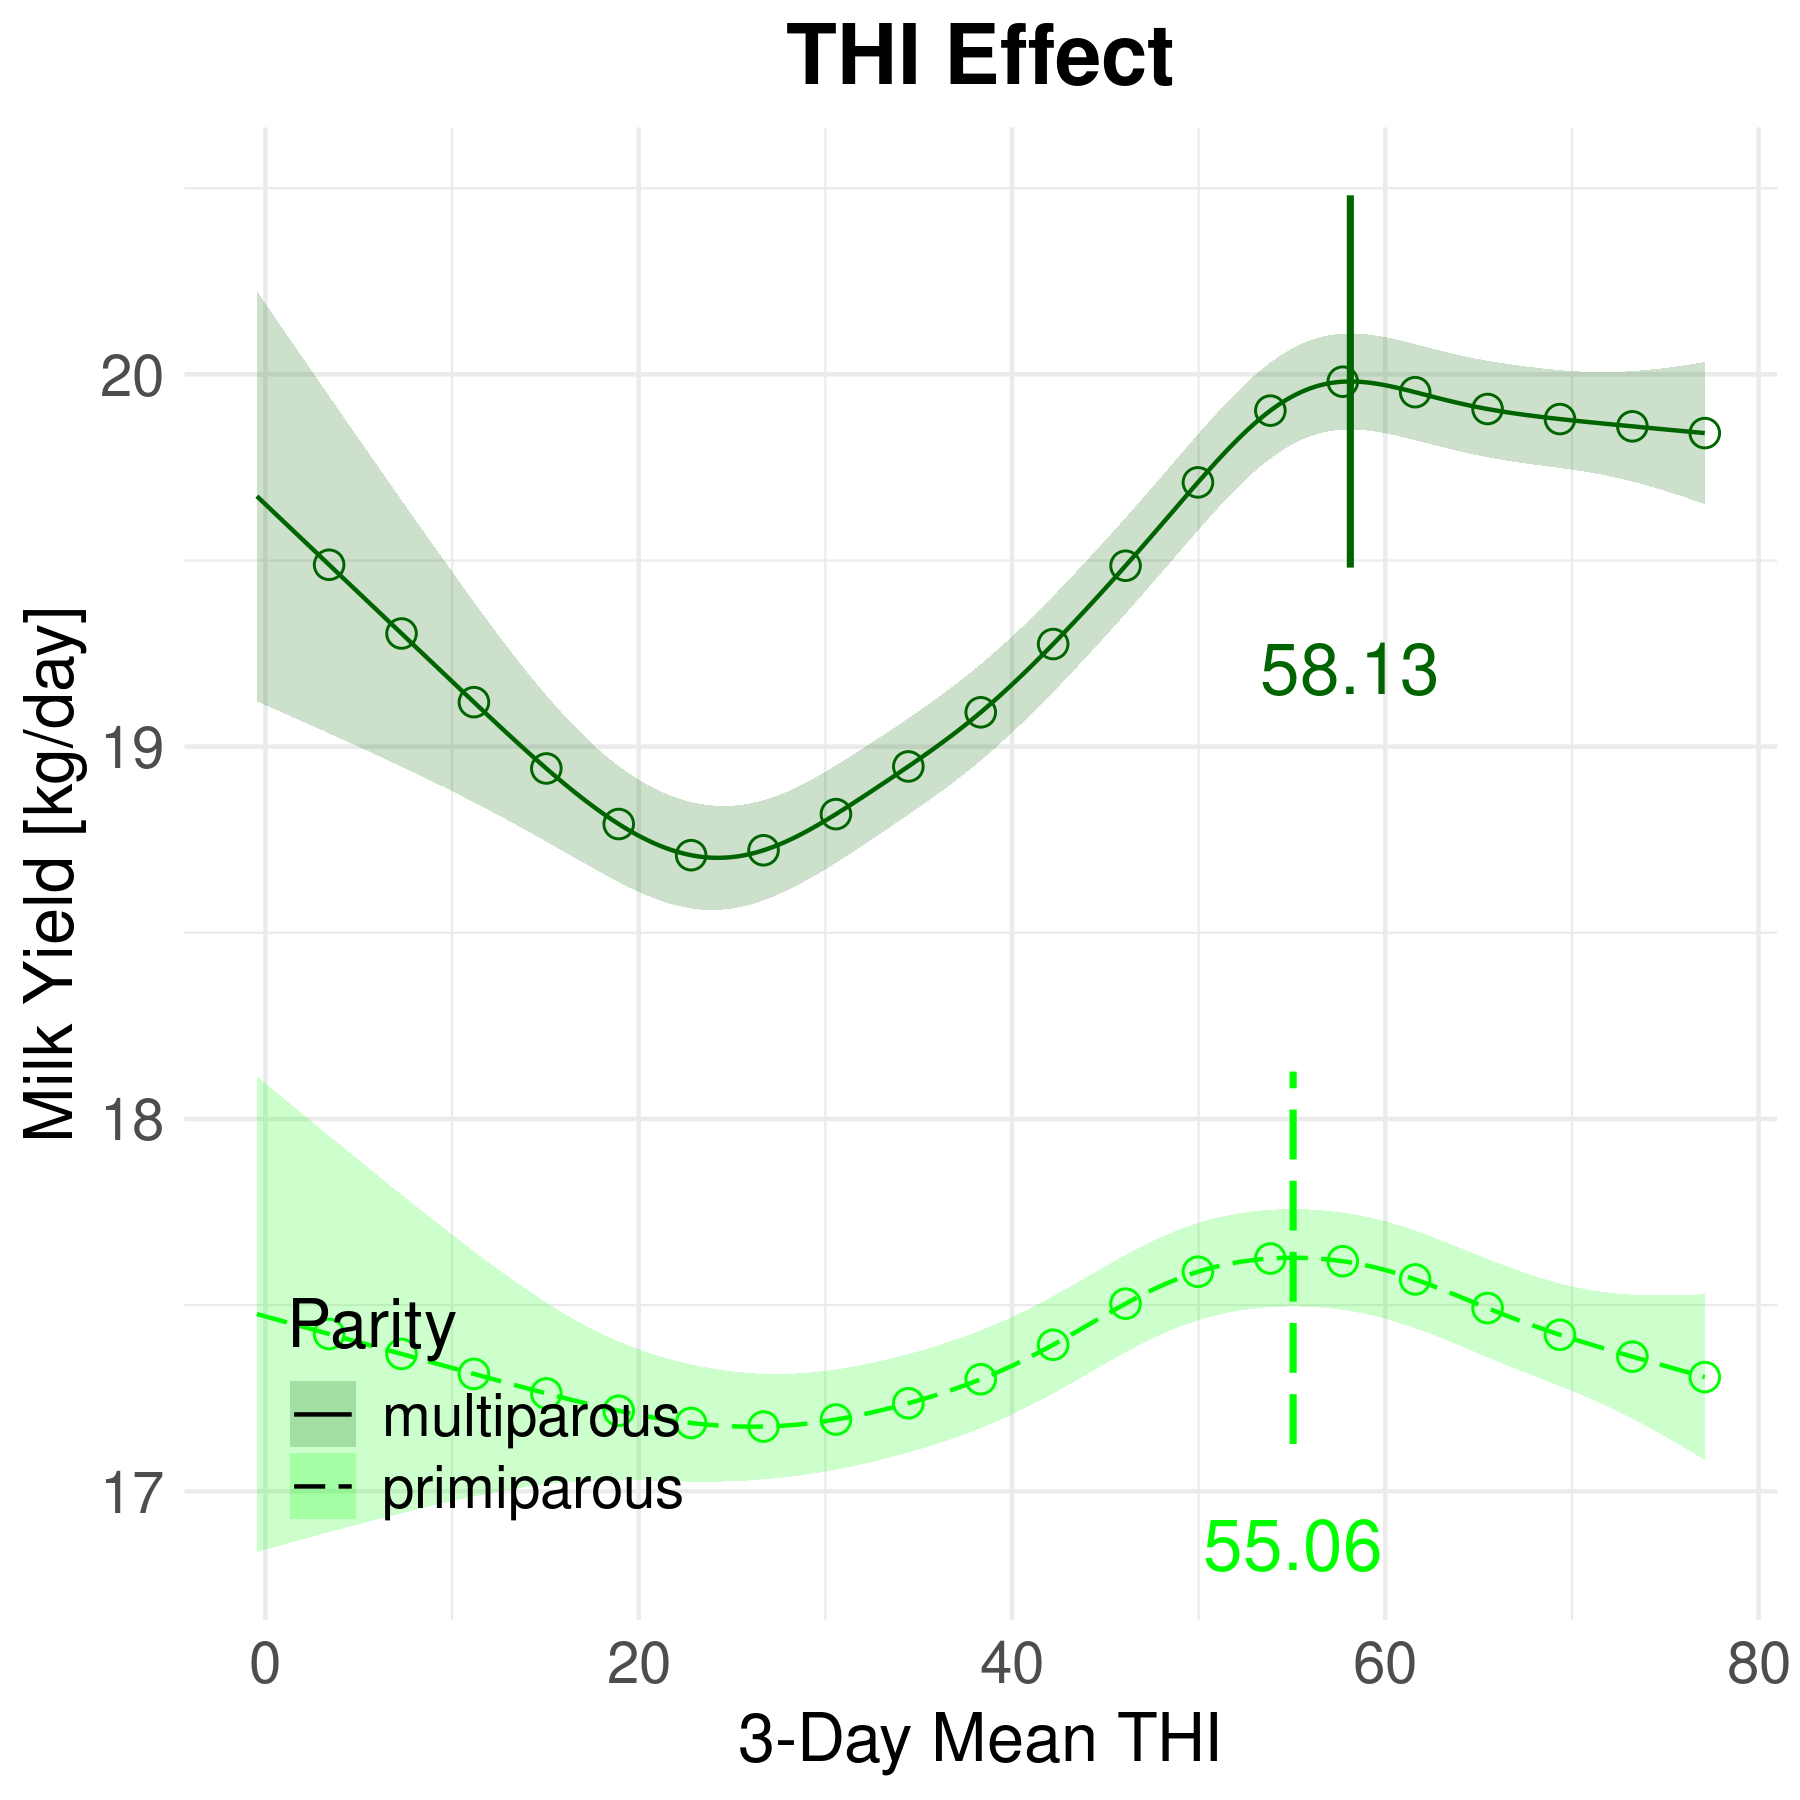
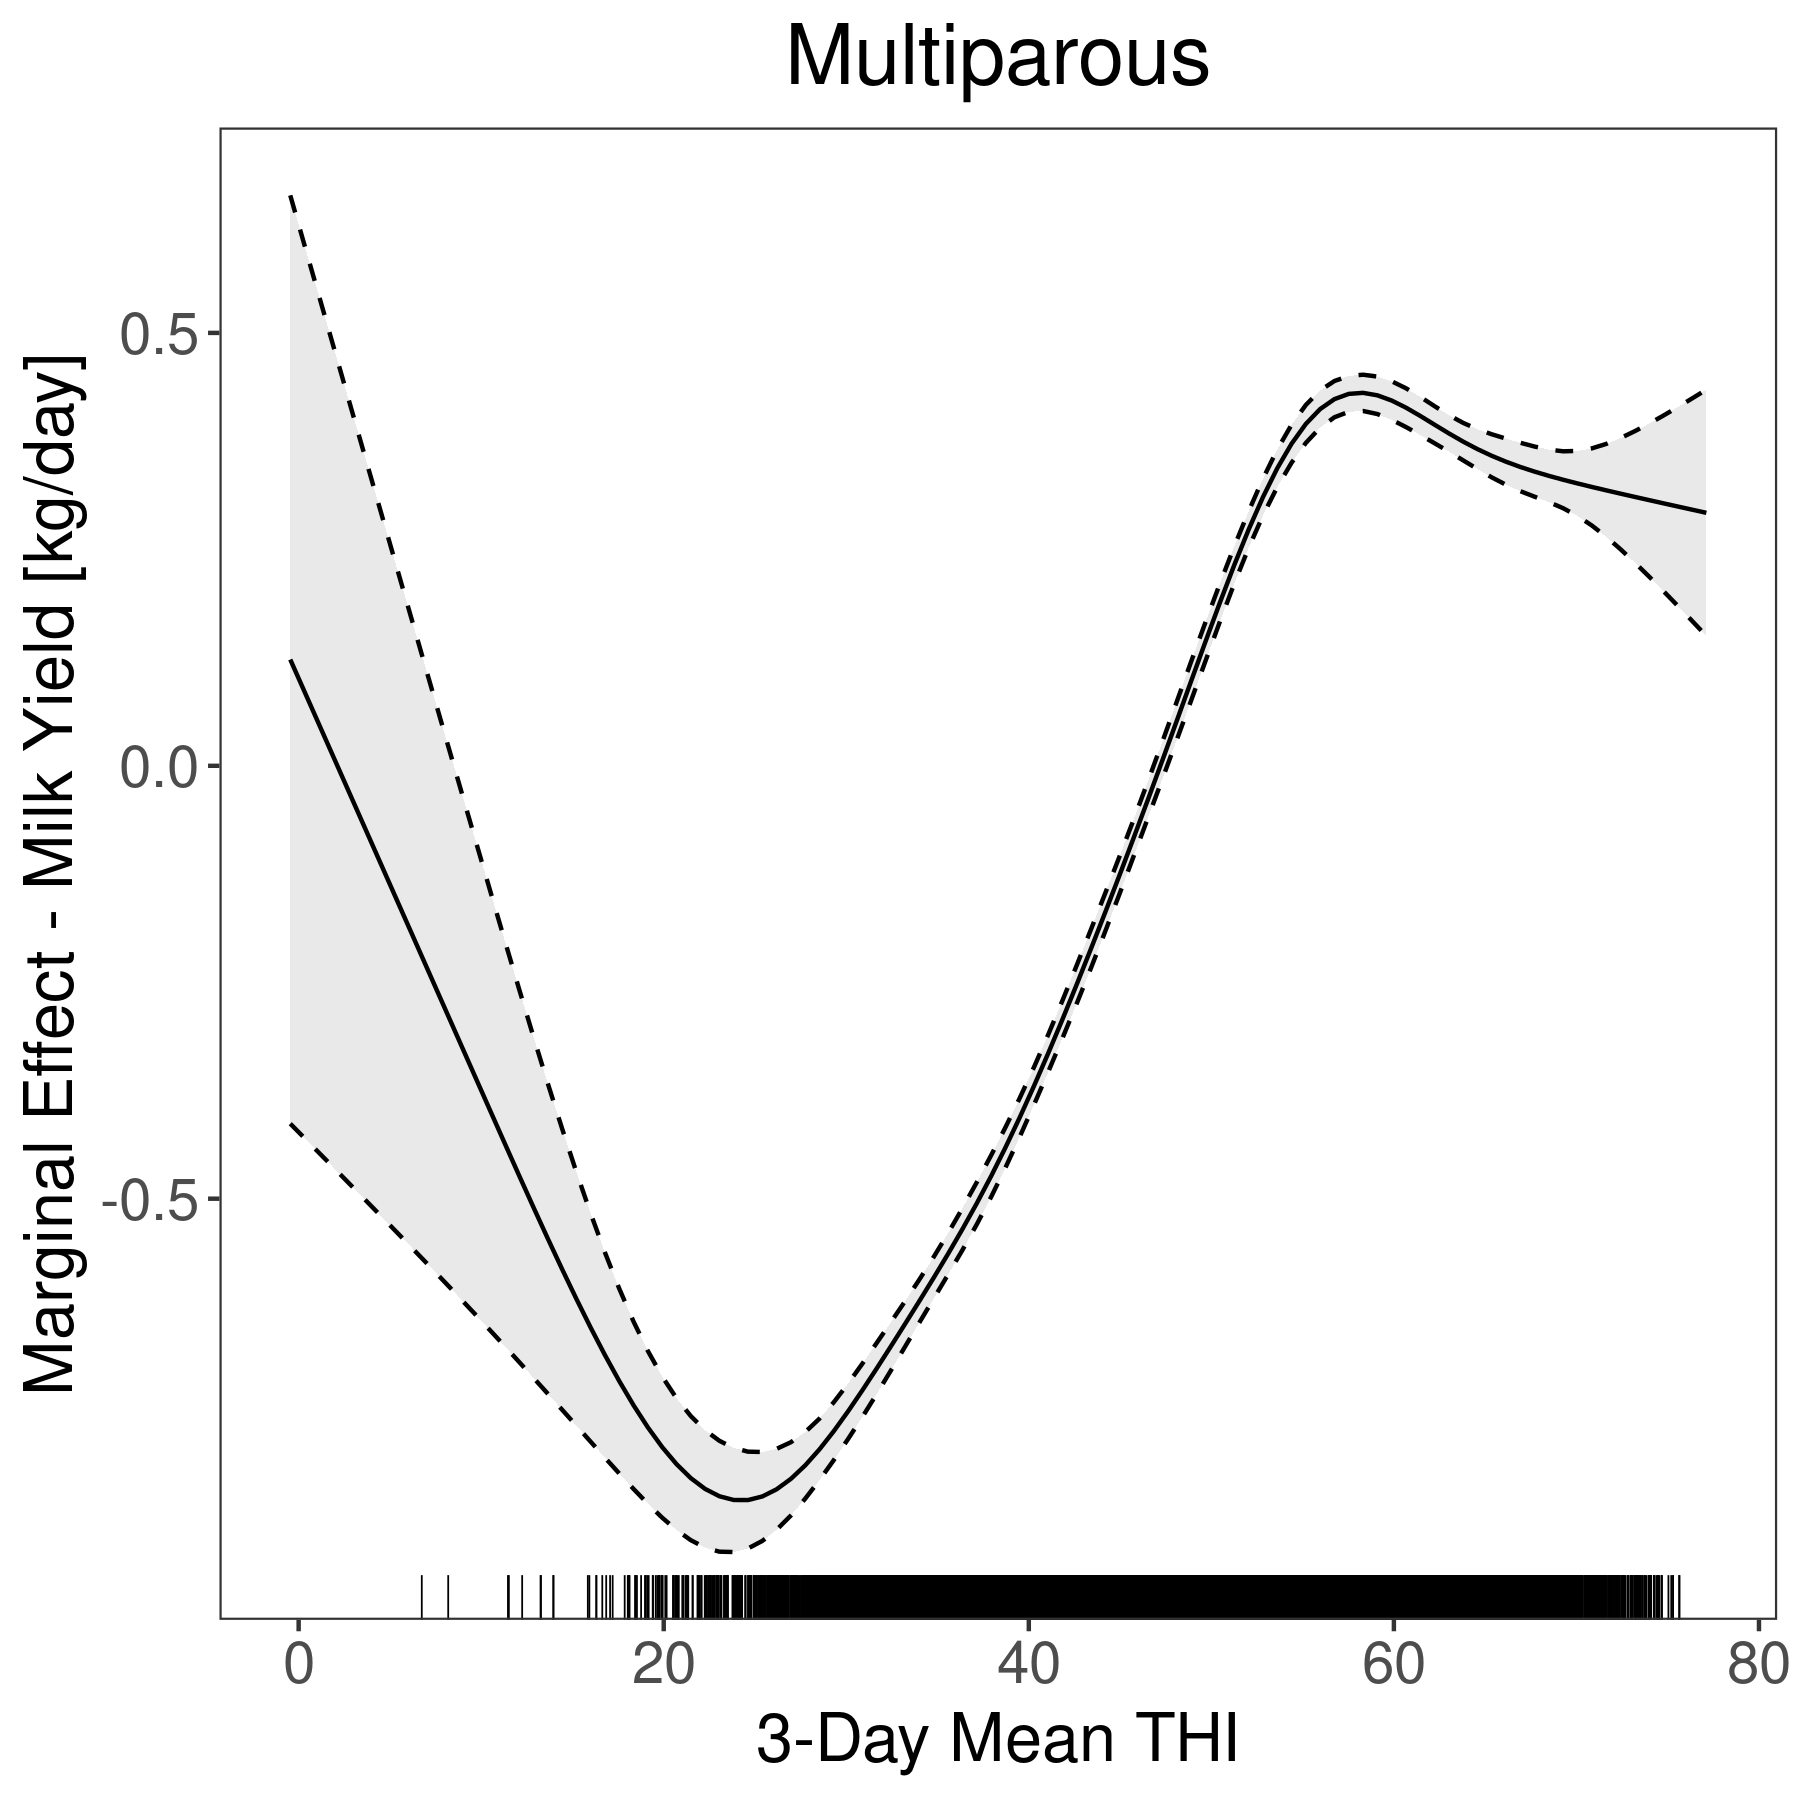
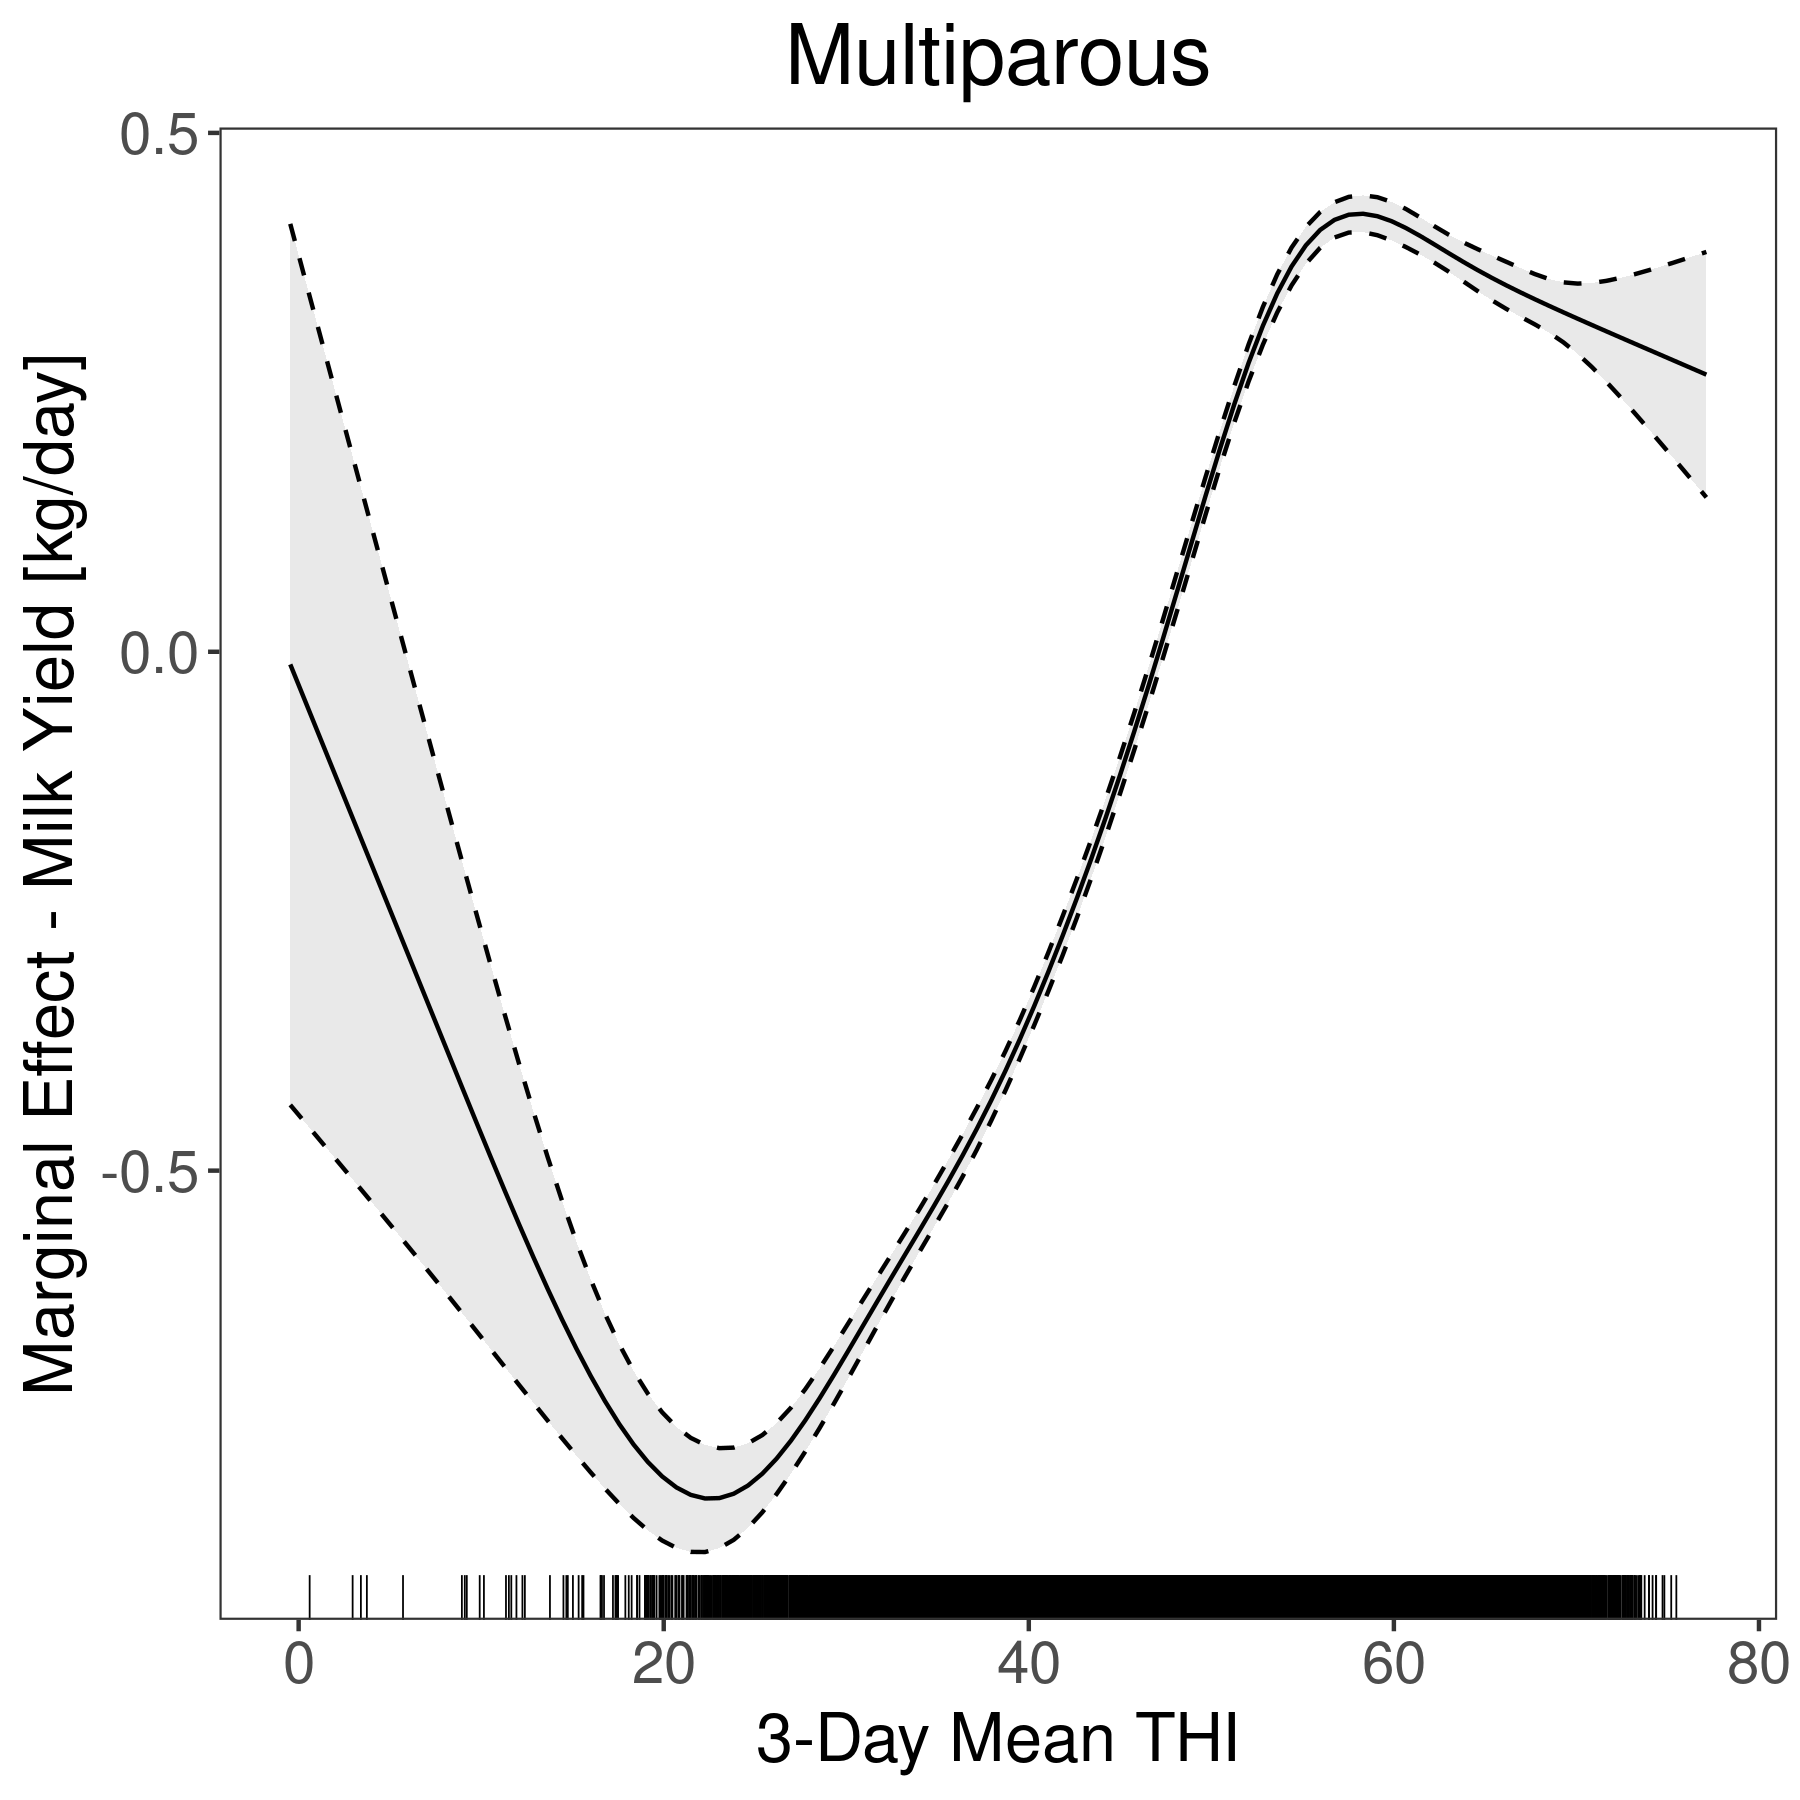
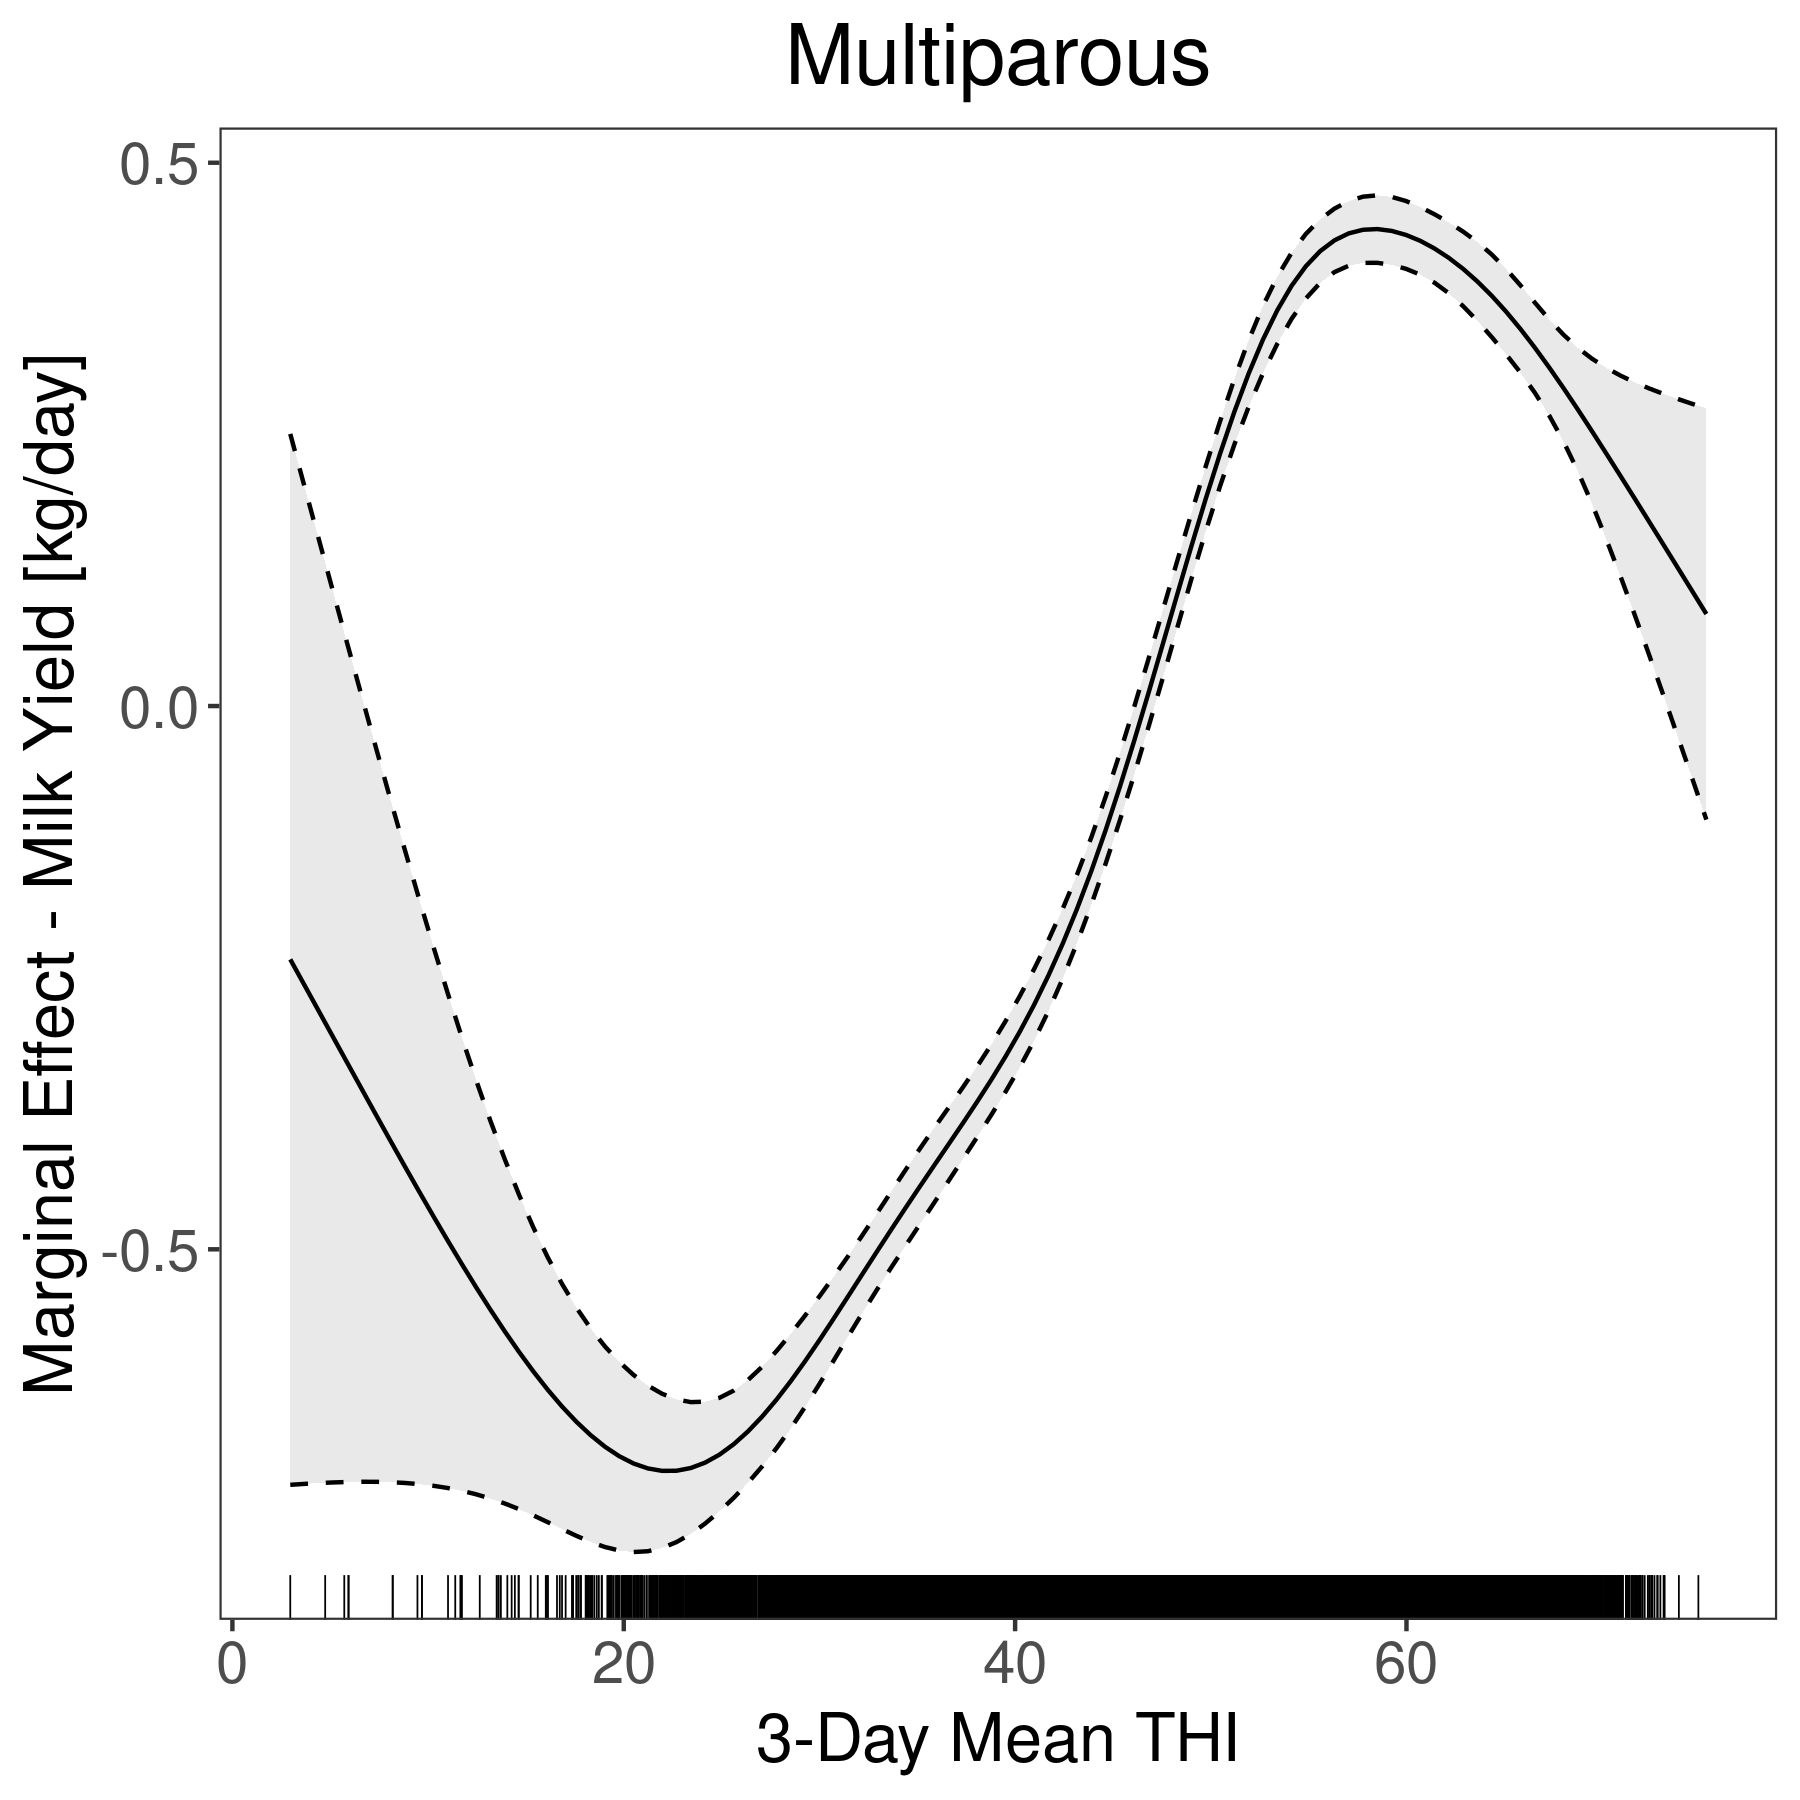
| s(thi_mean_t0_3d):paritymultiparous | 8.0636 | 8.0636 | 1133.7258 | \(< 0.0001\) |
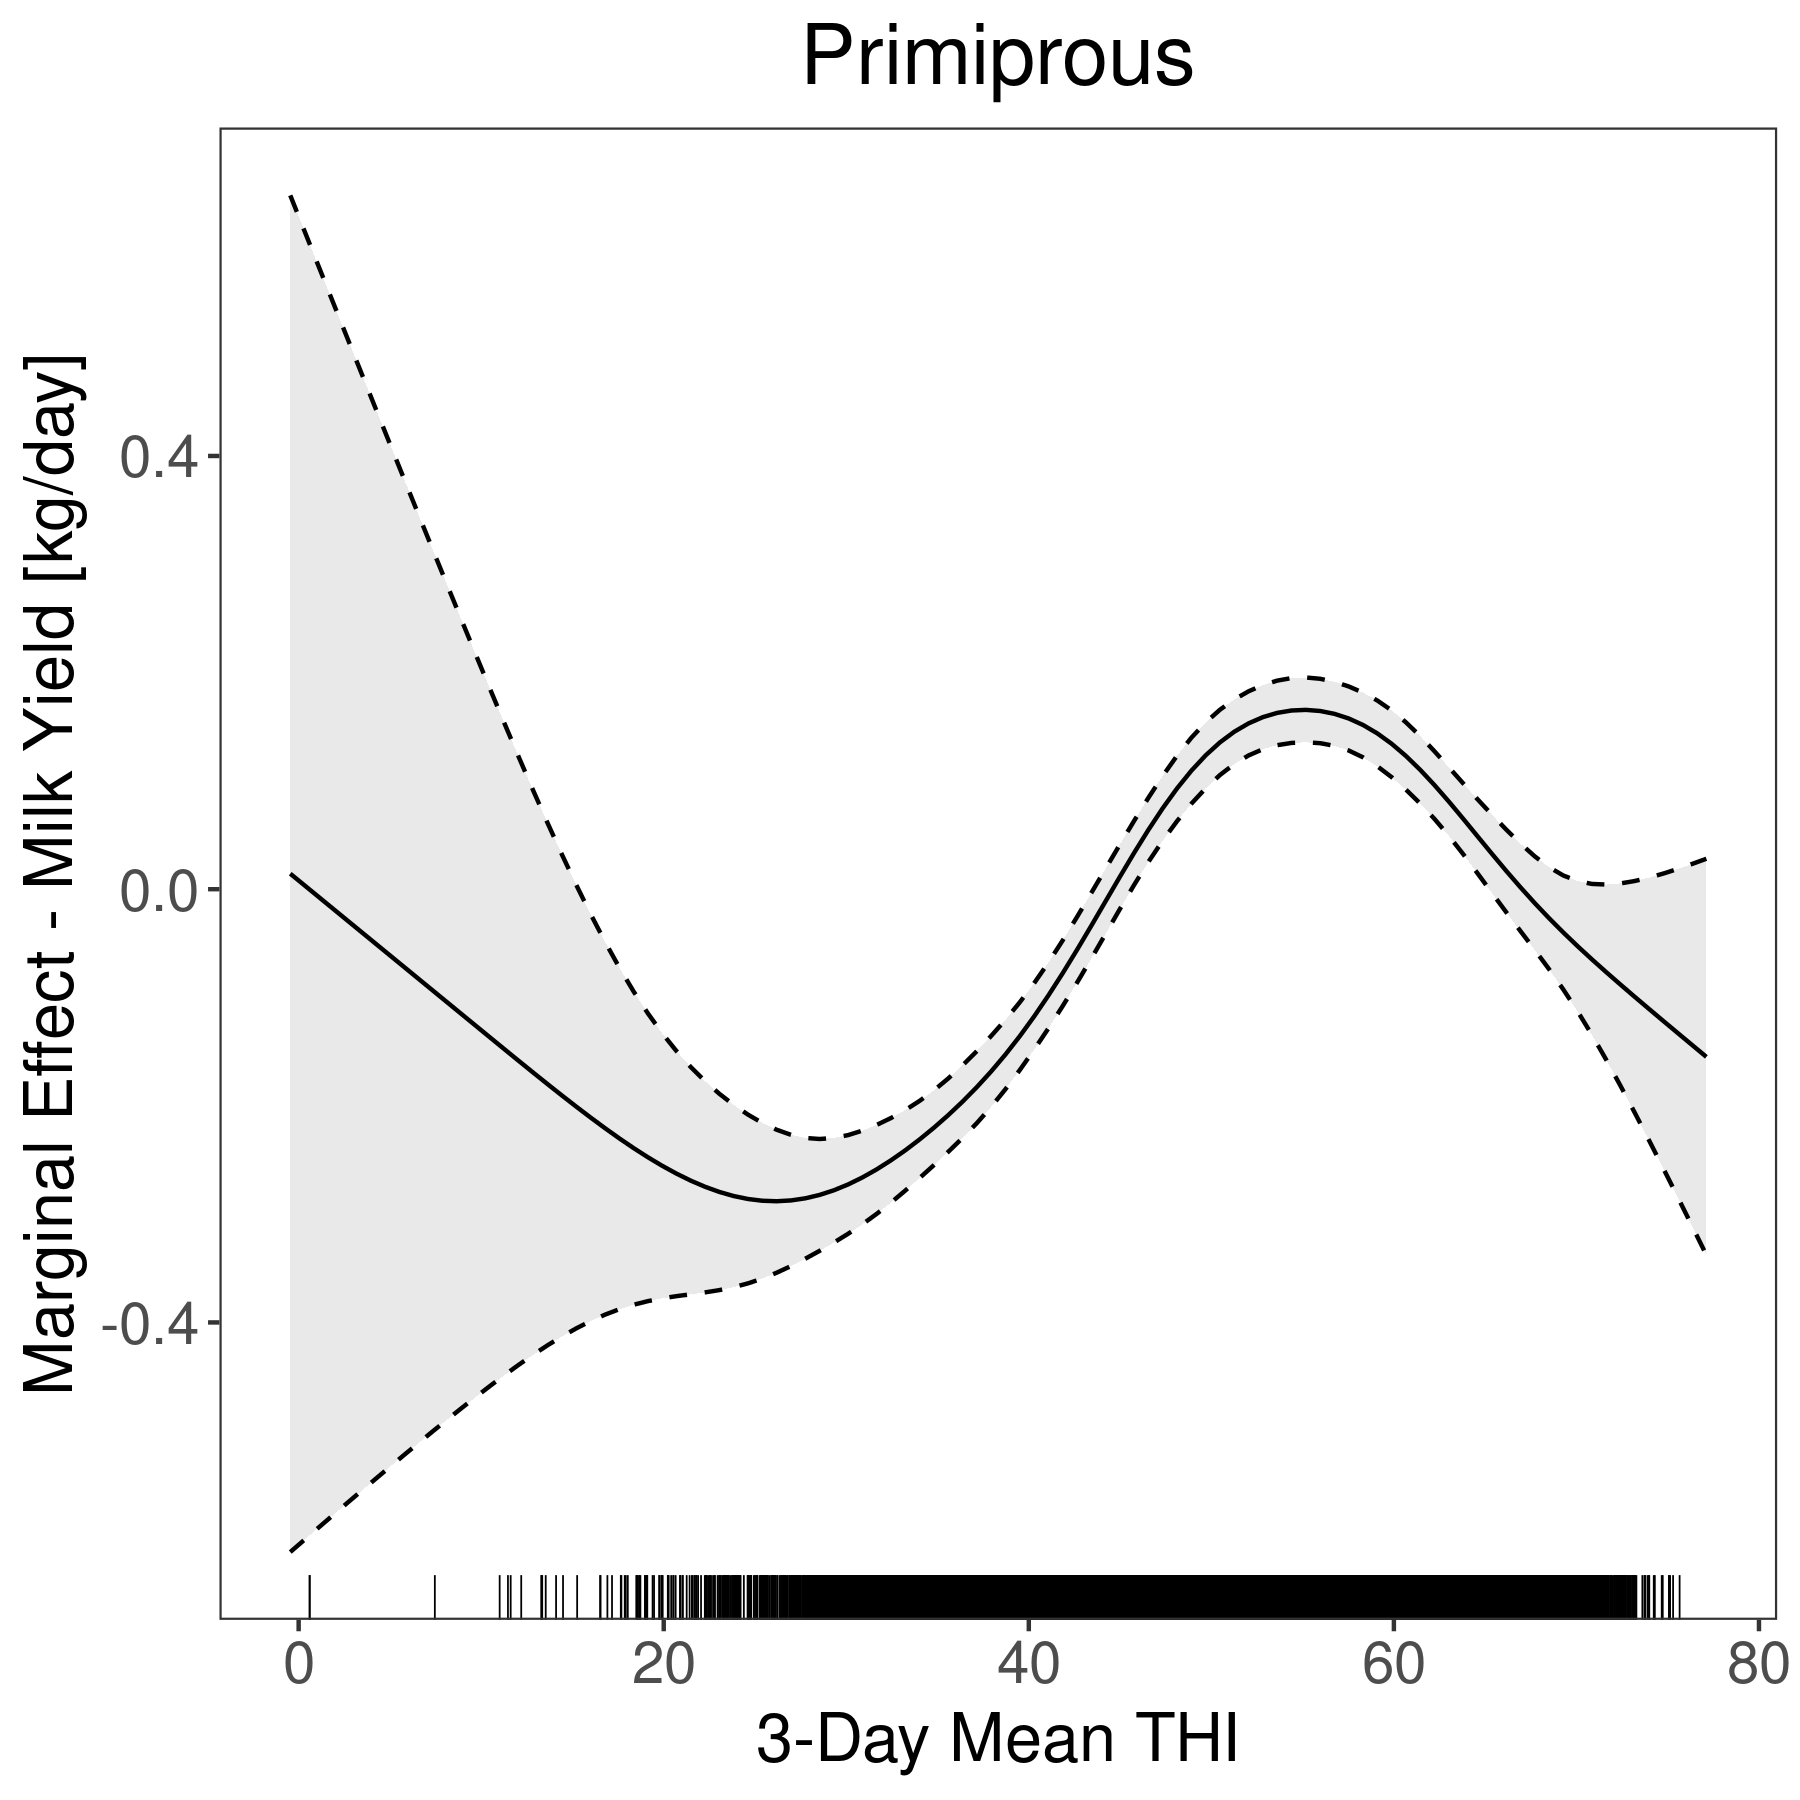
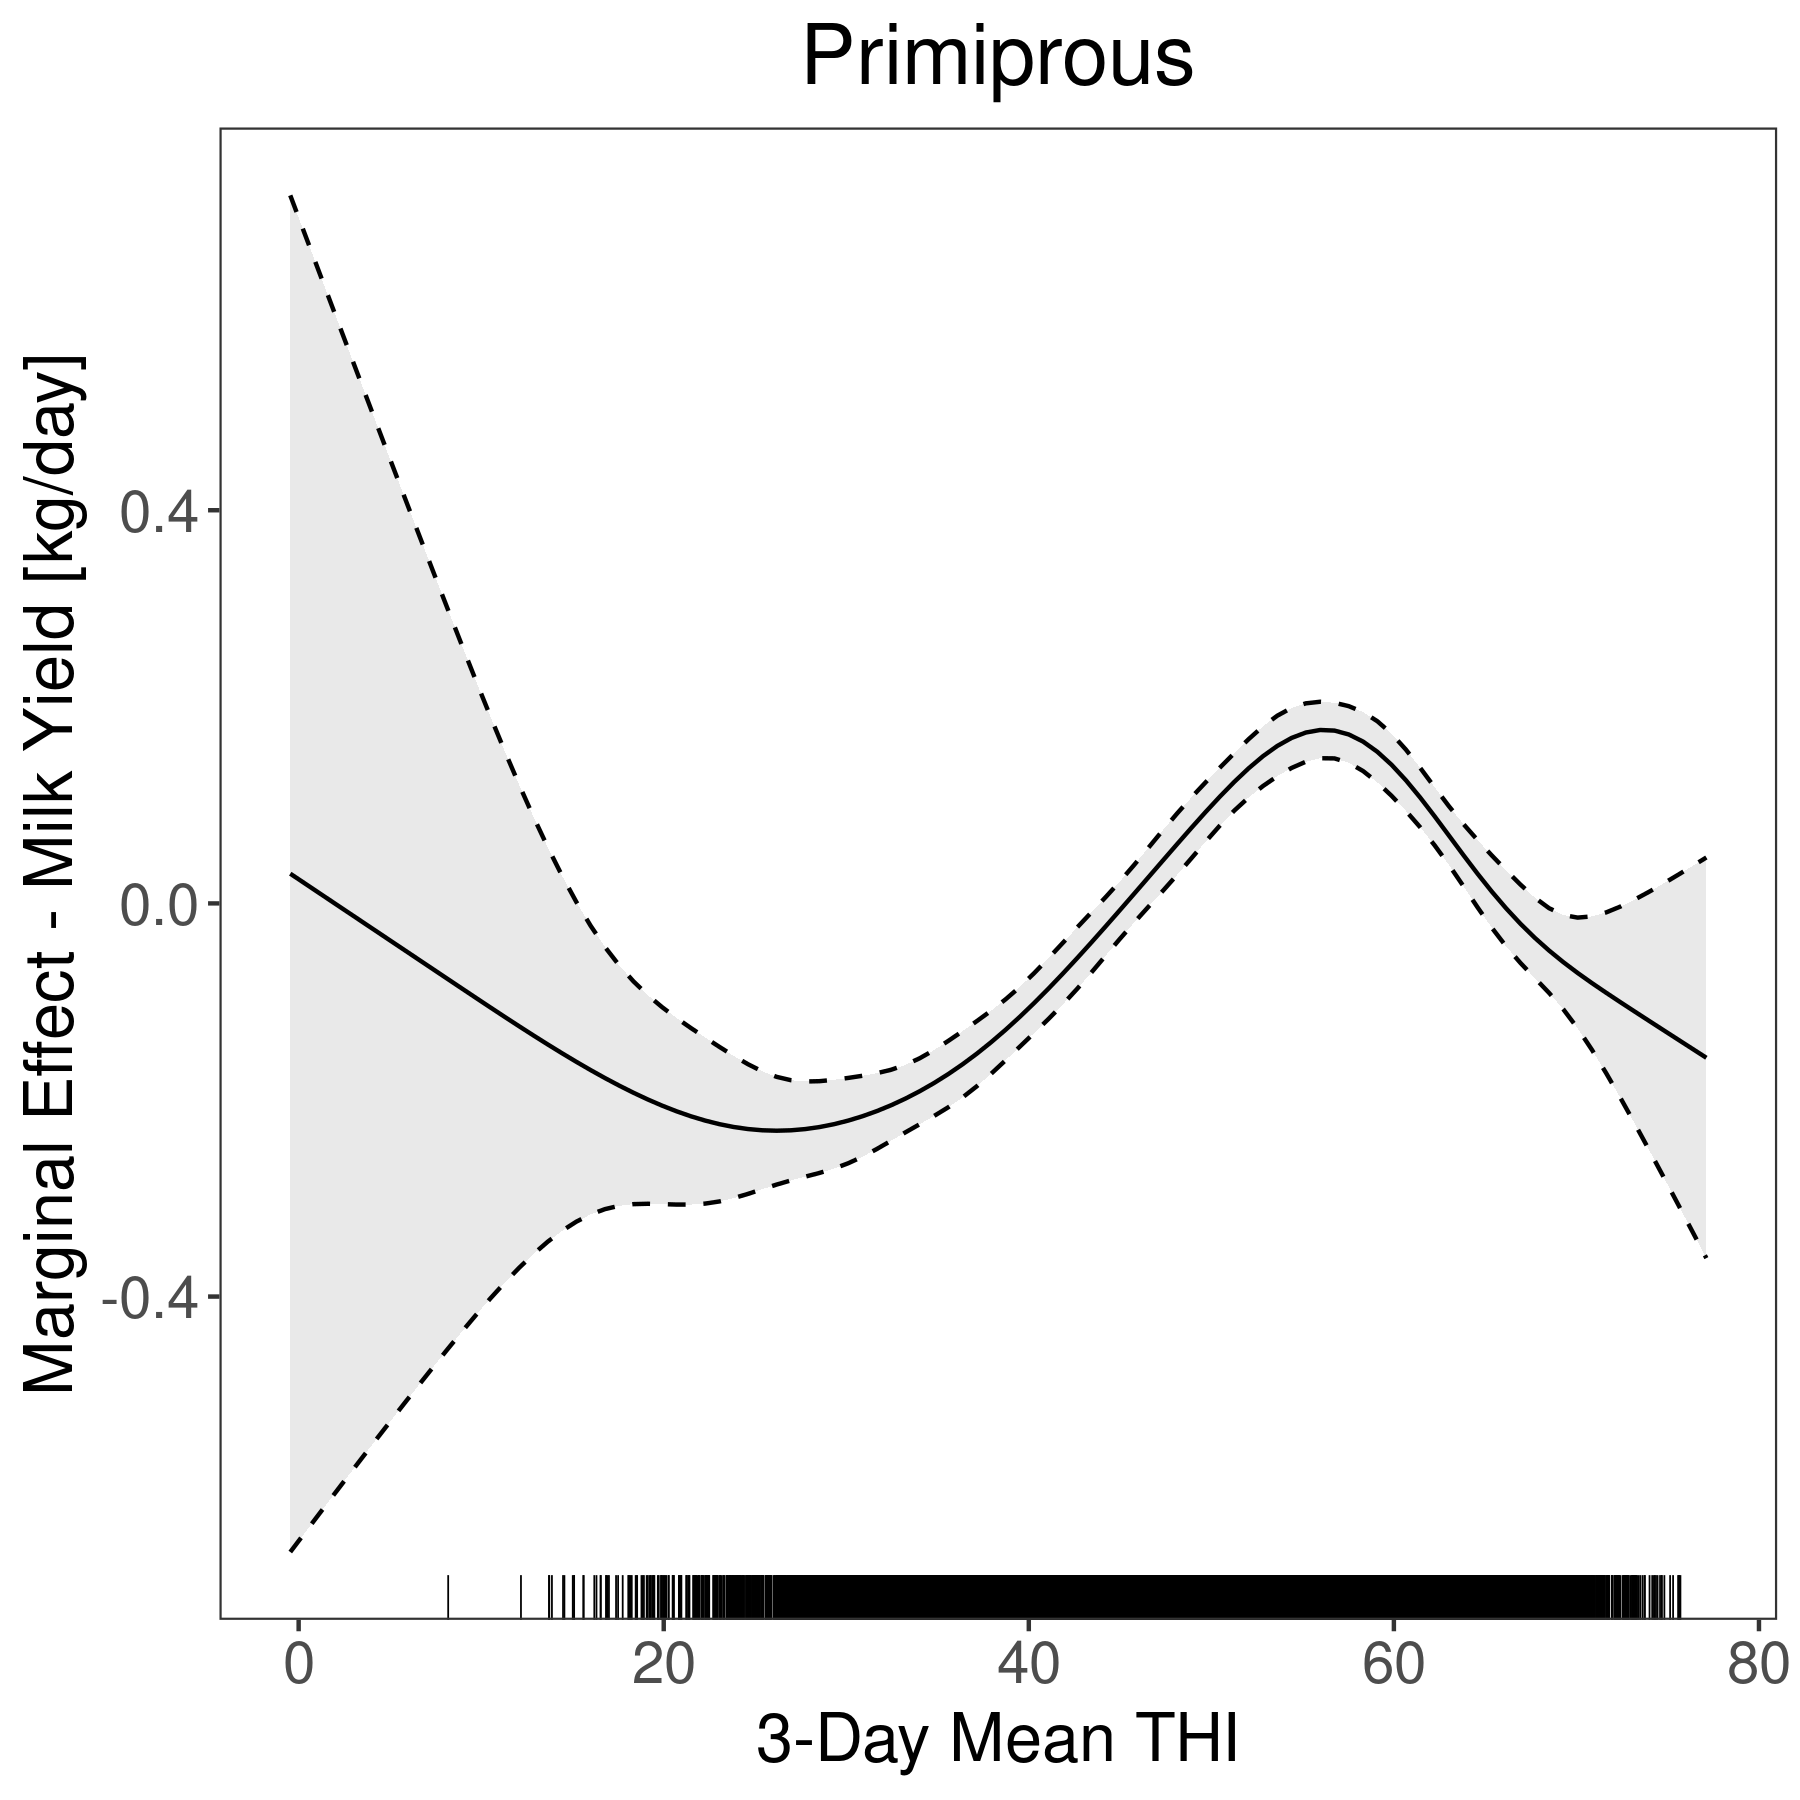
| s(thi_mean_t0_3d):parityprimiparous | 8.5711 | 8.5711 | 44.5719 | \(< 0.0001\) |
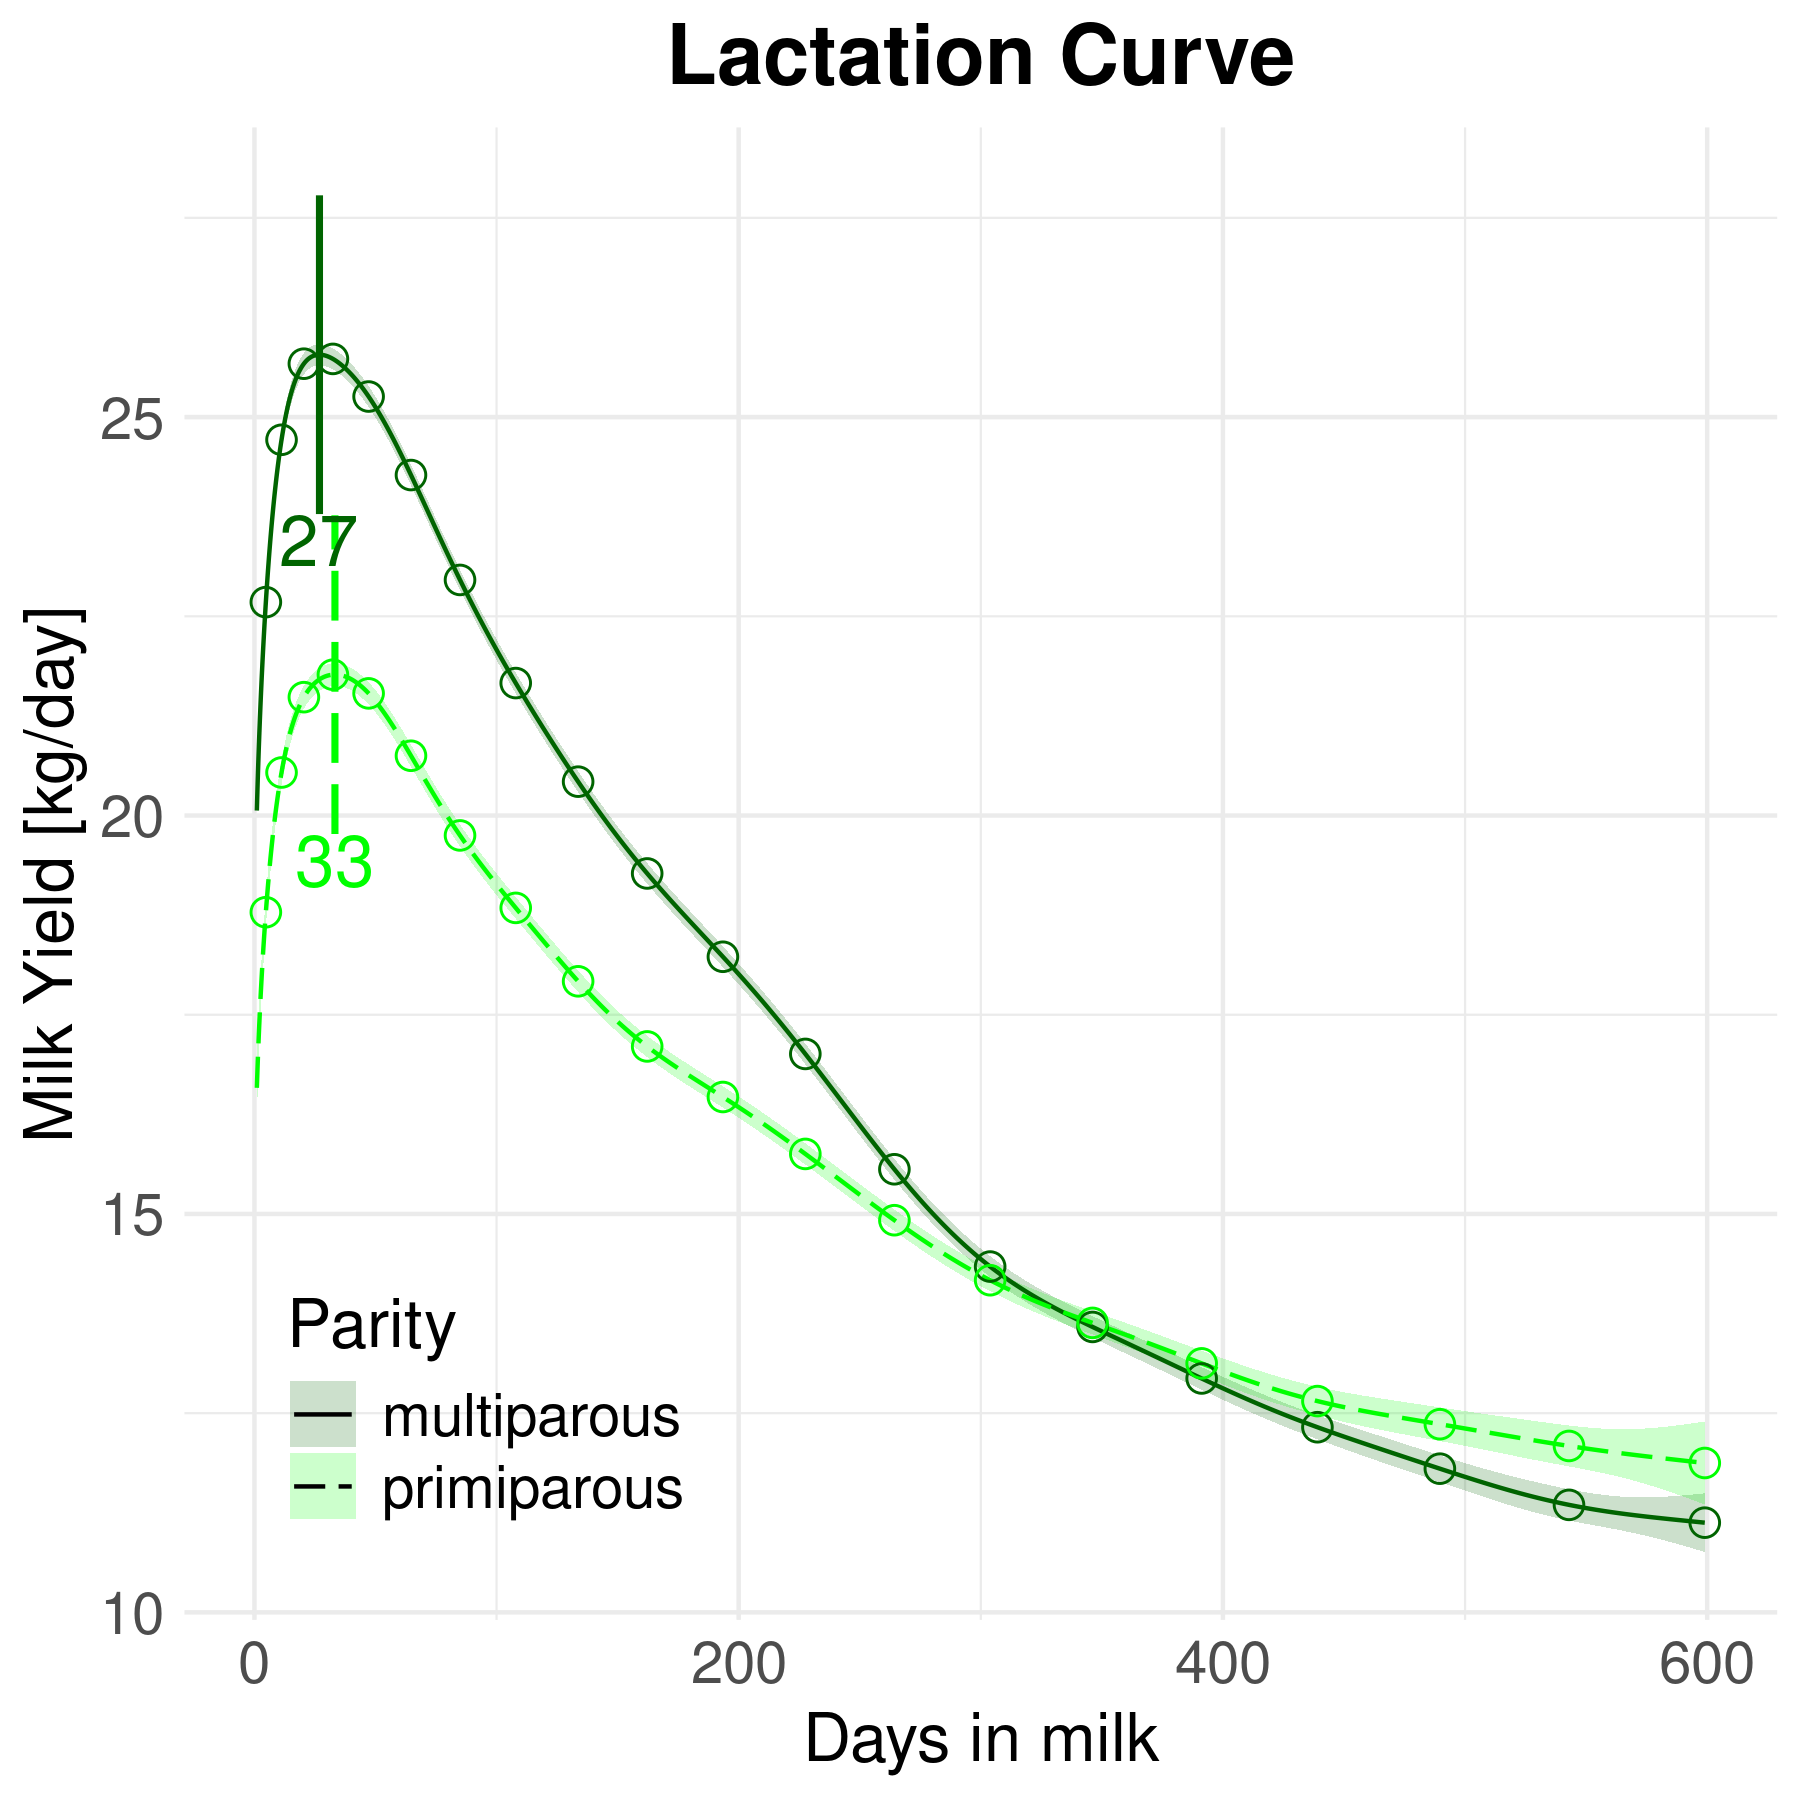
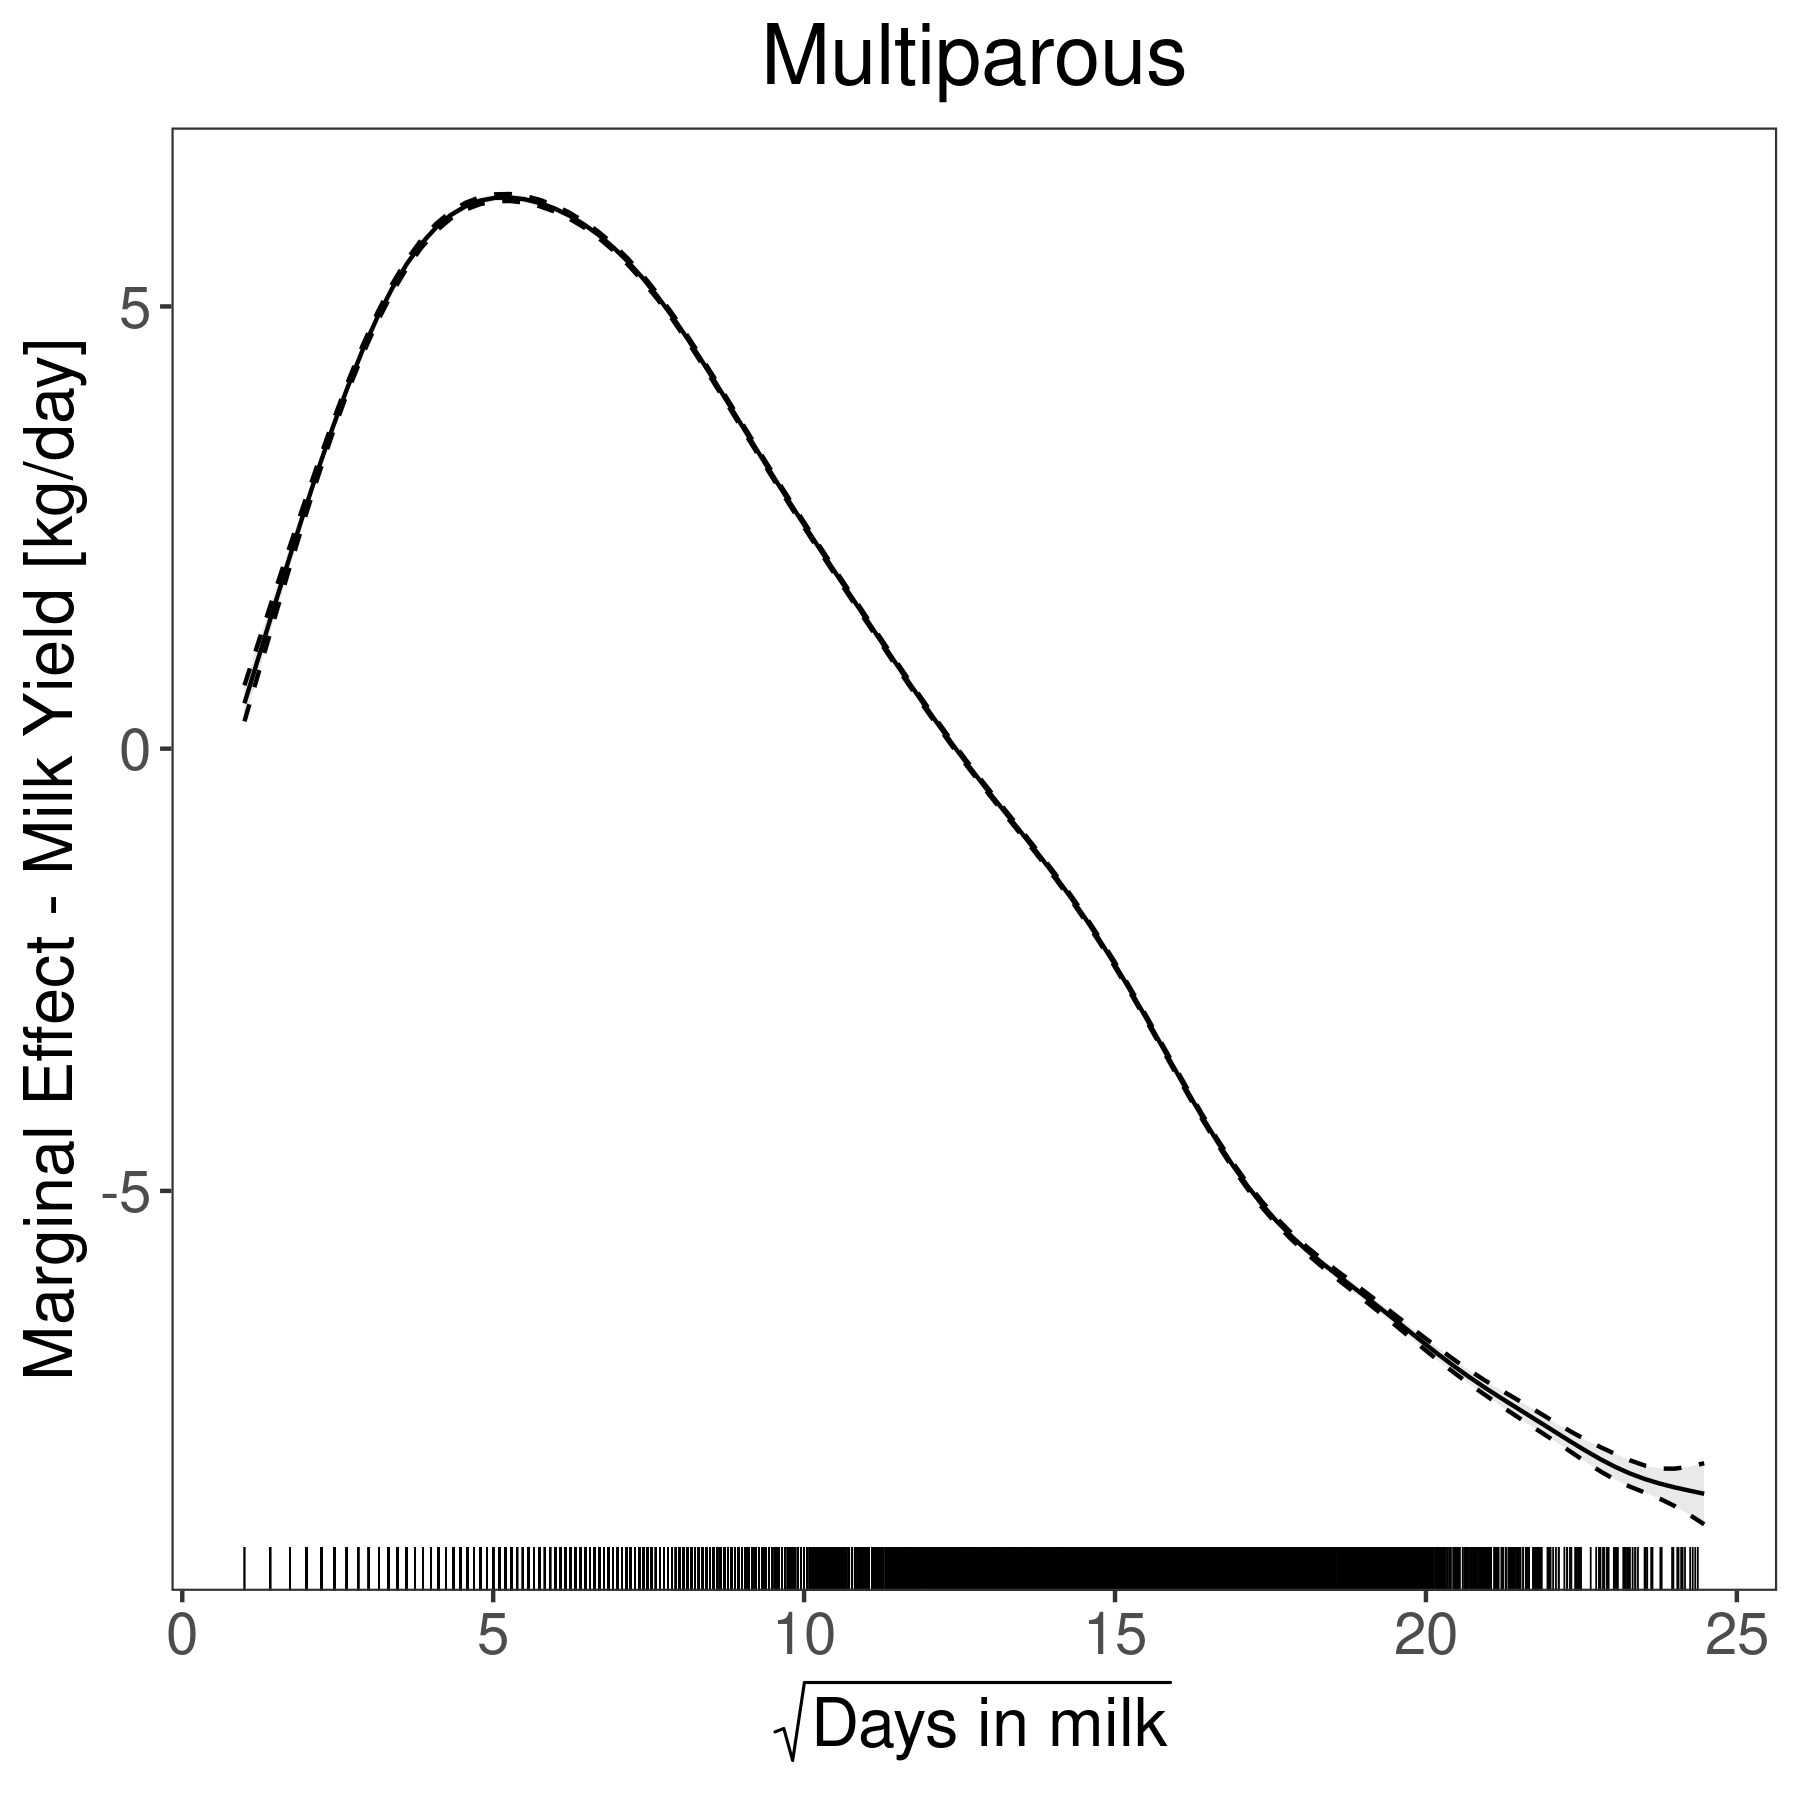
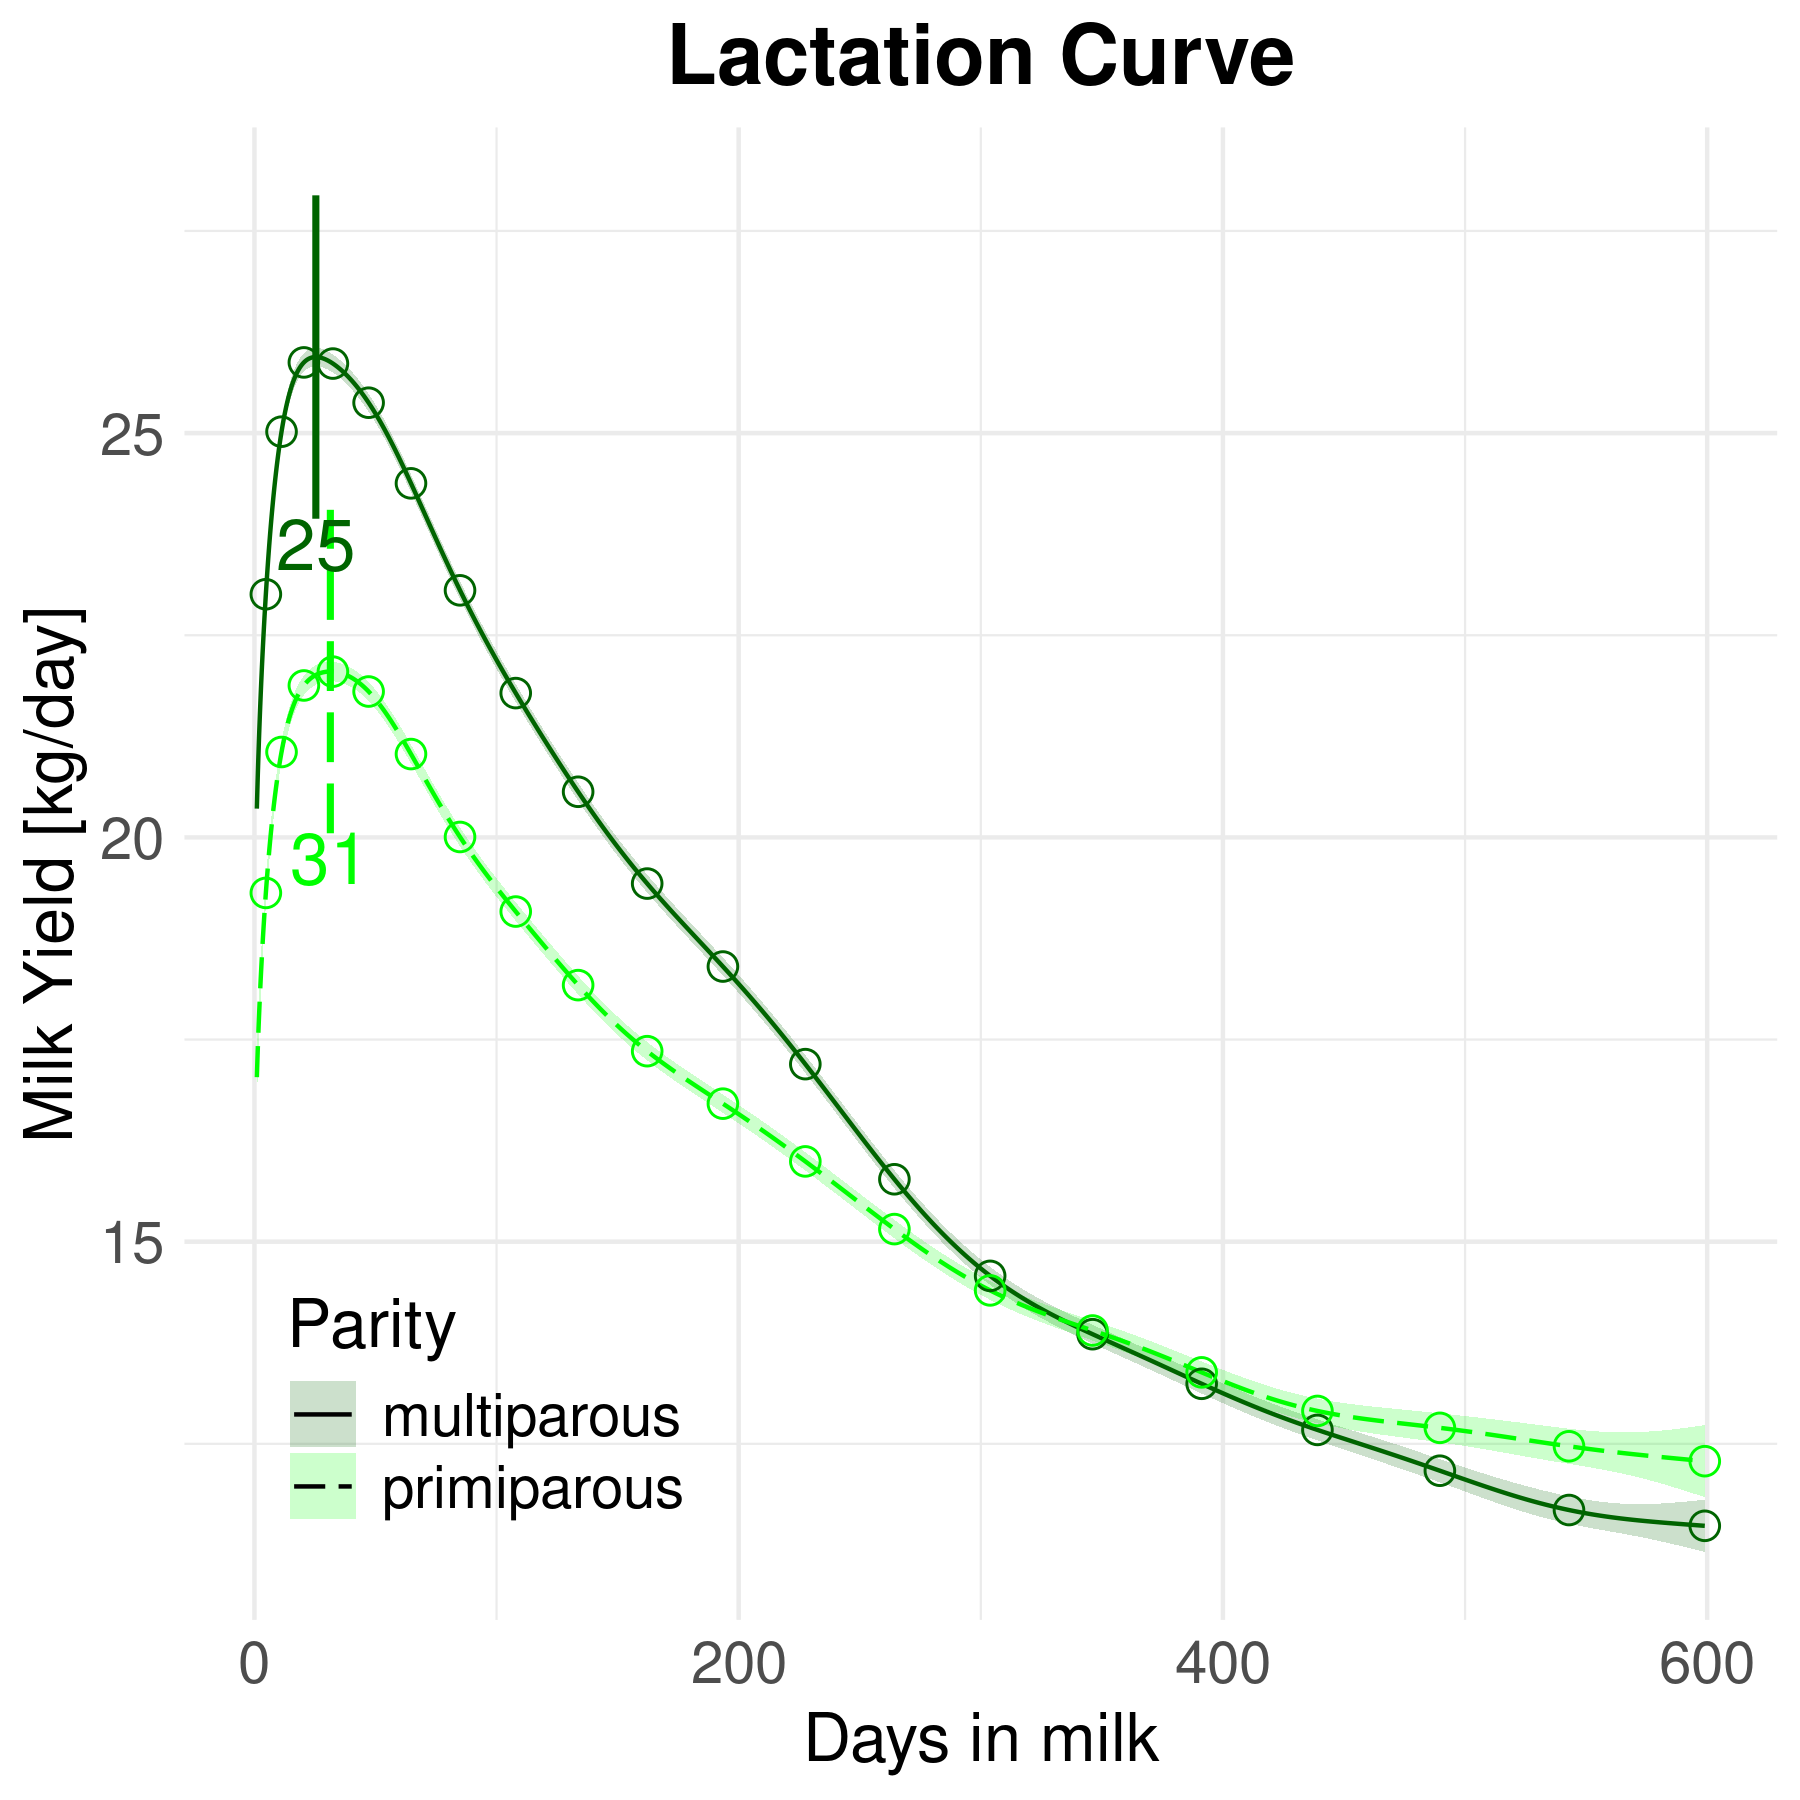
| s(days_in_milk_t):paritymultiparous | 14.5547 | 14.5547 | 57761.6129 | \(< 0.0001\) |
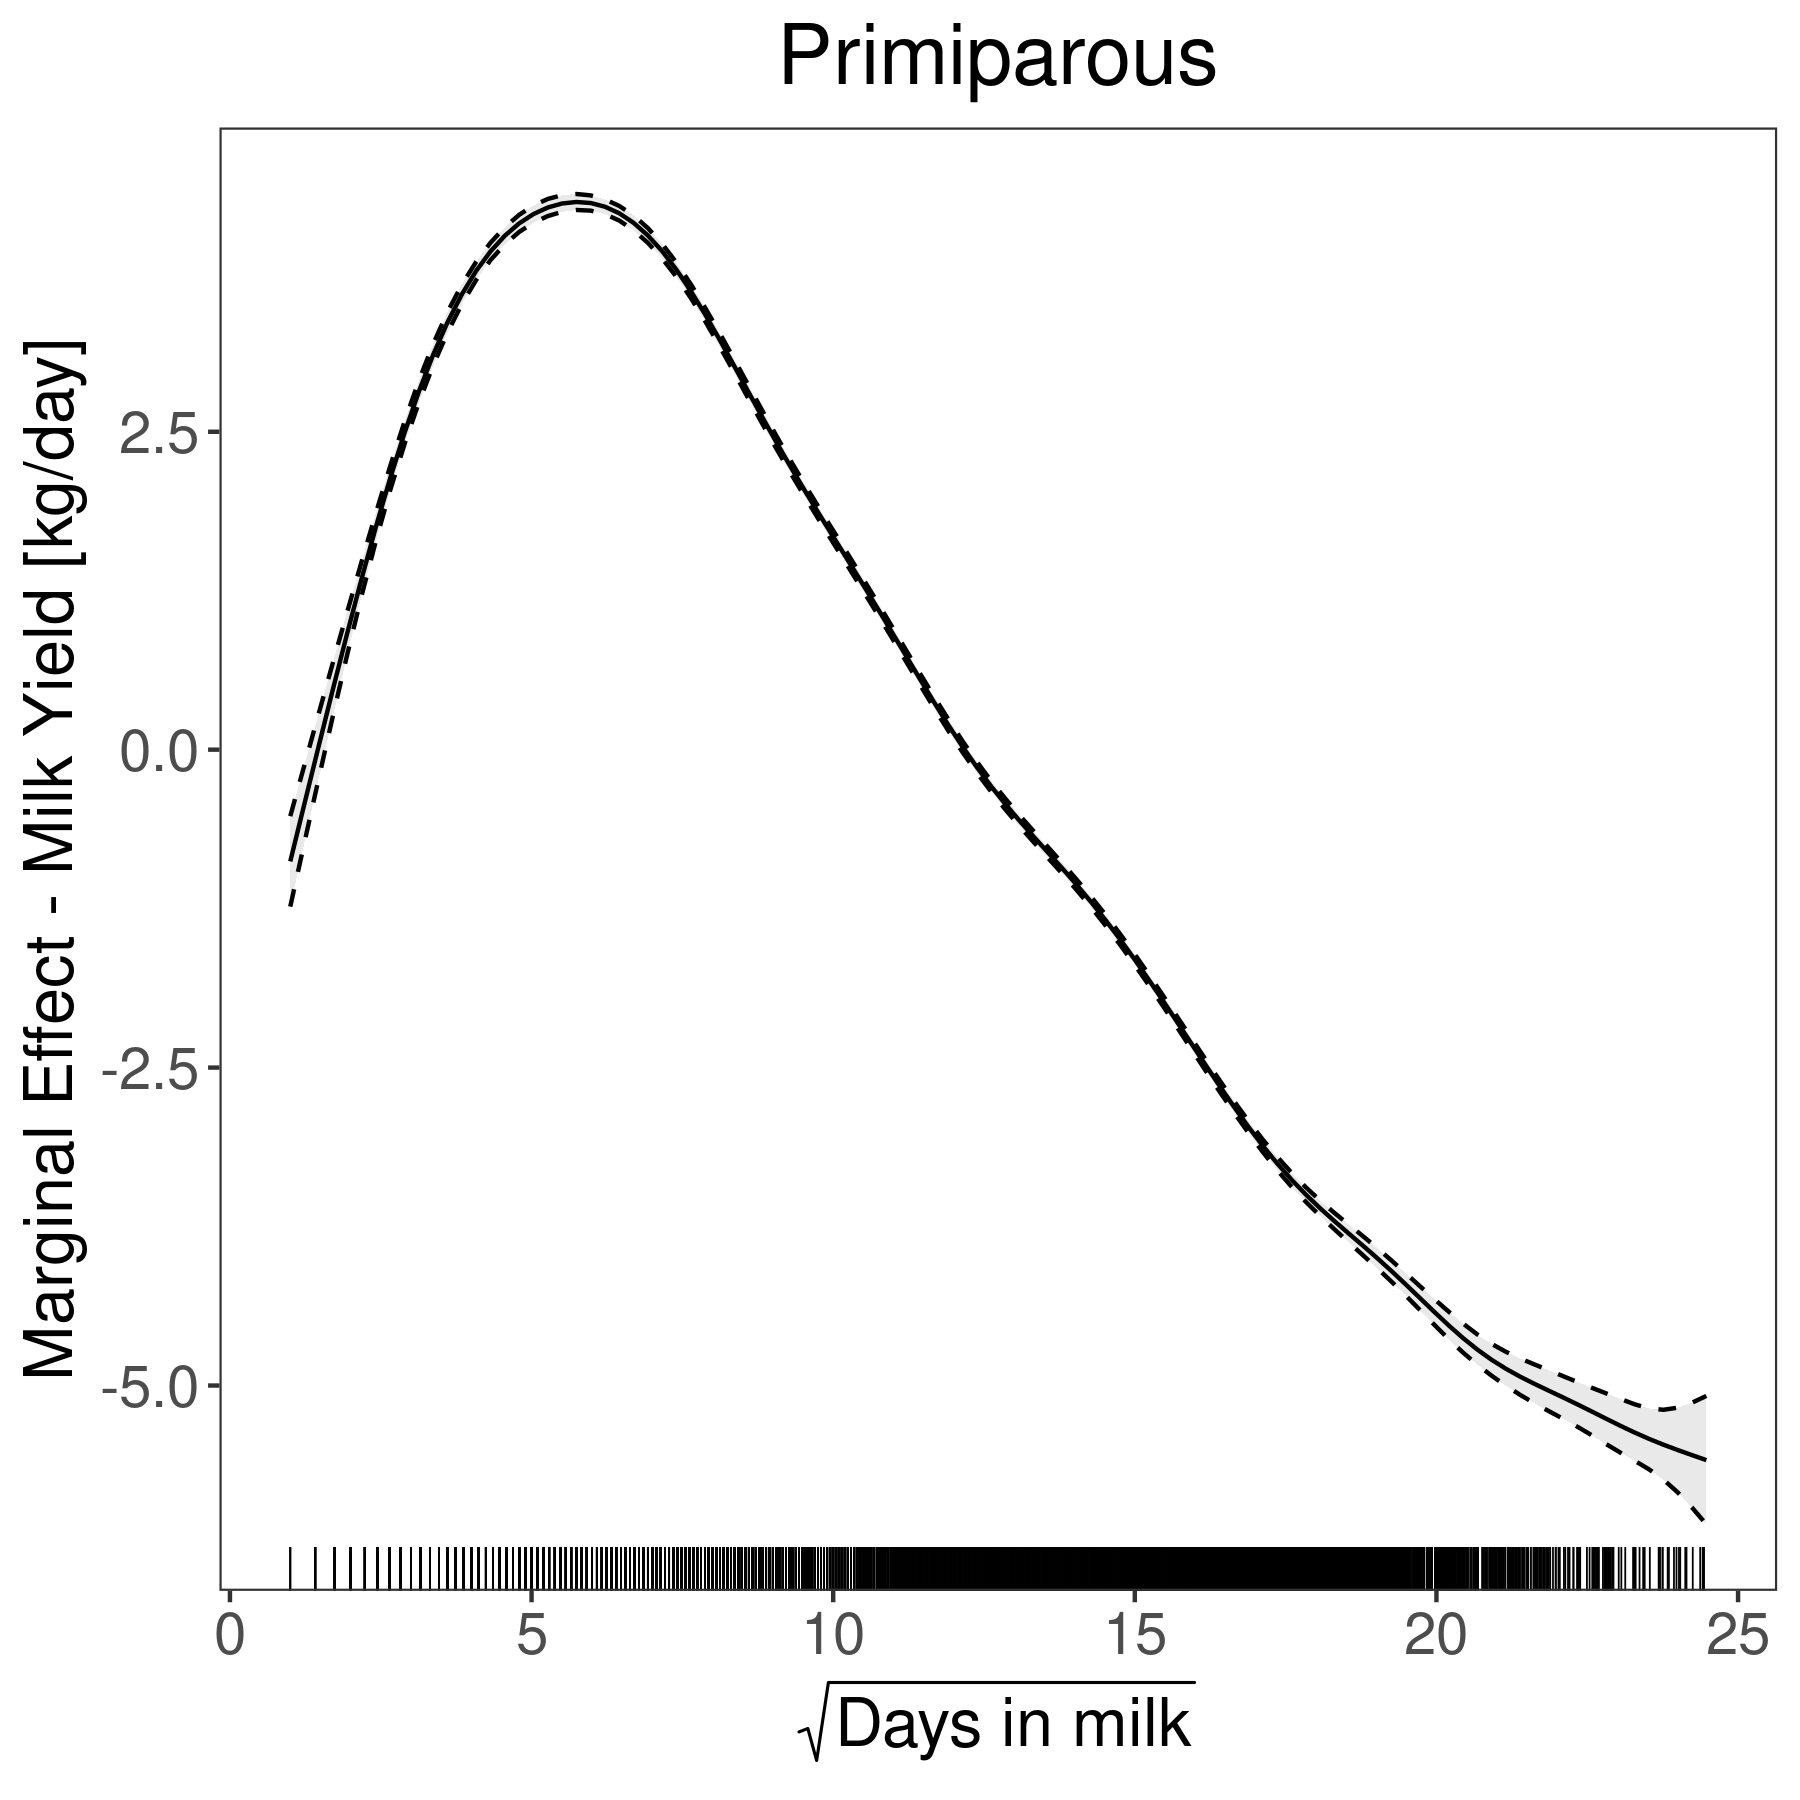
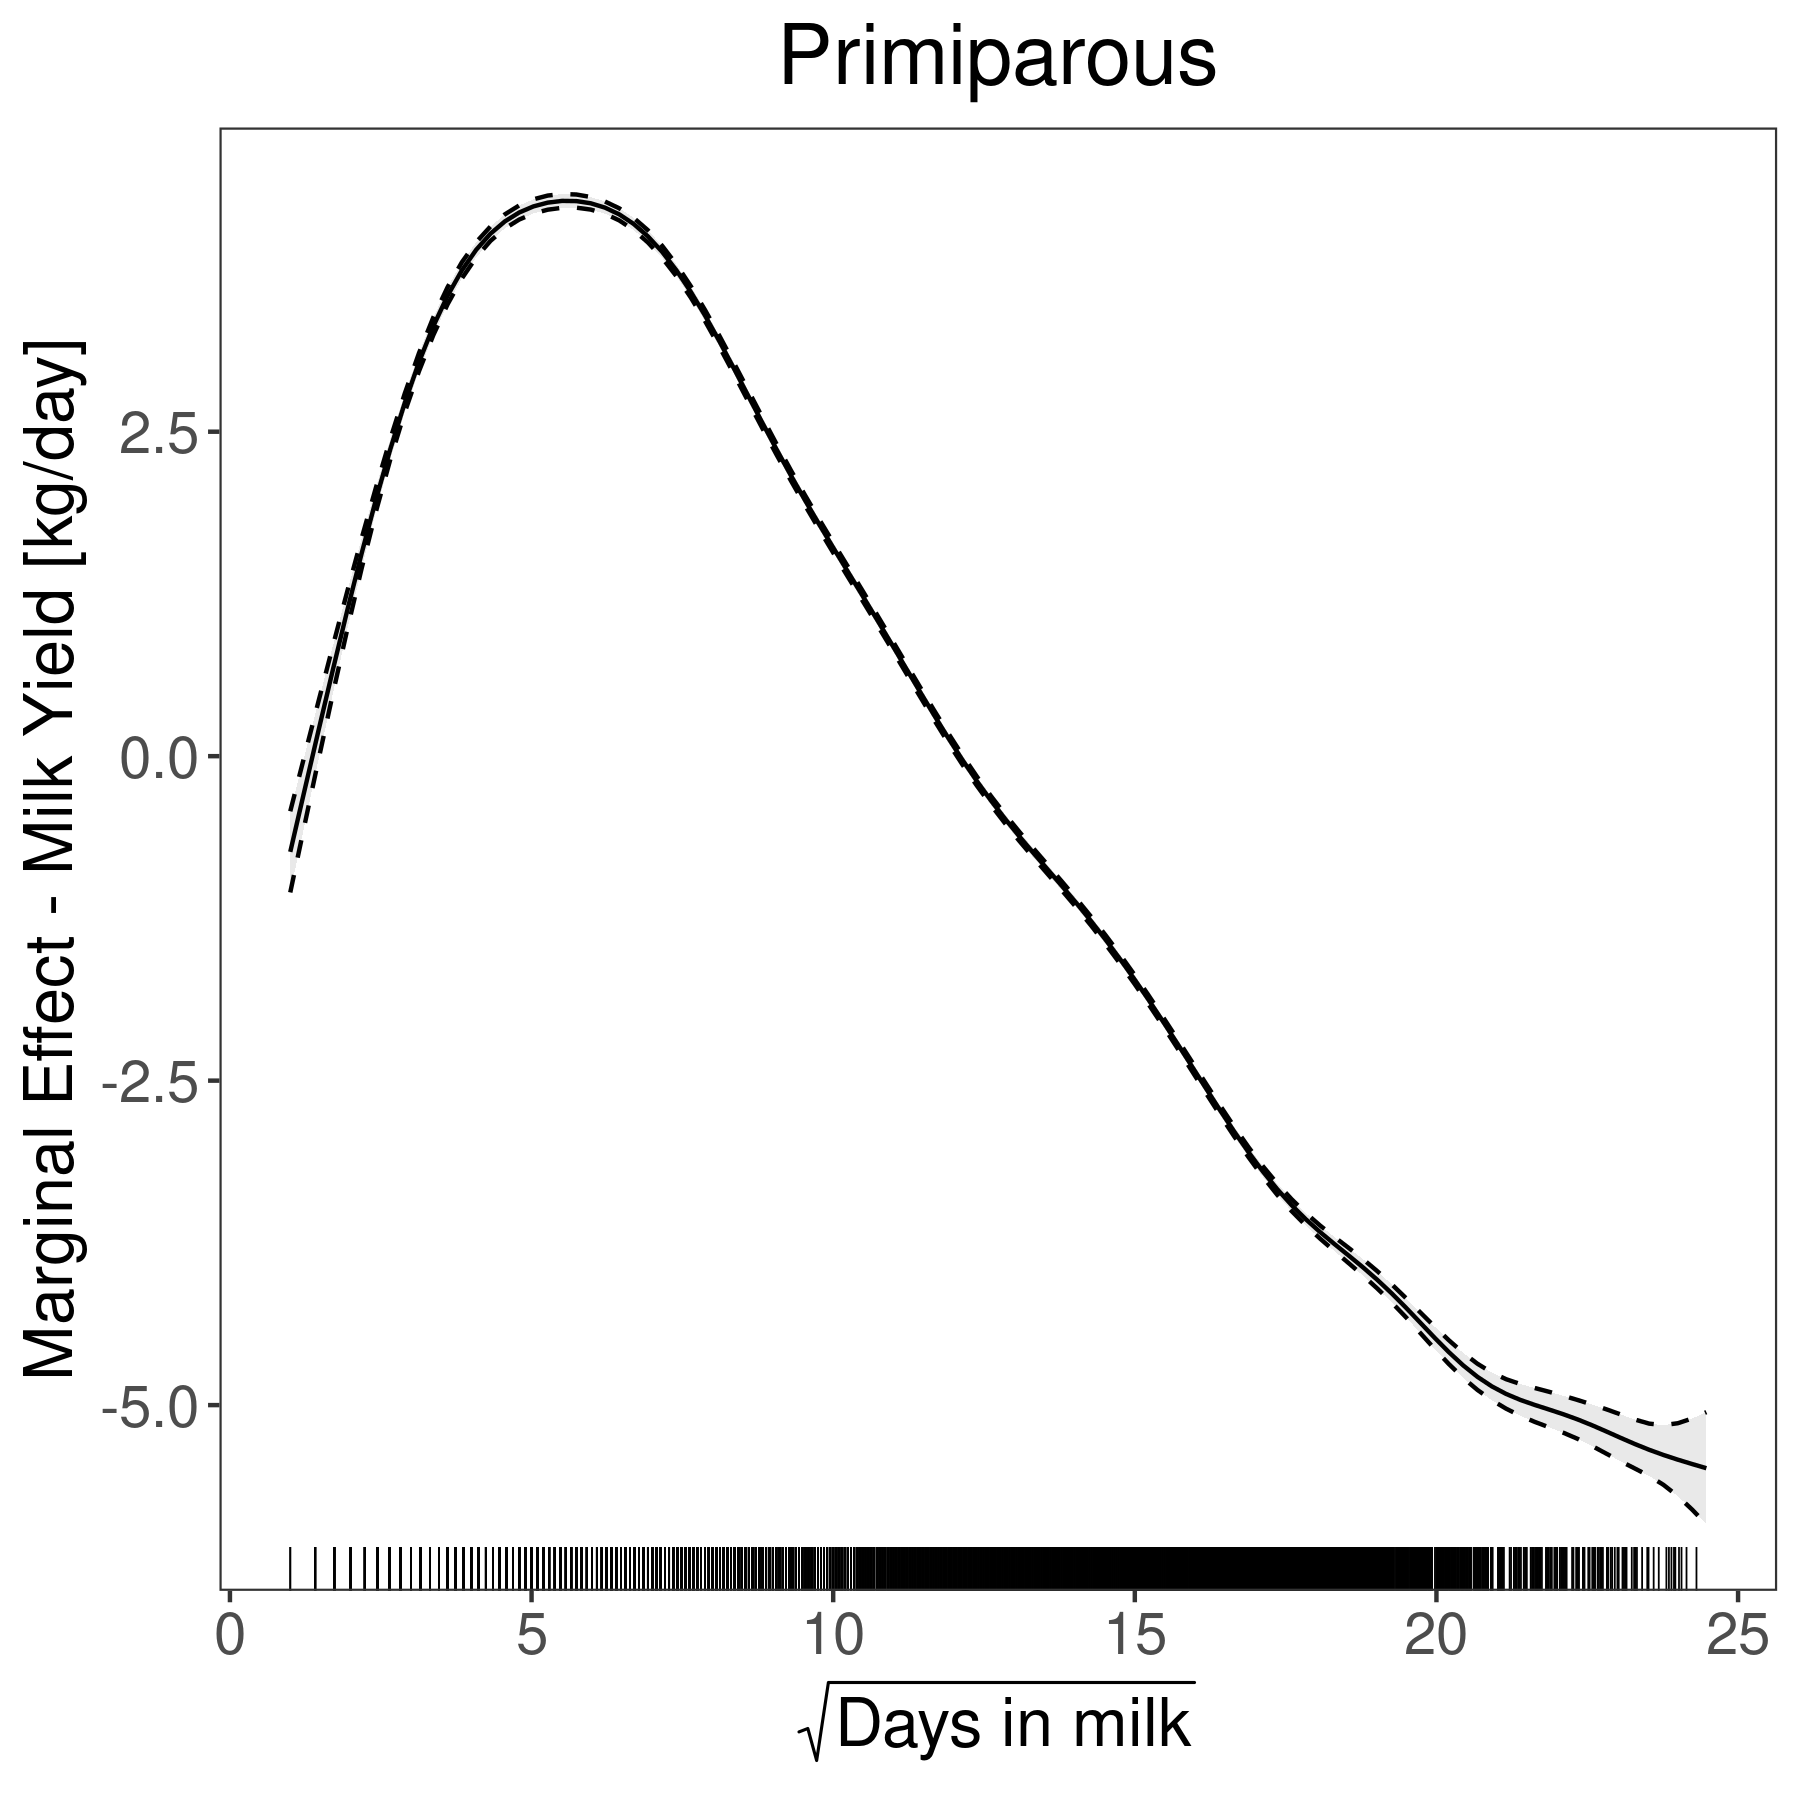
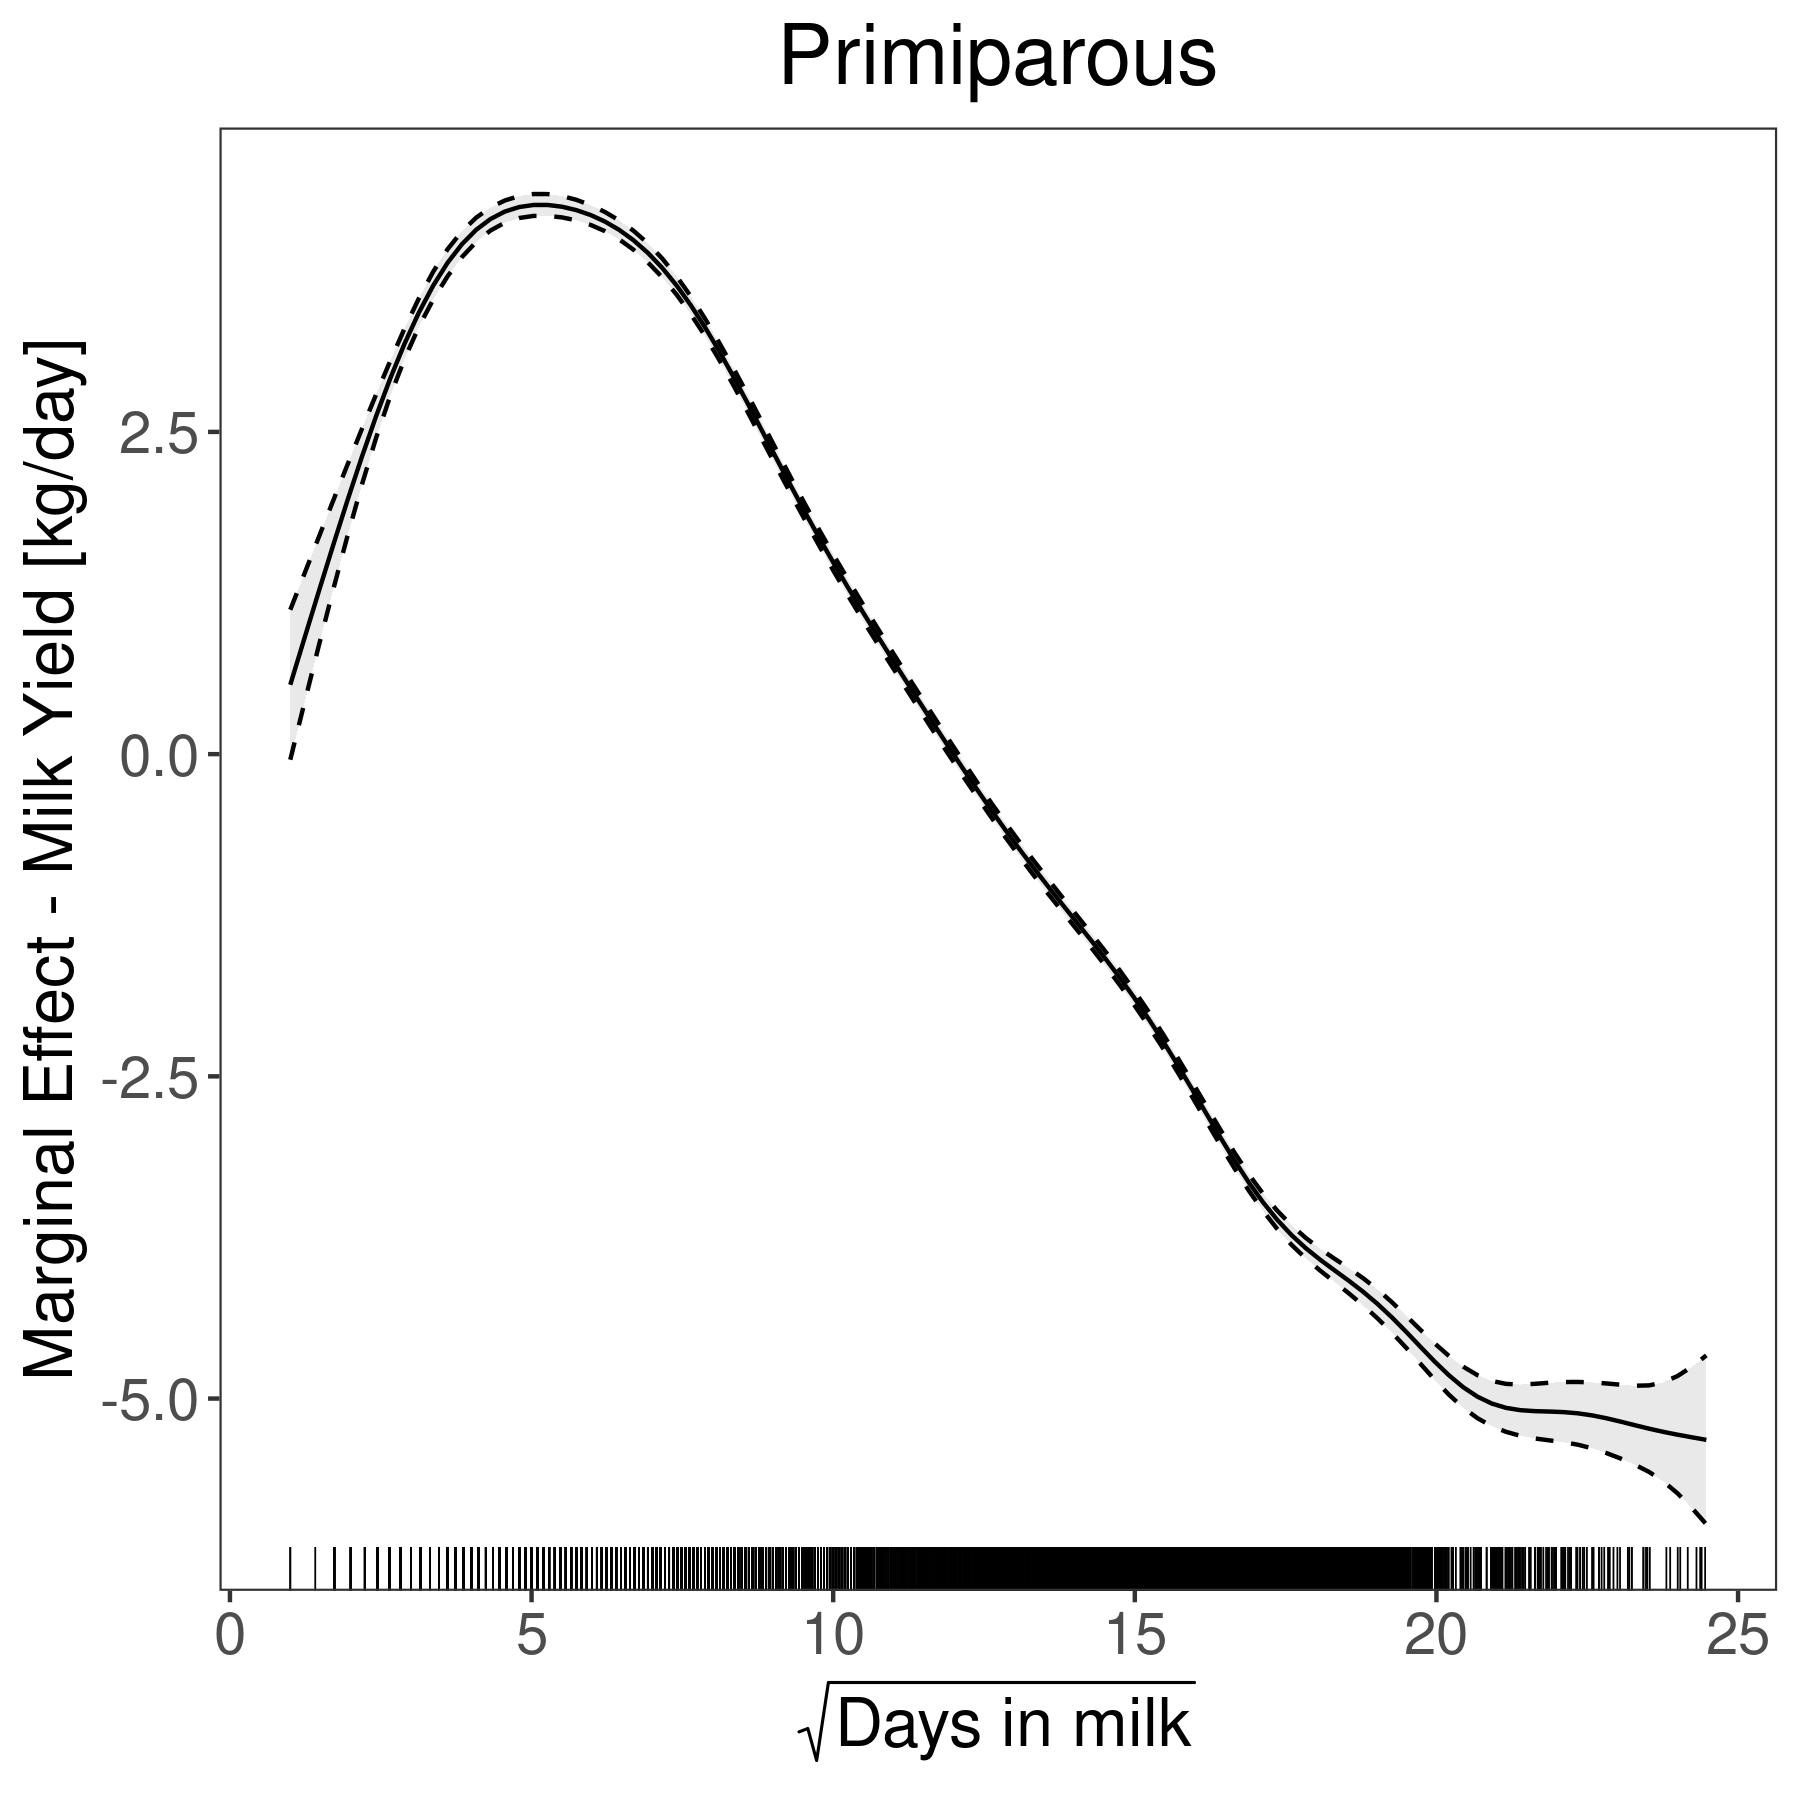
| s(days_in_milk_t):parityprimiparous | 13.8436 | 13.8436 | 9080.5596 | \(< 0.0001\) |
| Smooth Term Fixed Effect | Est. | SE | z | p |
|---|---|---|---|---|
| s(thi_mean_t0_3d):multiFx1 | 0.3076 | 0.0866 | 3.55 | \(< 0.0004\) |
| s(thi_mean_t0_3d):primiFx1 | 0.1474 | 0.1459 | 1.01 | 0.3124 |
| s(days_in_milk_):multiFx1 | 4.9106 | 0.3978 | 12.34 | \(< 1e-34\) |
| s(days_in_milk_):primiFx1 | 4.1249 | 0.5323 | 7.75 | \(< 1e-14\) |
| Variance Component | Estimated \( \sigma \) | |||
|---|---|---|---|---|
| \( \sigma_\alpha\) | 2.3991 | |||
| \( \sigma_\iota\) | 0.9500 | |||
| \( \sigma_\phi\) | 2.9764 | |||
| s(thi_mean_t0_3d):multi | 1.5575 | |||
| s(days_in_milk_):primi | 6.9995 | |||
| s(days_in_milk_):multi | 8.4095 | |||
| s(thi_mean_t0_3d):primi | 3.9762 | |||
| Residual | 2.9355 |
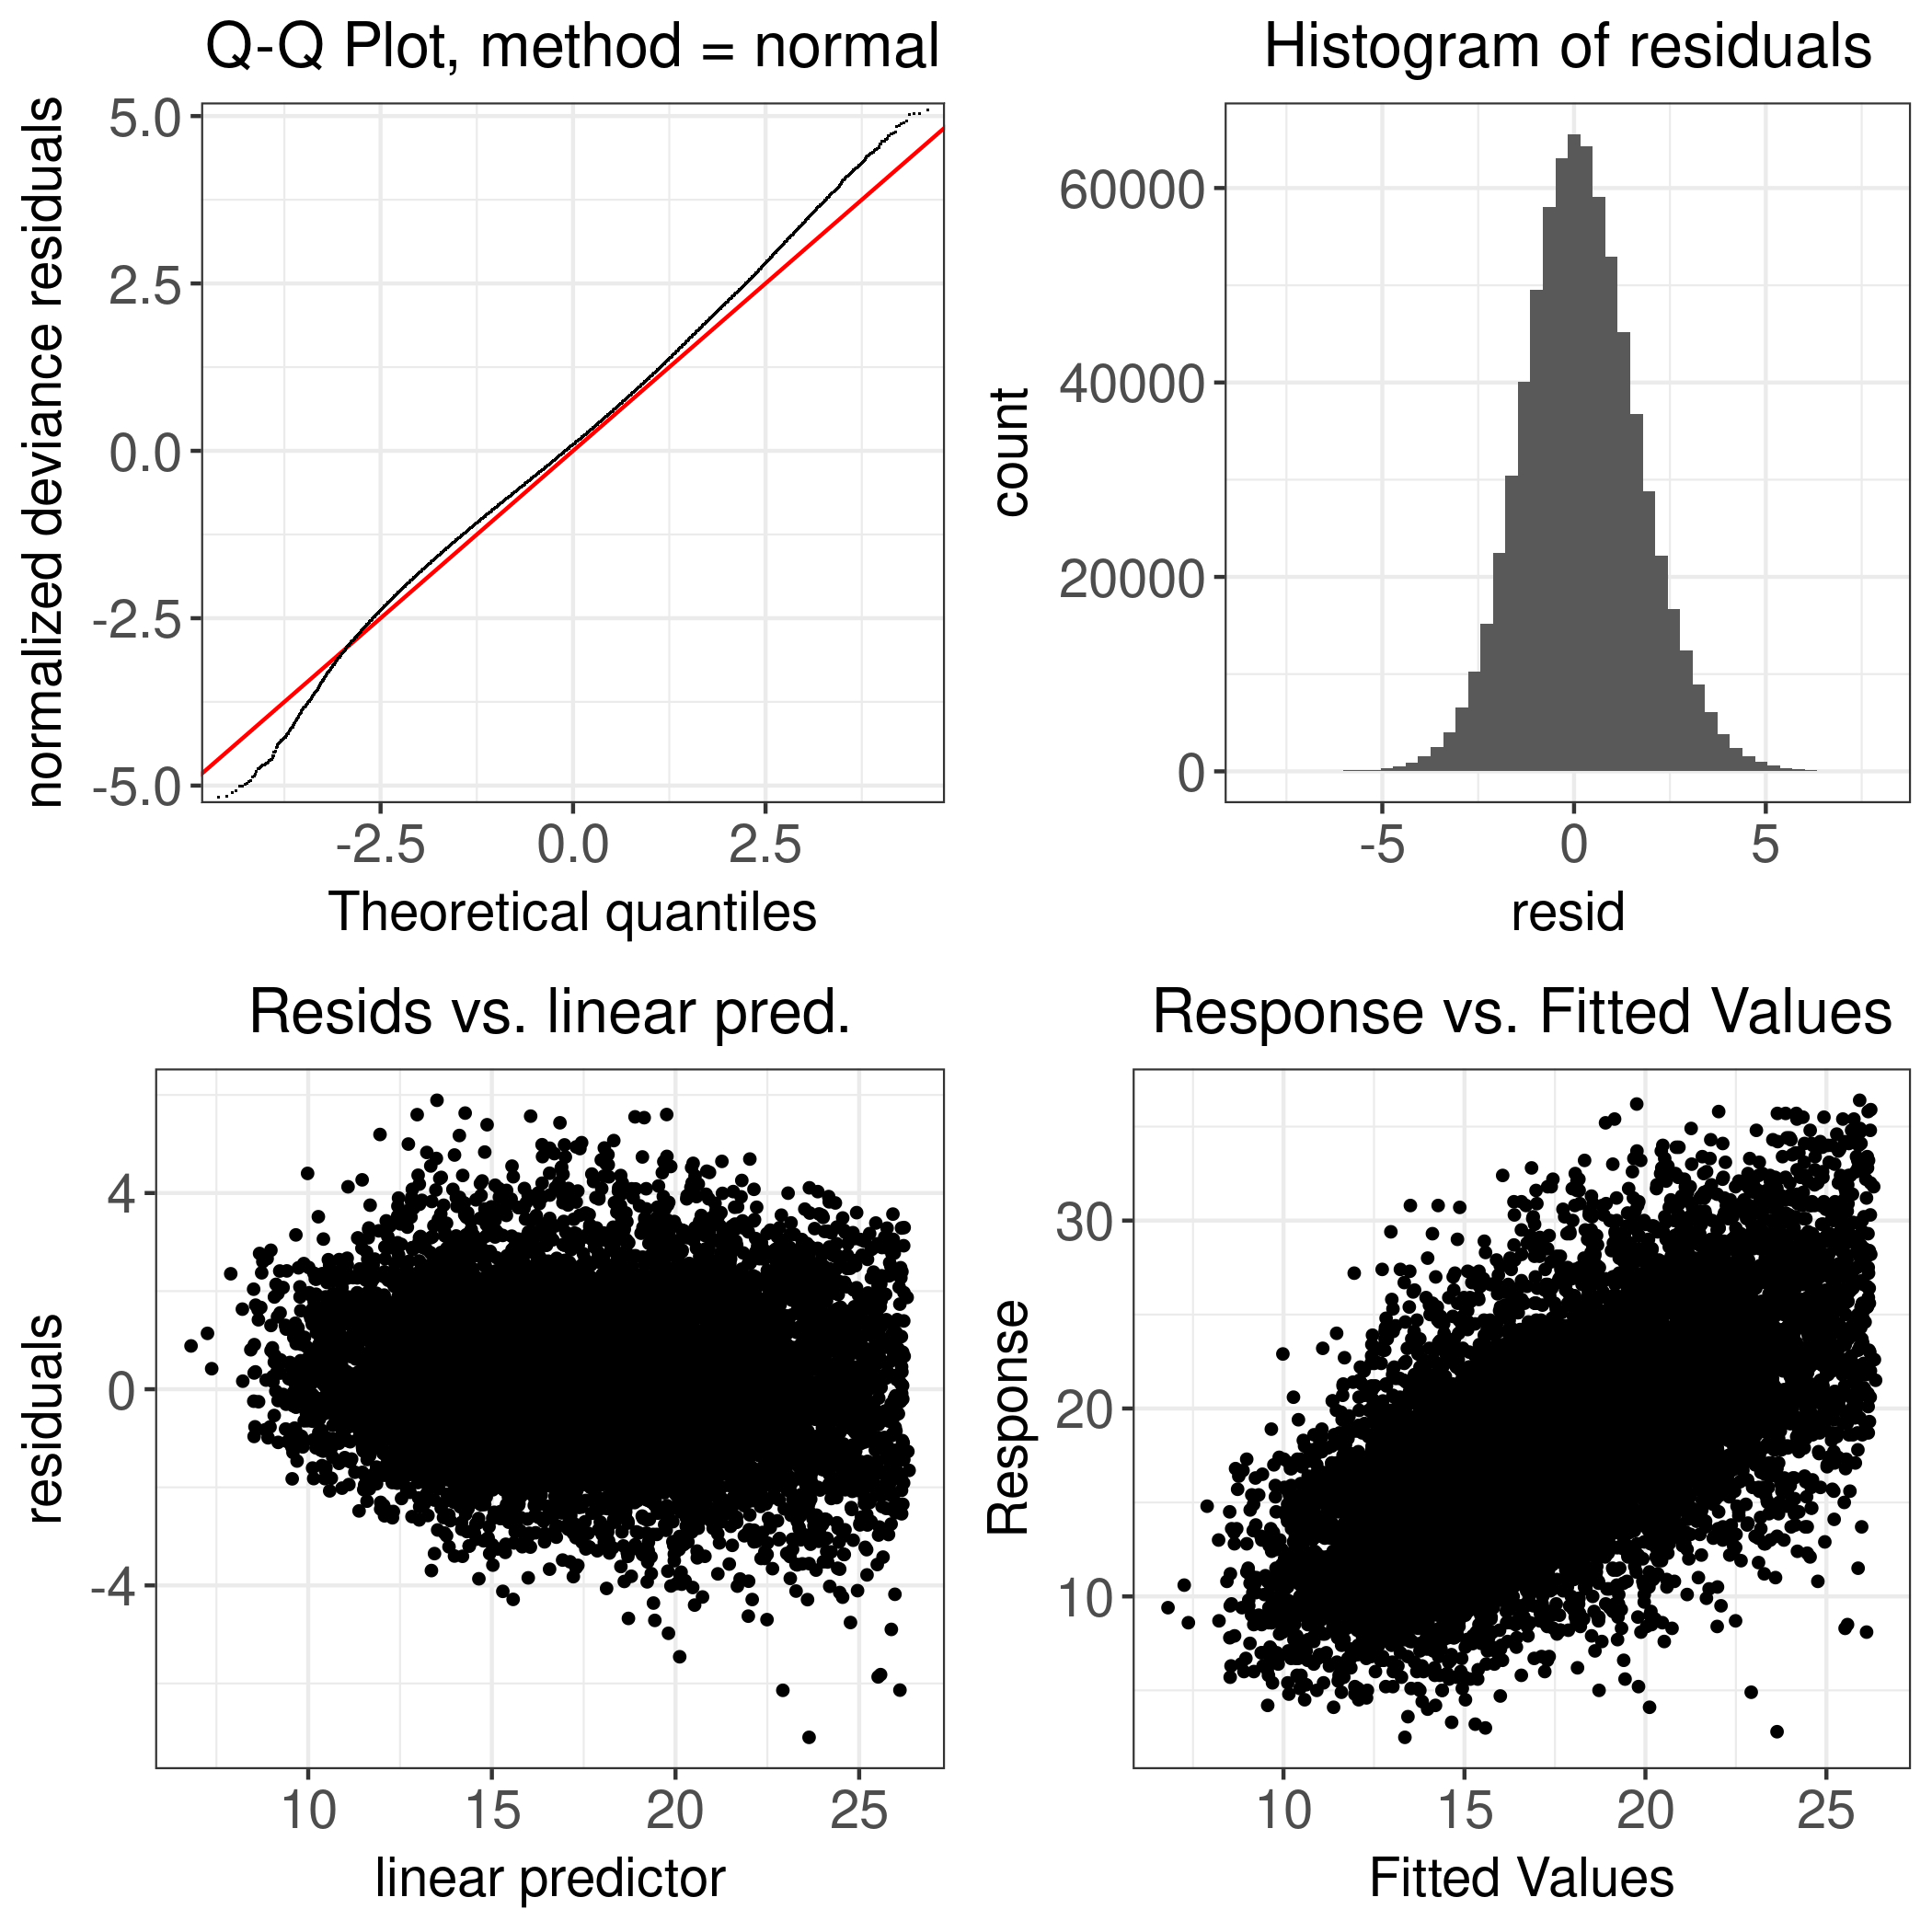
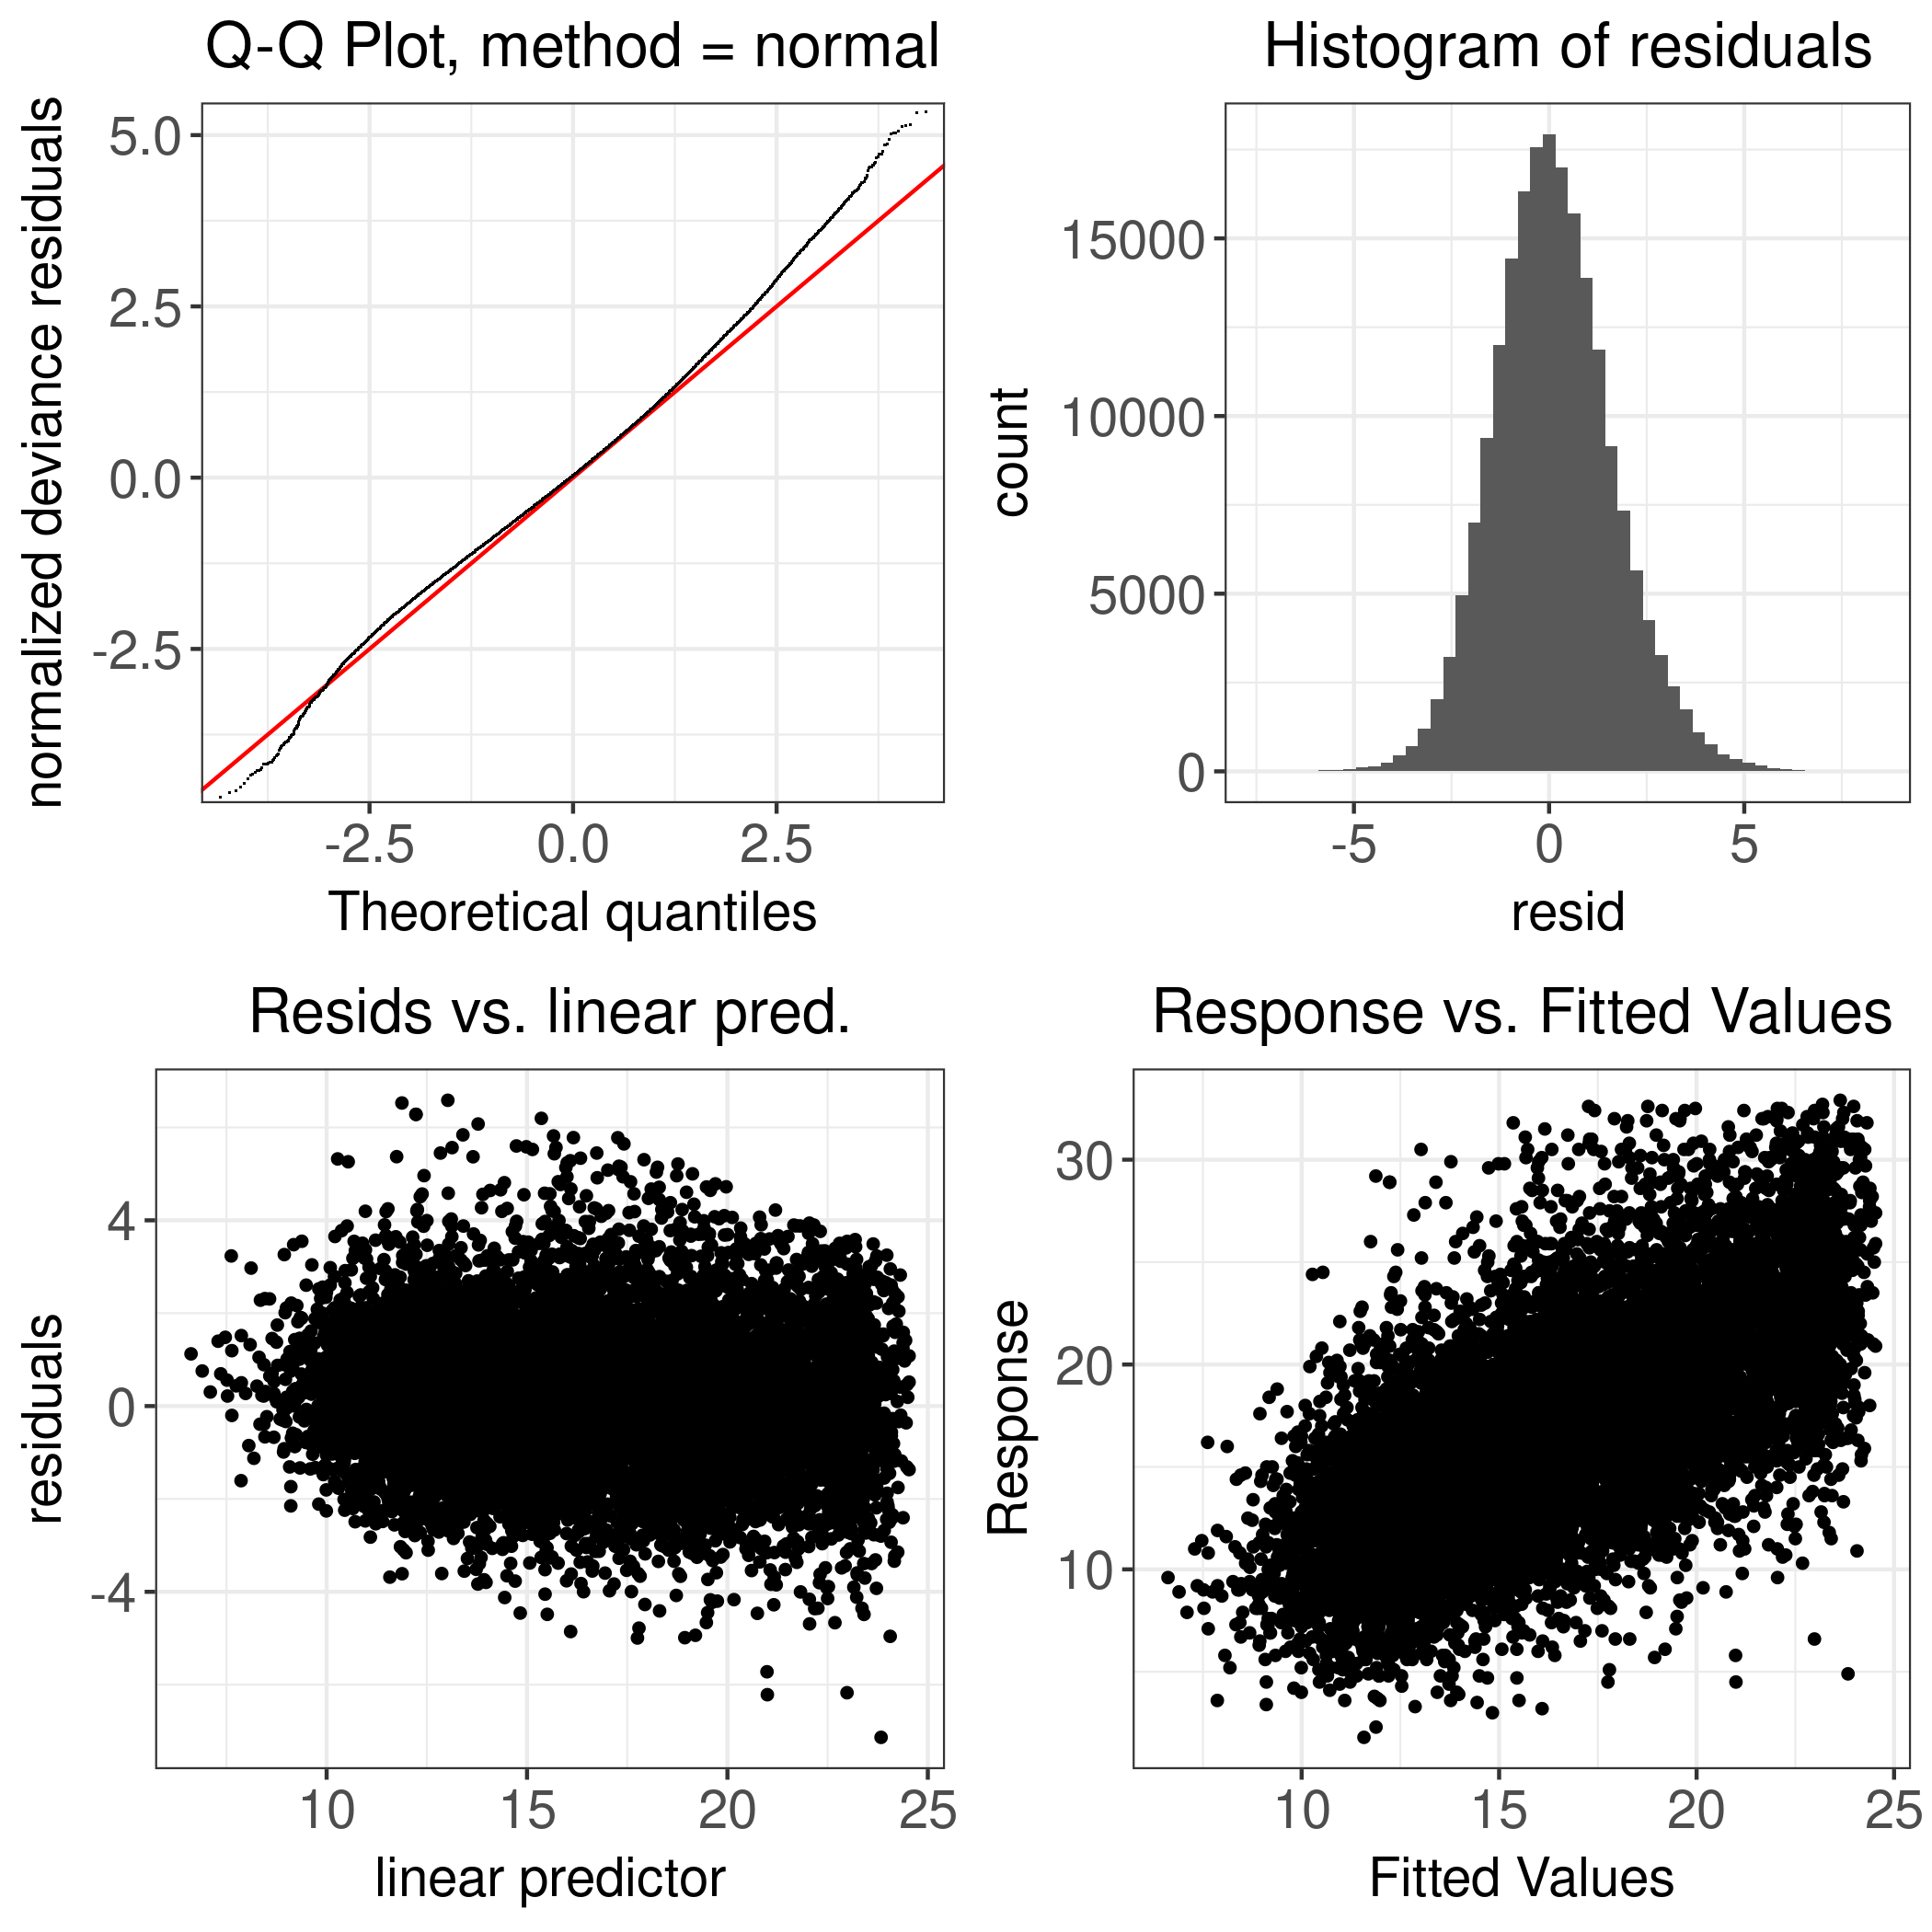
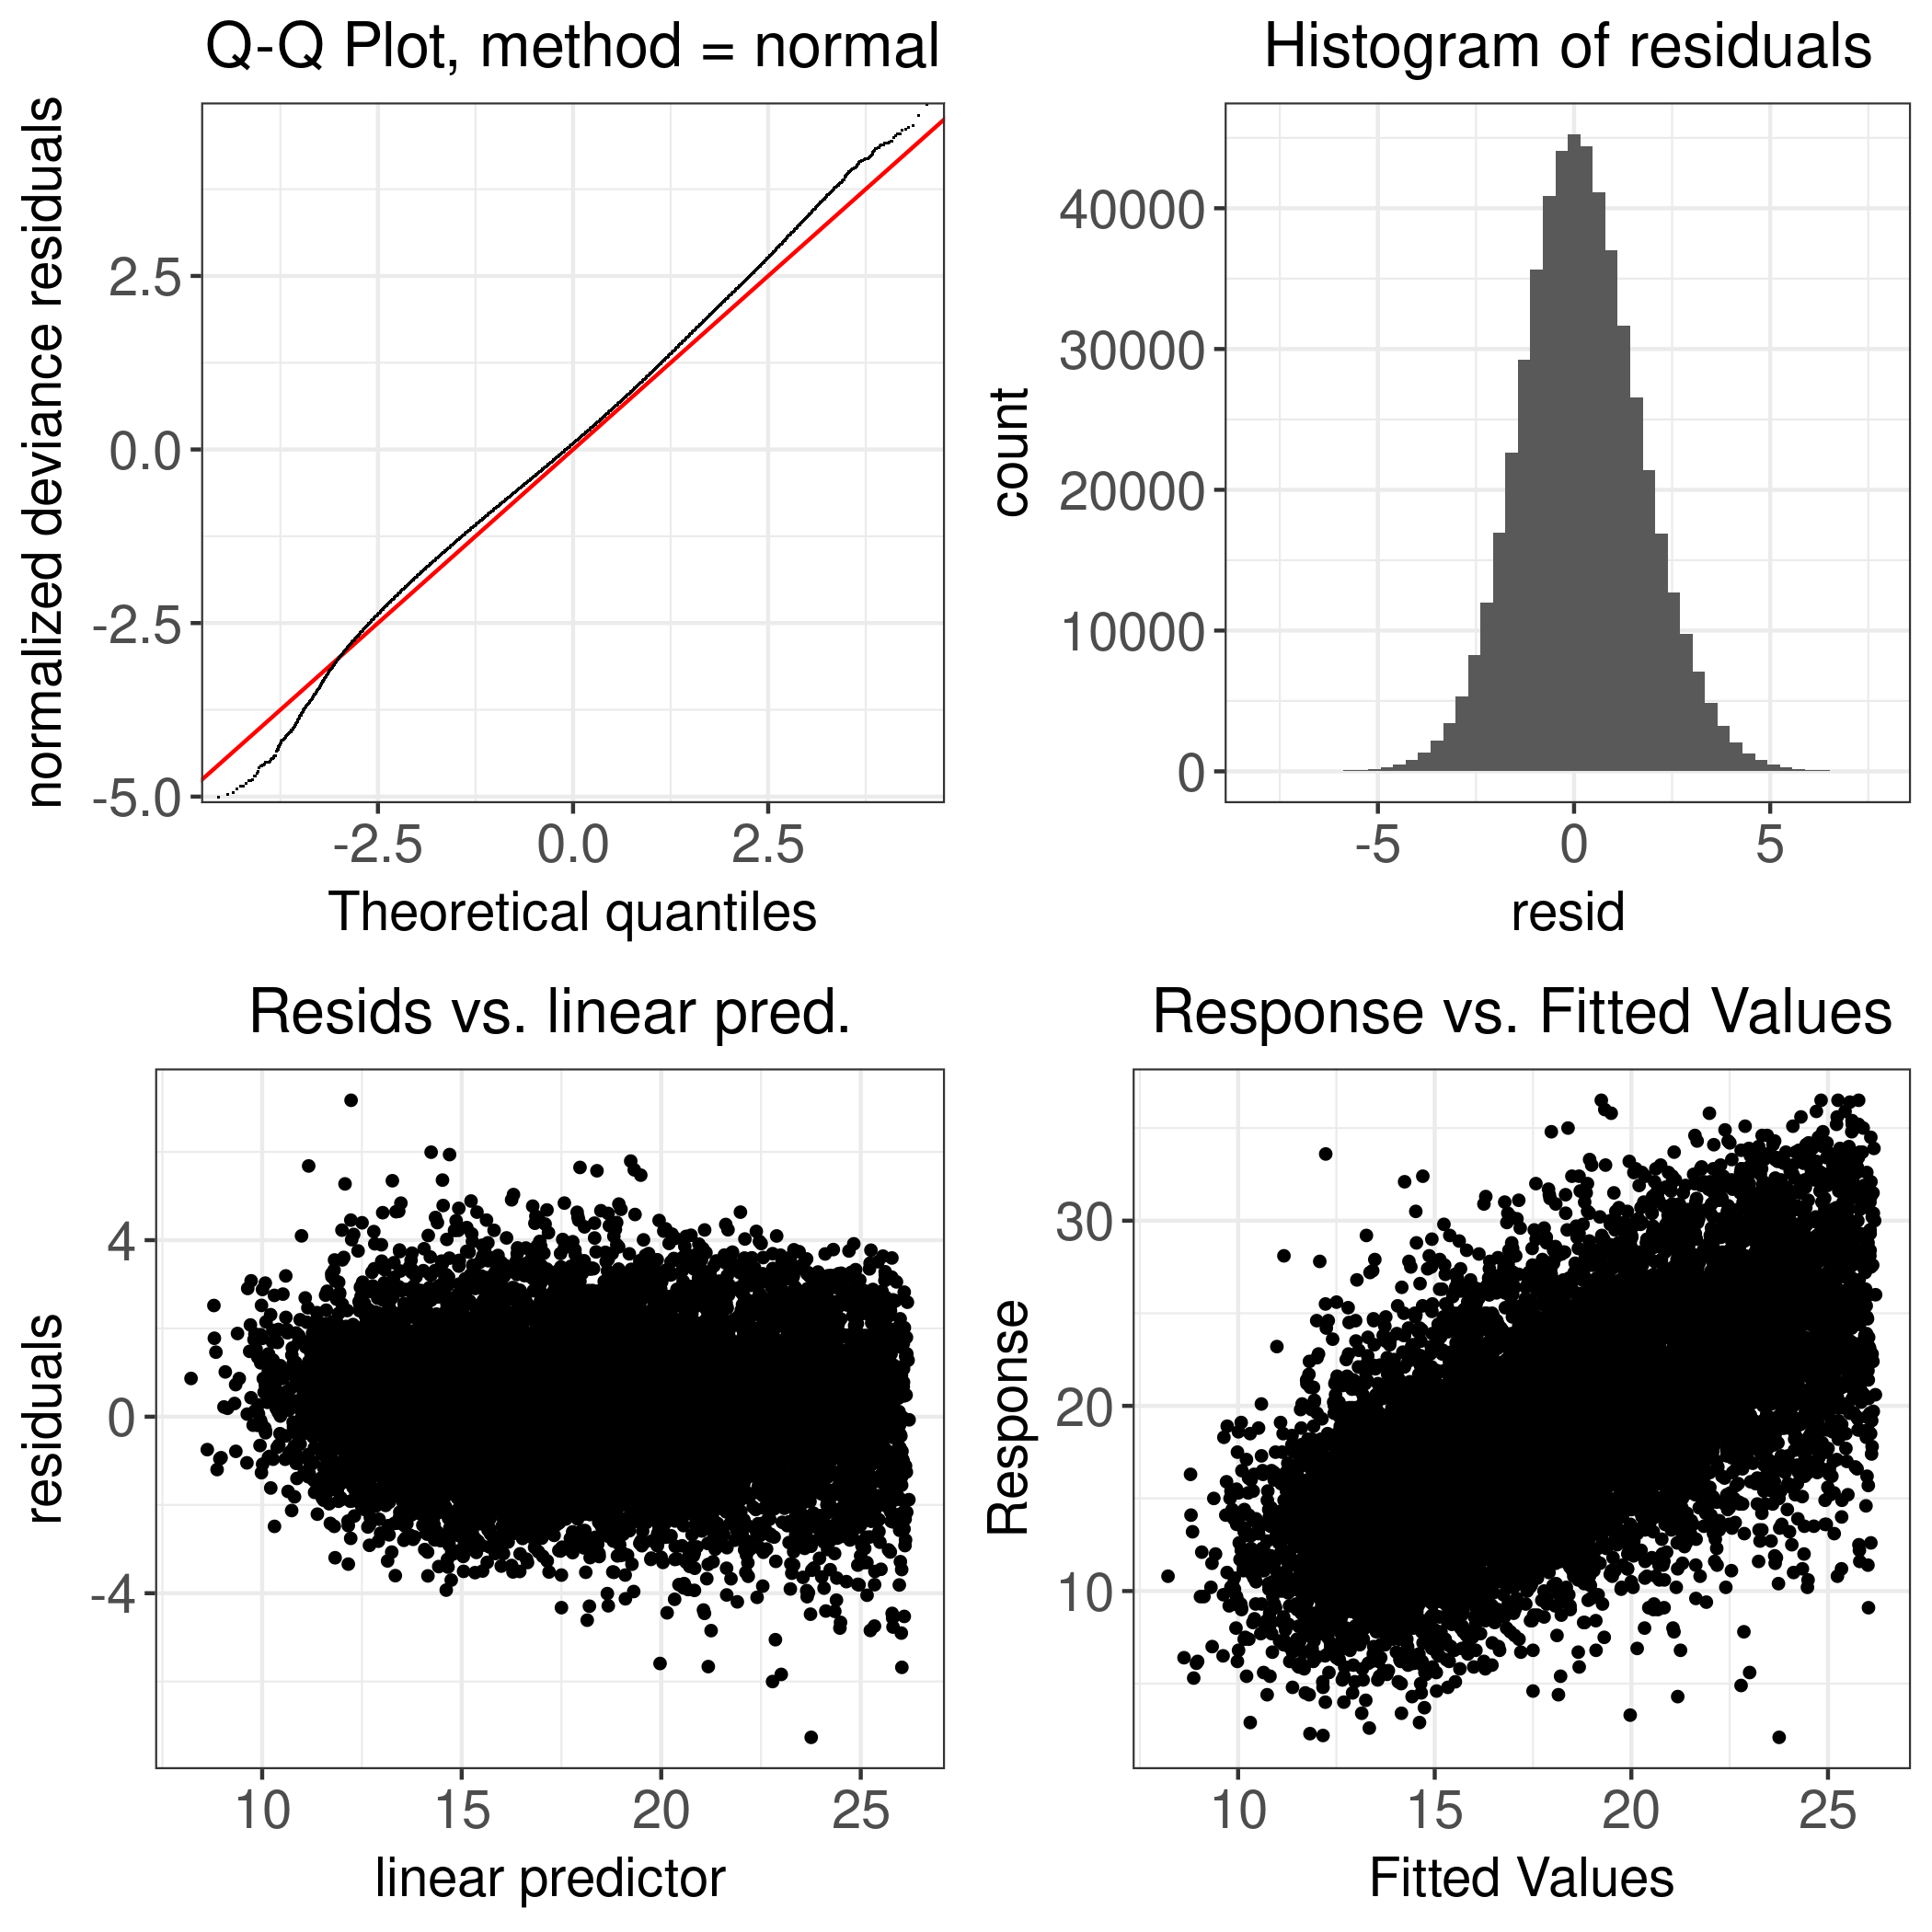
Model Diagnostics
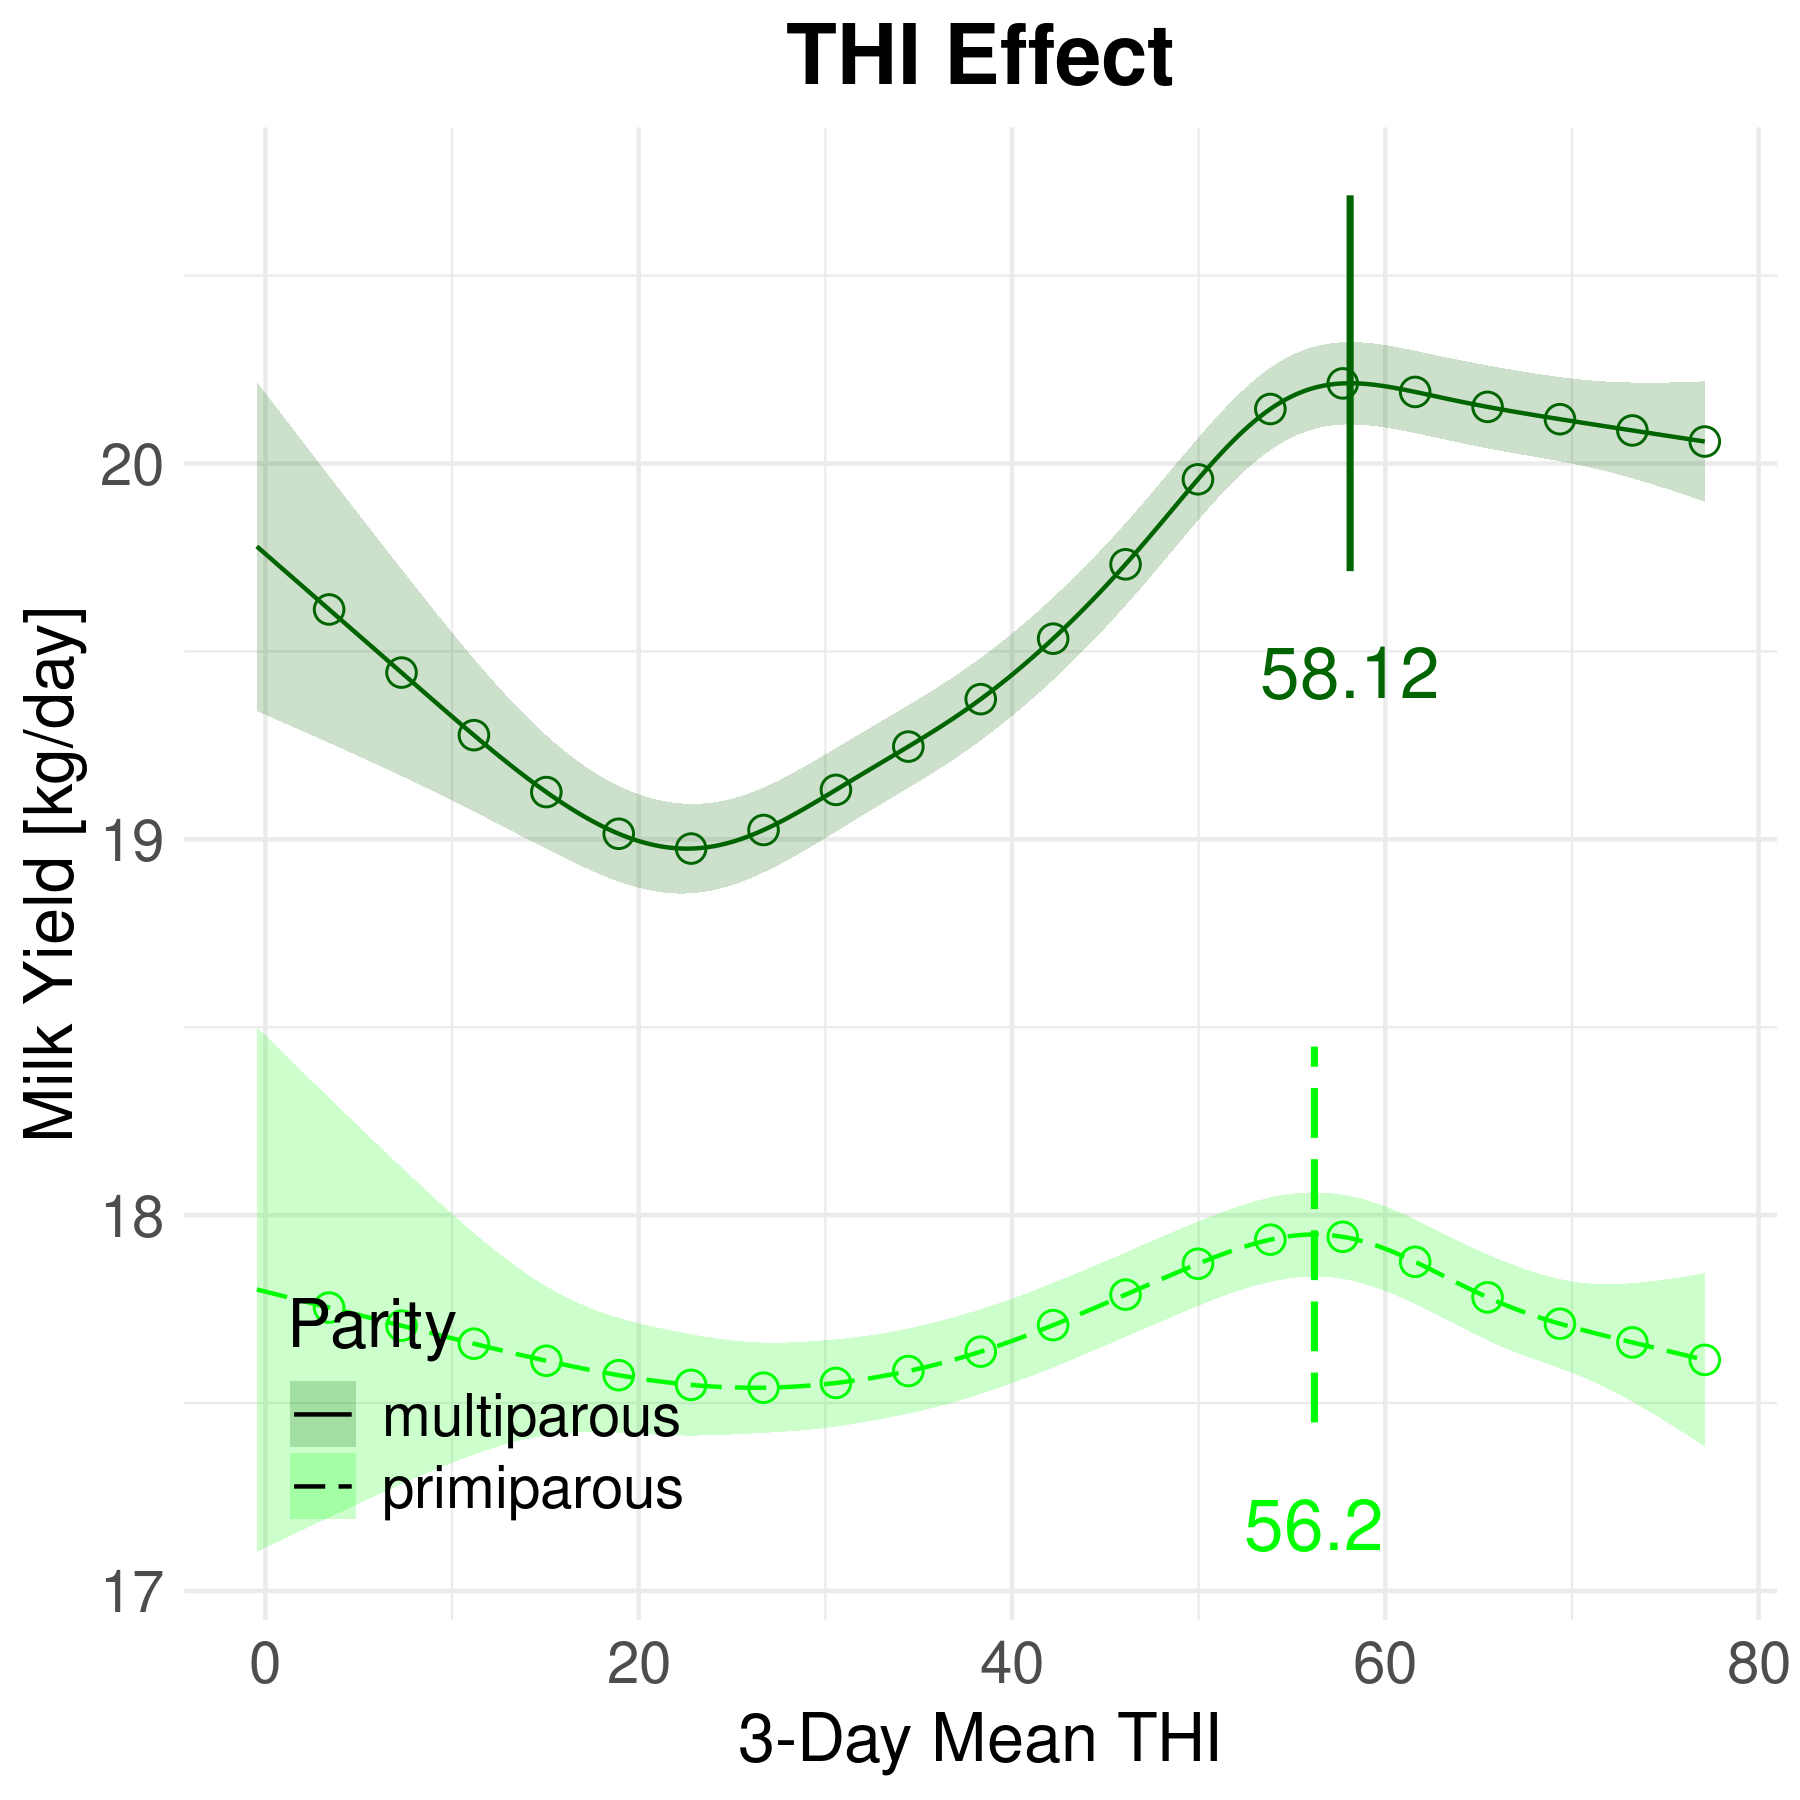
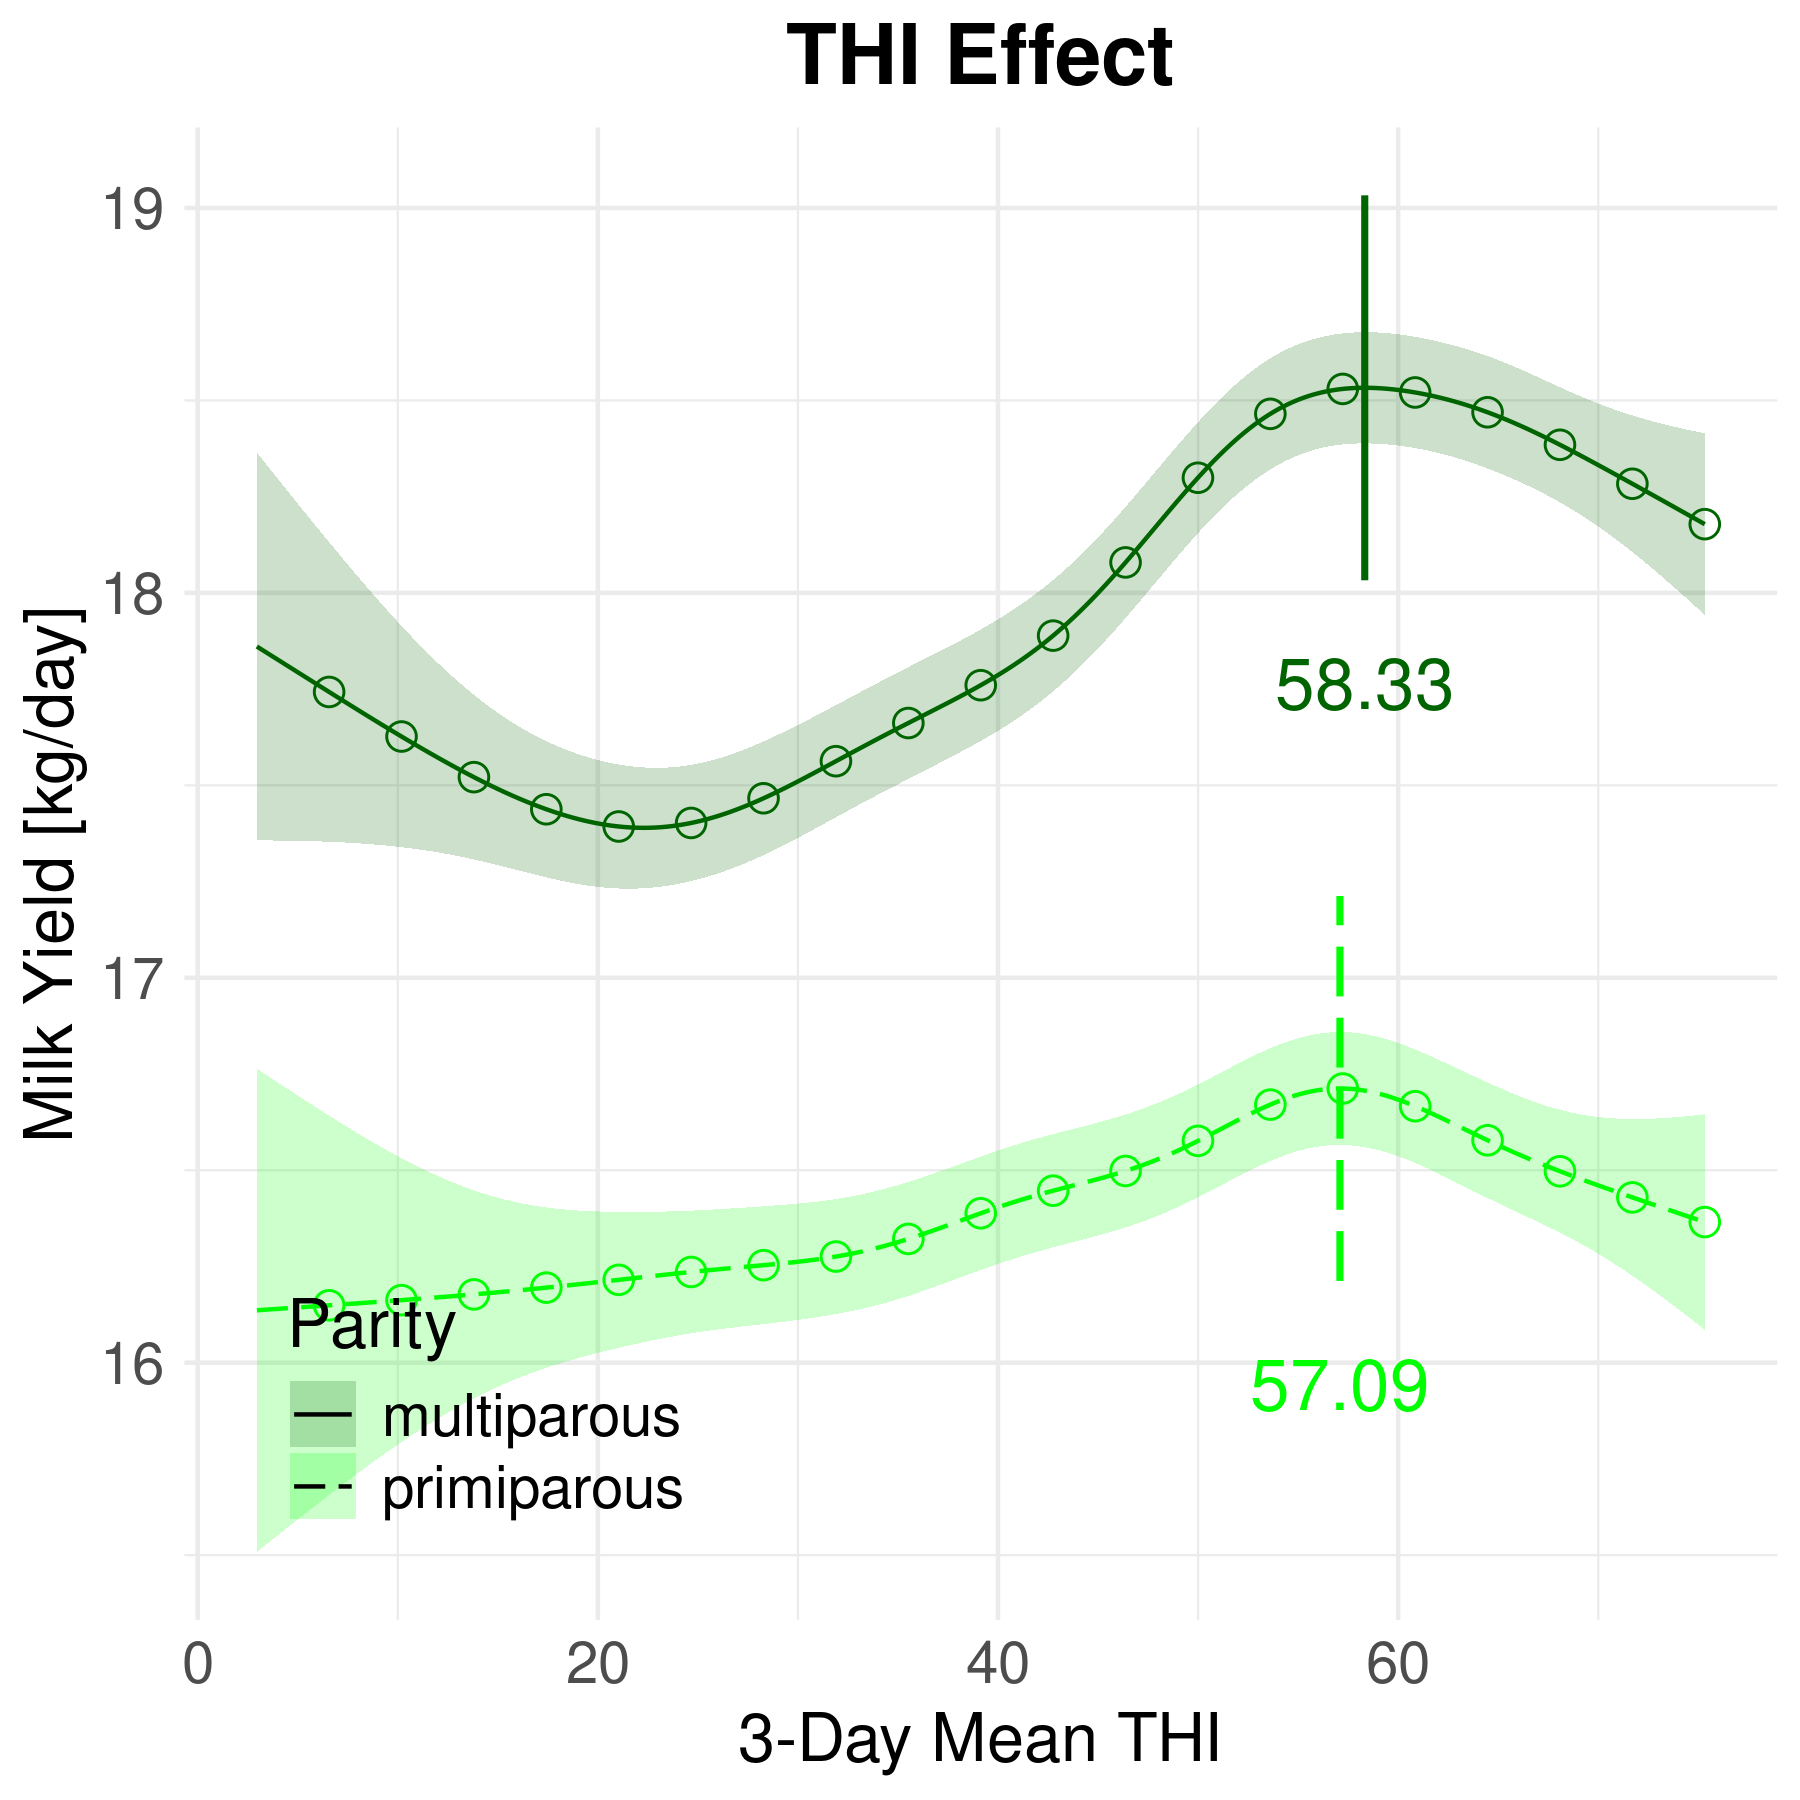
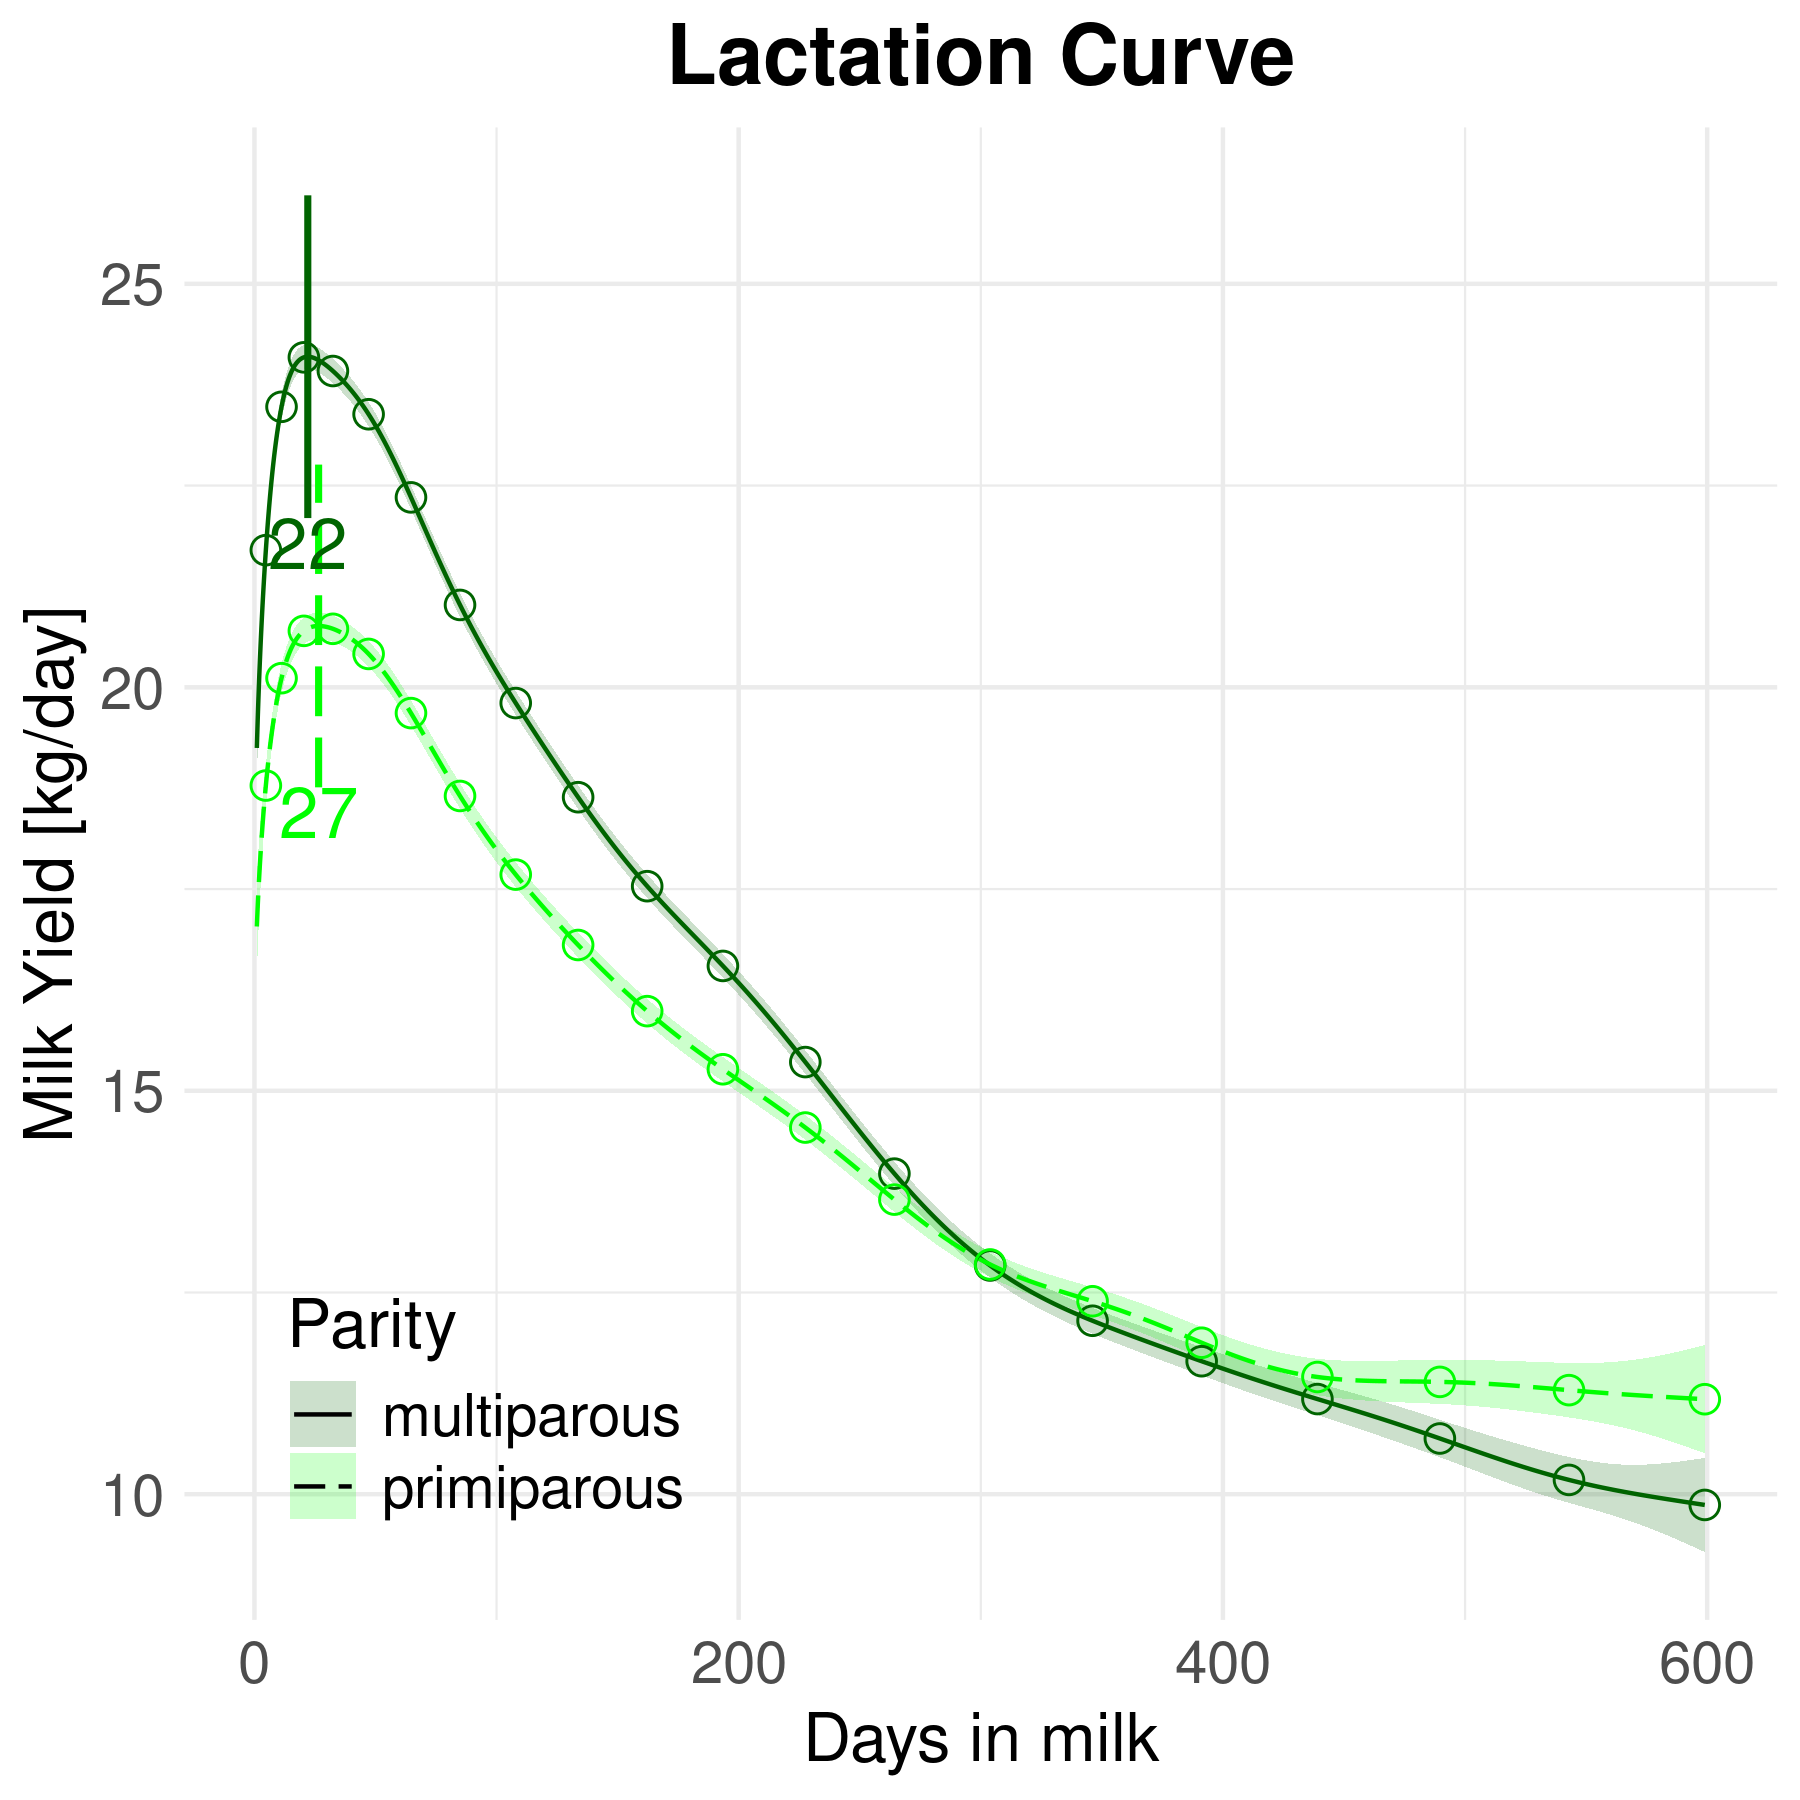
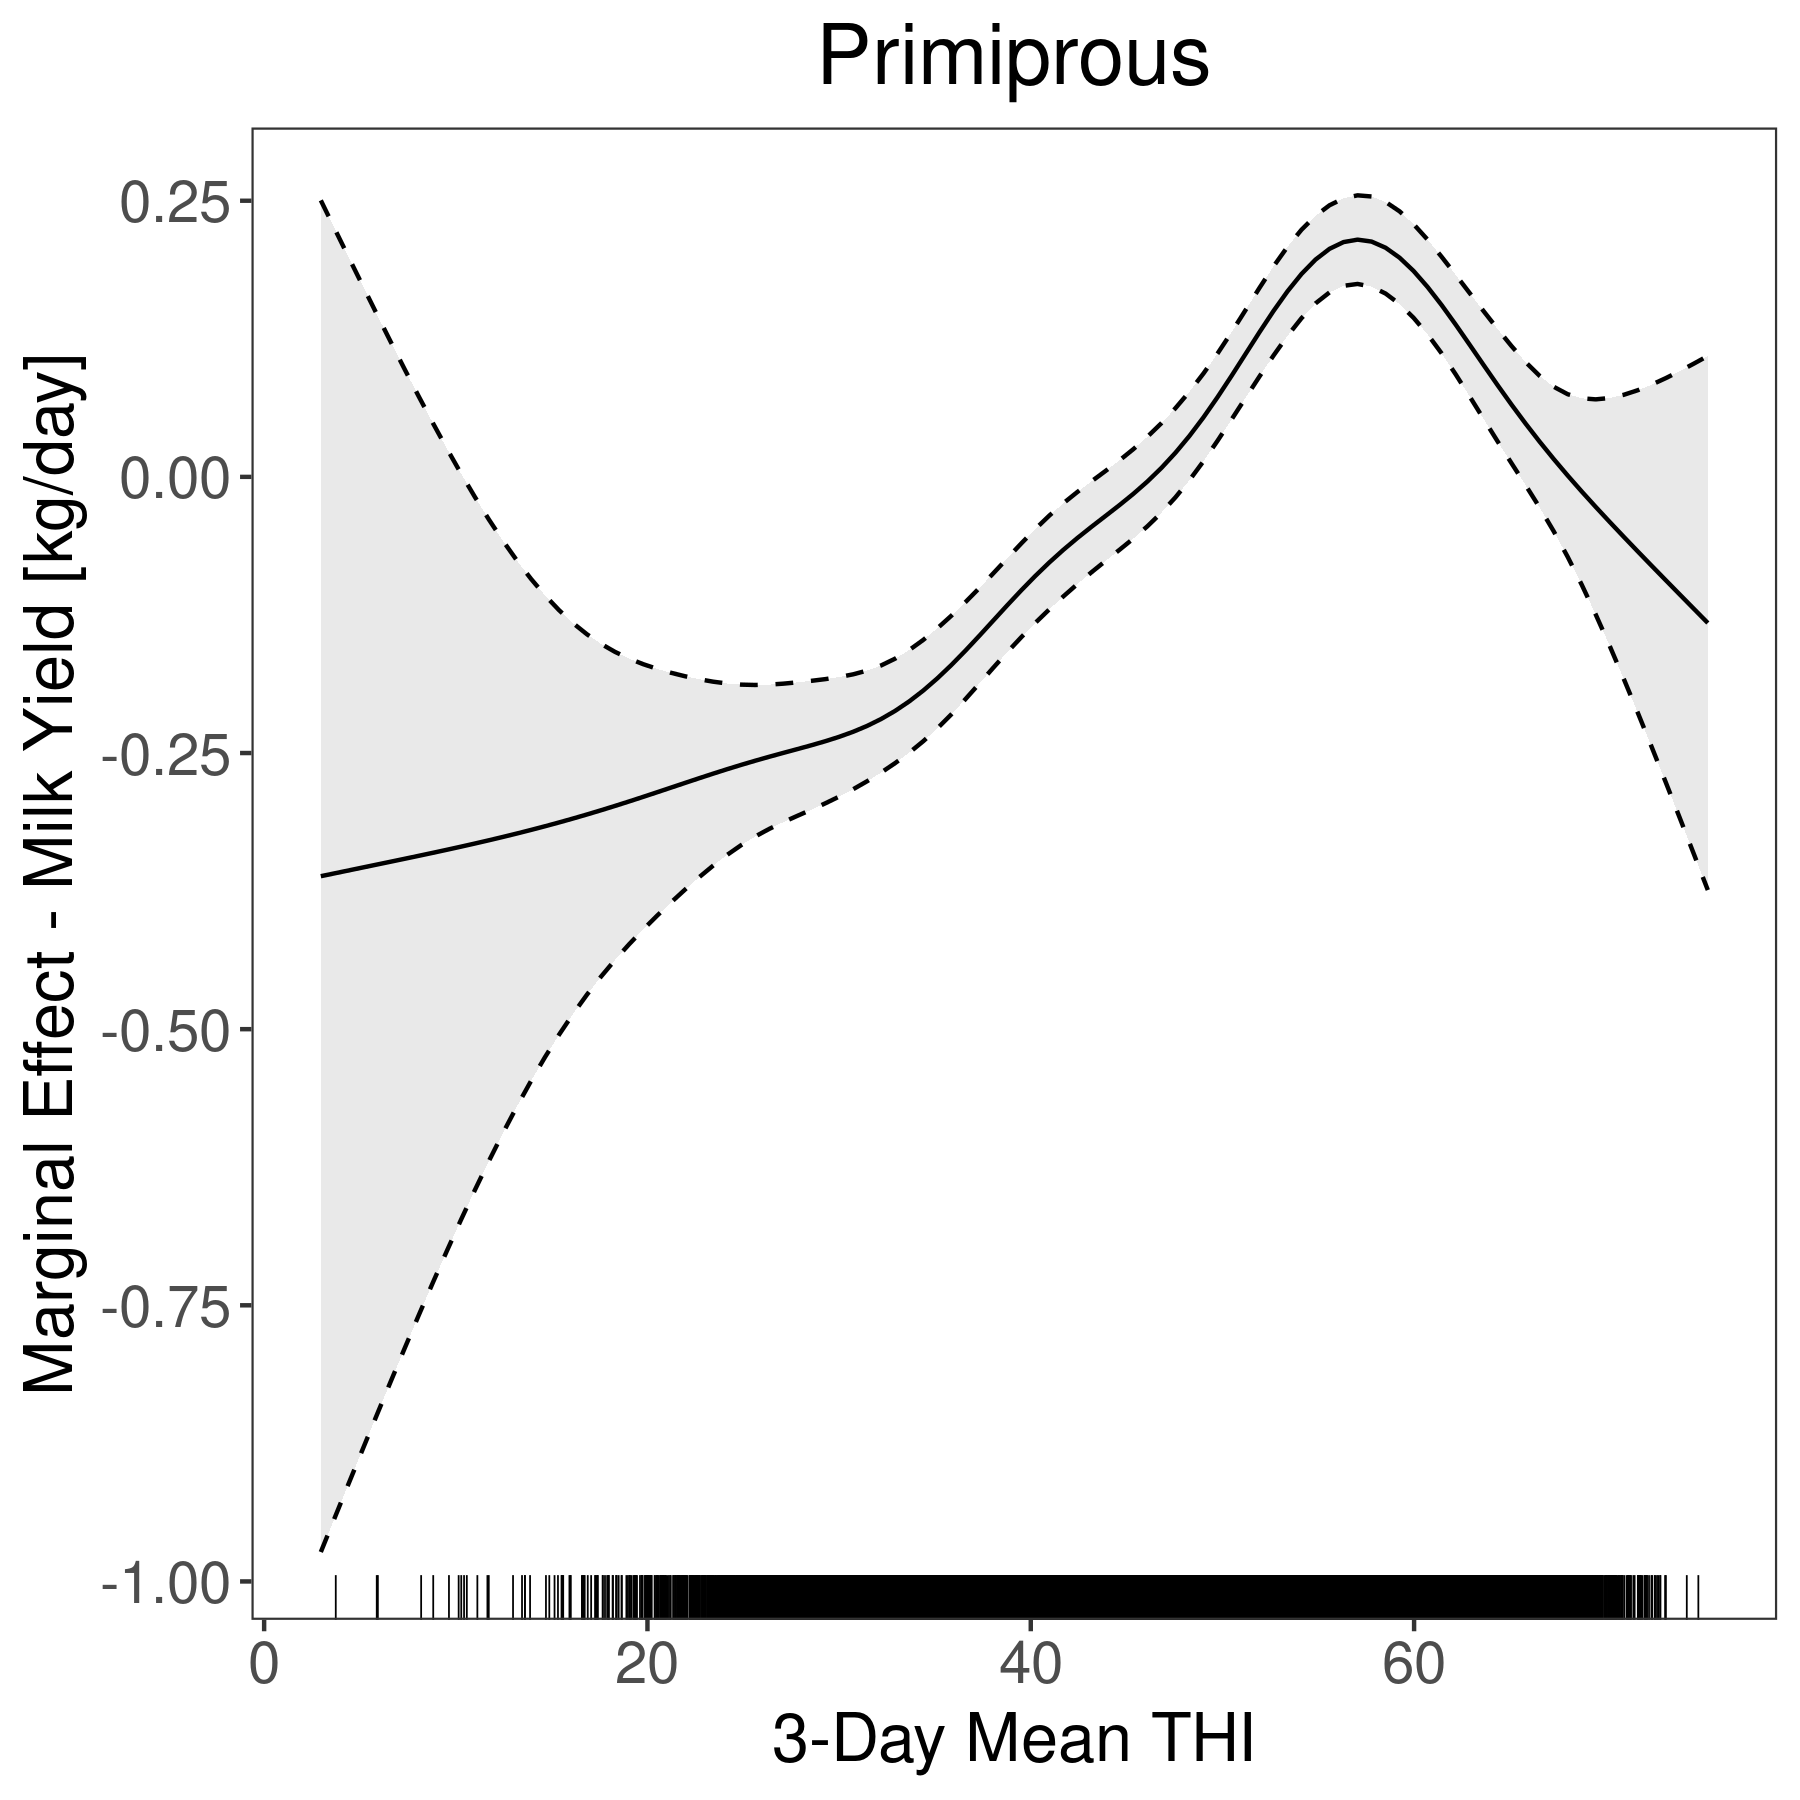
THI Effect and Lactation Curve

D.11.2: Split Period: Until 2010 - After 2010
D.11.2.1: Split Period: 1998 - 2010
Model Summary
| A. parametric coefficients | Estimate | Std. Error | t-value | p-value |
|---|---|---|---|---|
| (Intercept) | 13.8464 | 0.6158 | 22.4846 | \(< 0.0001\) |
| parityprimiparous | -1.5962 | 0.0195 | -81.7385 | \(< 0.0001\) |
| year1999 | -0.4670 | 0.6855 | -0.6812 | 0.4958 |
| year2000 | 0.2987 | 0.6751 | 0.4424 | 0.6582 |
| year2001 | 0.9551 | 0.6524 | 1.4639 | 0.1432 |
| year2002 | 1.5417 | 0.6531 | 2.3604 | 0.0183 |
| year2003 | 2.0455 | 0.6455 | 3.1688 | 0.0015 |
| year2004 | 2.6115 | 0.6385 | 4.0902 | \(< 0.0001\) |
| year2005 | 2.8675 | 0.6331 | 4.5293 | \(< 0.0001\) |
| year2006 | 3.2272 | 0.6297 | 5.1248 | \(< 0.0001\) |
| year2007 | 3.1239 | 0.6291 | 4.9658 | \(< 0.0001\) |
| year2008 | 3.4796 | 0.6295 | 5.5276 | \(< 0.0001\) |
| year2009 | 3.8885 | 0.6287 | 6.1845 | \(< 0.0001\) |
| year2010 | 4.2474 | 0.6261 | 6.7842 | \(< 0.0001\) |
| B. smooth terms | edf | Ref.df | F-value | p-value |
|---|---|---|---|---|
| s(thi_mean_t0_3d):paritymultiparous | 7.4687 | 7.4687 | 367.5611 | \(< 0.0001\) |
| s(thi_mean_t0_3d):parityprimiparous | 5.9291 | 5.9291 | 31.4722 | \(< 0.0001\) |
| s(days_in_milk_t):paritymultiparous | 13.9600 | 13.9600 | 17839.8816 | \(< 0.0001\) |
| s(days_in_milk_t):parityprimiparous | 12.8822 | 12.8822 | 3856.3426 | \(< 0.0001\) |
| Smooth Term Fixed Effect | Est. | SE | z | p |
|---|---|---|---|---|
| s(thi_mean_t0_3d):multiFx1 | 0.3833 | 0.1433 | 2.68 | 0.0075 |
| s(thi_mean_t0_3d):primiFx1 | 0.0868 | 0.1631 | 0.53 | 0.5943 |
| s(days_in_milk_):multiFx1 | 4.2188 | 0.6749 | 6.25 | \(< 1e-09\) |
| s(days_in_milk_):primiFx1 | 3.1564 | 0.7455 | 4.23 | \(< 1e-04\) |
| Variance Component | Estimated \( \sigma \) | |||
|---|---|---|---|---|
| \( \sigma_\alpha\) | 0.9524 | |||
| \( \sigma_\iota\) | 2.2355 | |||
| \( \sigma_\phi\) | 2.6202 | |||
| s(thi_mean_t0_3d):multi | 1.8172 | |||
| s(days_in_milk_):primi | 7.1500 | |||
| s(days_in_milk_):multi | 9.1468 | |||
| s(thi_mean_t0_3d):primi | 1.3871 | |||
| Residual | 2.6539 |
Model Diagnostics
THI Effect and Lactation Curve

D.11.2.2: Split Period: 2010 - 2023
Model Summary
| A. parametric coefficients | Estimate | Std. Error | t-value | p-value |
|---|---|---|---|---|
| (Intercept) | 16.9374 | 0.1584 | 106.9310 | \(< 0.0001\) |
| parityprimiparous | -2.0885 | 0.0163 | -128.1973 | \(< 0.0001\) |
| year2012 | 0.2060 | 0.1796 | 1.1471 | 0.2513 |
| year2013 | 0.2842 | 0.2108 | 1.3481 | 0.1776 |
| year2014 | 0.8749 | 0.2054 | 4.2601 | \(< 0.0001\) |
| year2015 | 0.9939 | 0.2045 | 4.8606 | \(< 0.0001\) |
| year2016 | 1.2244 | 0.1932 | 6.3379 | \(< 0.0001\) |
| year2017 | 1.6126 | 0.1992 | 8.0952 | \(< 0.0001\) |
| year2018 | 1.9356 | 0.1895 | 10.2118 | \(< 0.0001\) |
| year2019 | 2.2870 | 0.1840 | 12.4266 | \(< 0.0001\) |
| year2020 | 2.5084 | 0.2001 | 12.5361 | \(< 0.0001\) |
| year2021 | 2.5636 | 0.1994 | 12.8587 | \(< 0.0001\) |
| year2022 | 2.5237 | 0.2008 | 12.5669 | \(< 0.0001\) |
| year2023 | 2.6125 | 0.1791 | 14.5866 | \(< 0.0001\) |
| B. smooth terms | edf | Ref.df | F-value | p-value |
|---|---|---|---|---|
| s(thi_mean_t0_3d):paritymultiparous | 8.1013 | 8.1013 | 856.5674 | \(< 0.0001\) |
| s(thi_mean_t0_3d):parityprimiparous | 5.9065 | 5.9065 | 53.5215 | \(< 0.0001\) |
| s(days_in_milk_t):paritymultiparous | 14.5129 | 14.5129 | 42118.2414 | \(< 0.0001\) |
| s(days_in_milk_t):parityprimiparous | 13.6452 | 13.6452 | 5835.7977 | \(< 0.0001\) |
| Smooth Term Fixed Effect | Est. | SE | z | p |
|---|---|---|---|---|
| s(thi_mean_t0_3d):multiFx1 | -0.3112 | 0.1041 | -2.99 | 0.0028 |
| s(thi_mean_t0_3d):primiFx1 | -0.1658 | 0.1121 | -1.48 | 0.1391 |
| s(days_in_milk_):multiFx1 | 4.7696 | 0.4524 | 10.54 | \(< 1e-25\) |
| s(days_in_milk_):primiFx1 | 3.9223 | 0.6090 | 6.44 | \(< 1e-09\) |
| Variance Component | Estimated \( \sigma \) | |||
|---|---|---|---|---|
| \( \sigma_\alpha\) | 2.3907 | |||
| \( \sigma_\iota\) | 0.9756 | |||
| \( \sigma_\phi\) | 3.1309 | |||
| s(thi_mean_t0_3d):multi | 1.9309 | |||
| s(days_in_milk_):primi | 7.4722 | |||
| s(days_in_milk_):multi | 9.2408 | |||
| s(thi_mean_t0_3d):primi | 1.0857 | |||
| Residual | 2.9808 |
Model Diagnostics
THI Effect and Lactation Curve