Appendix C: Split Period: Until 2010 - After 2010

Appendix C: Split Period: Until 2010 - After 2010

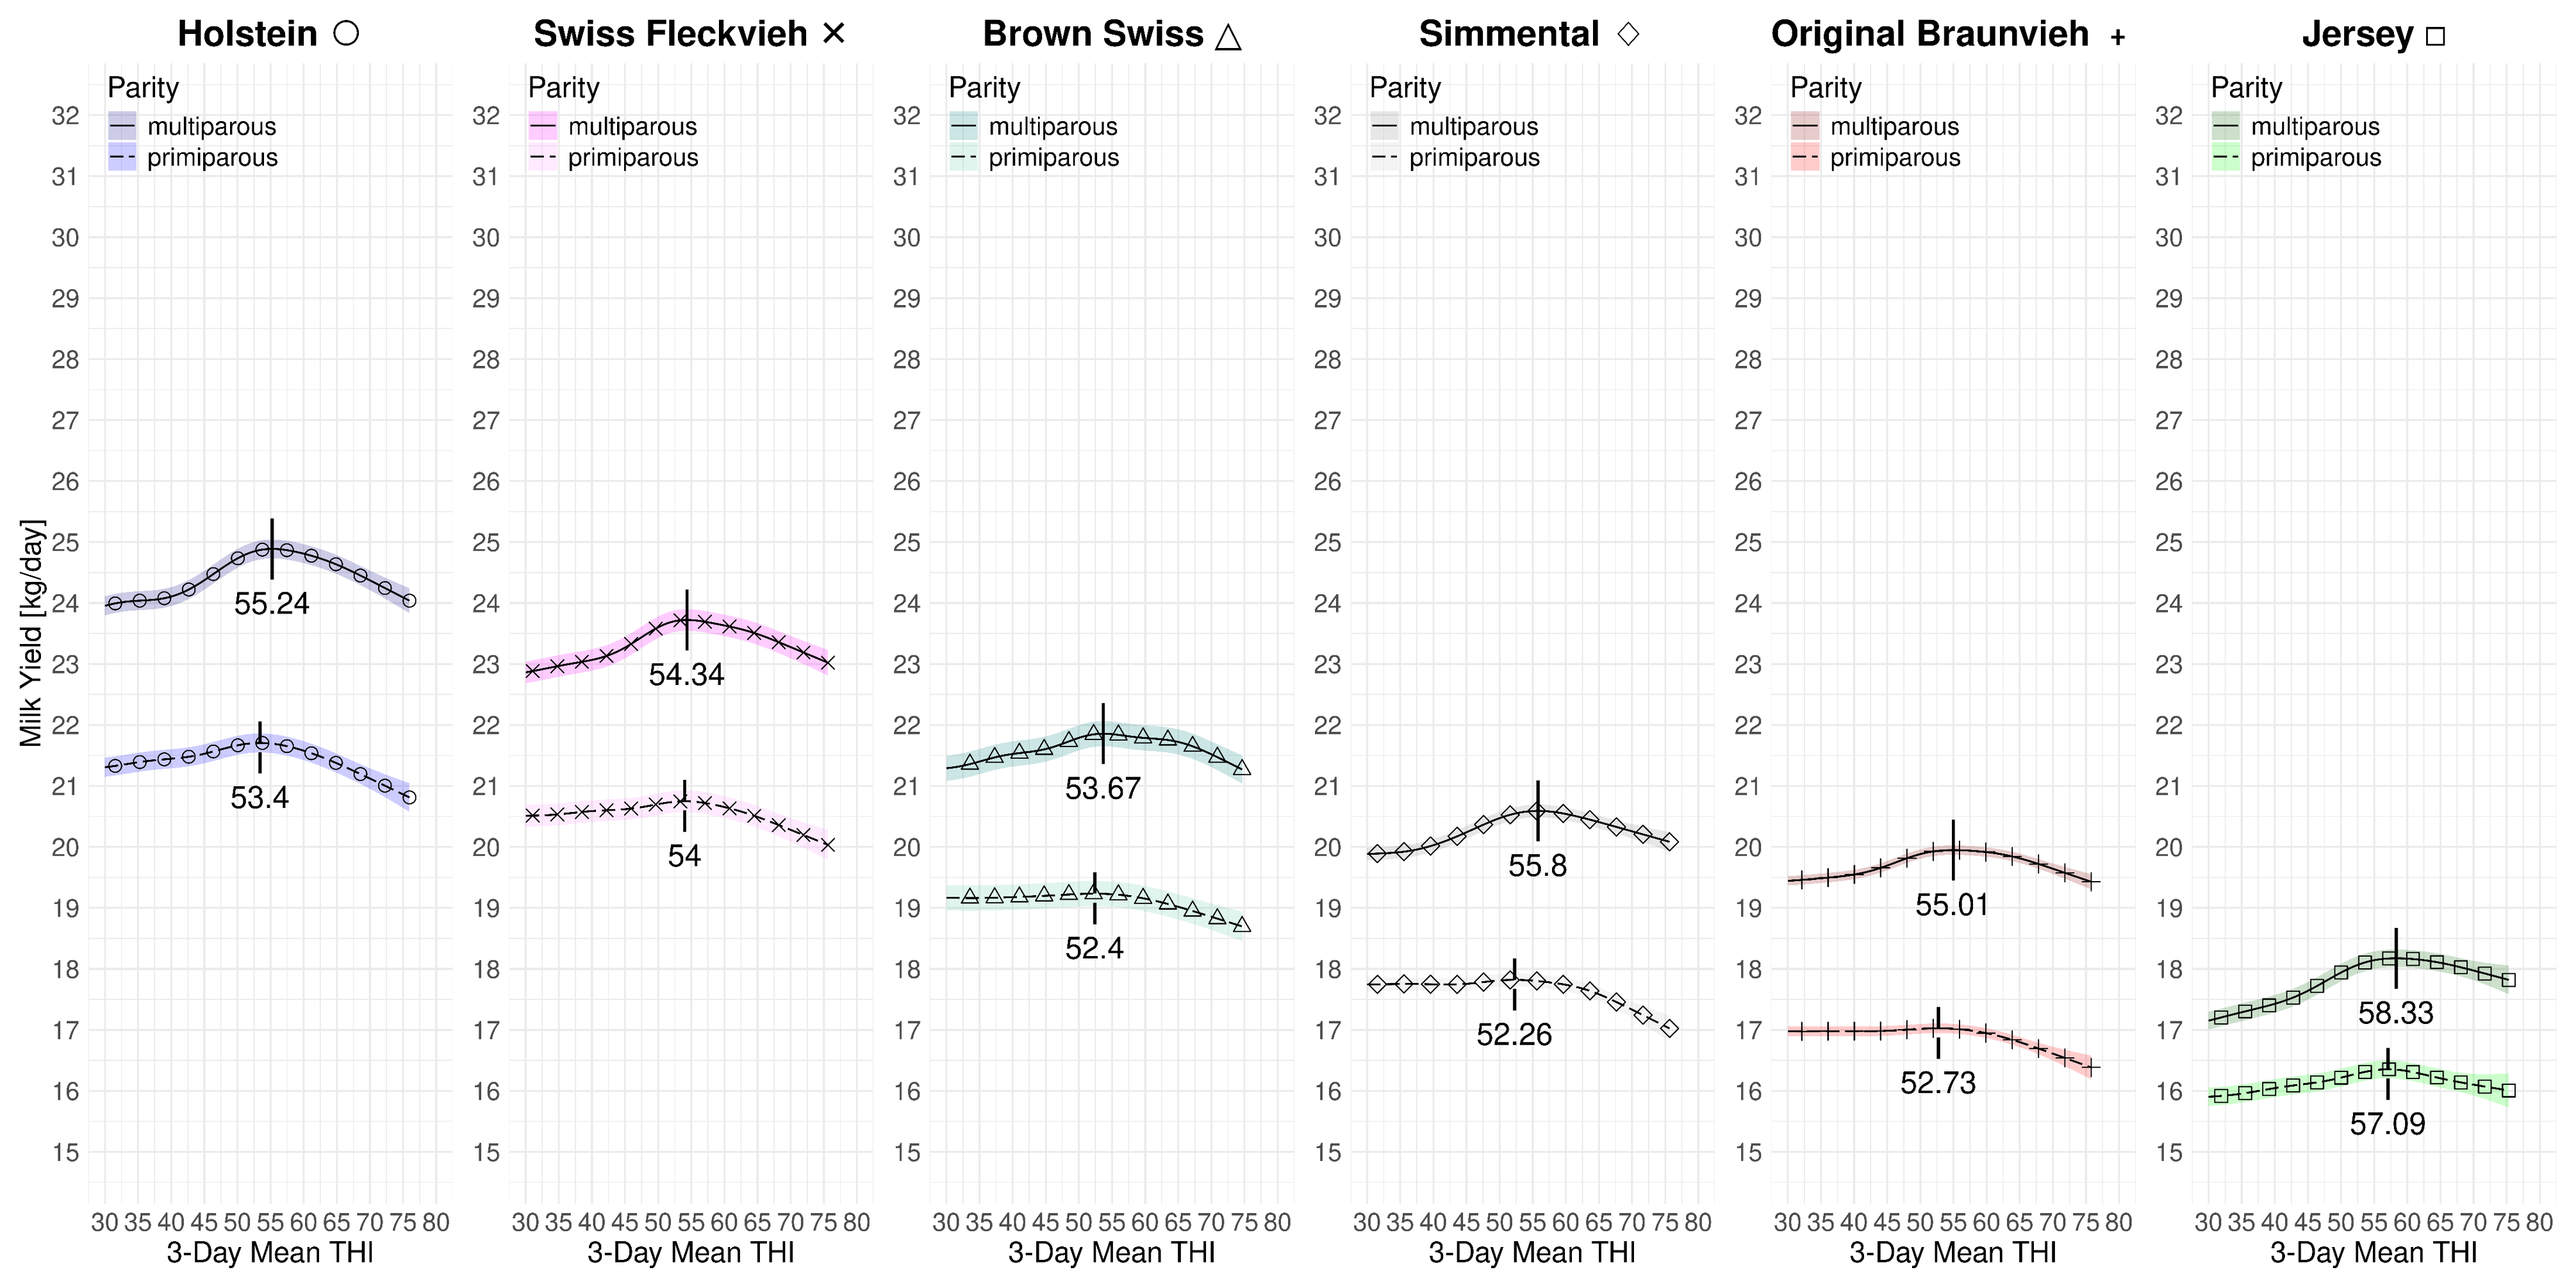
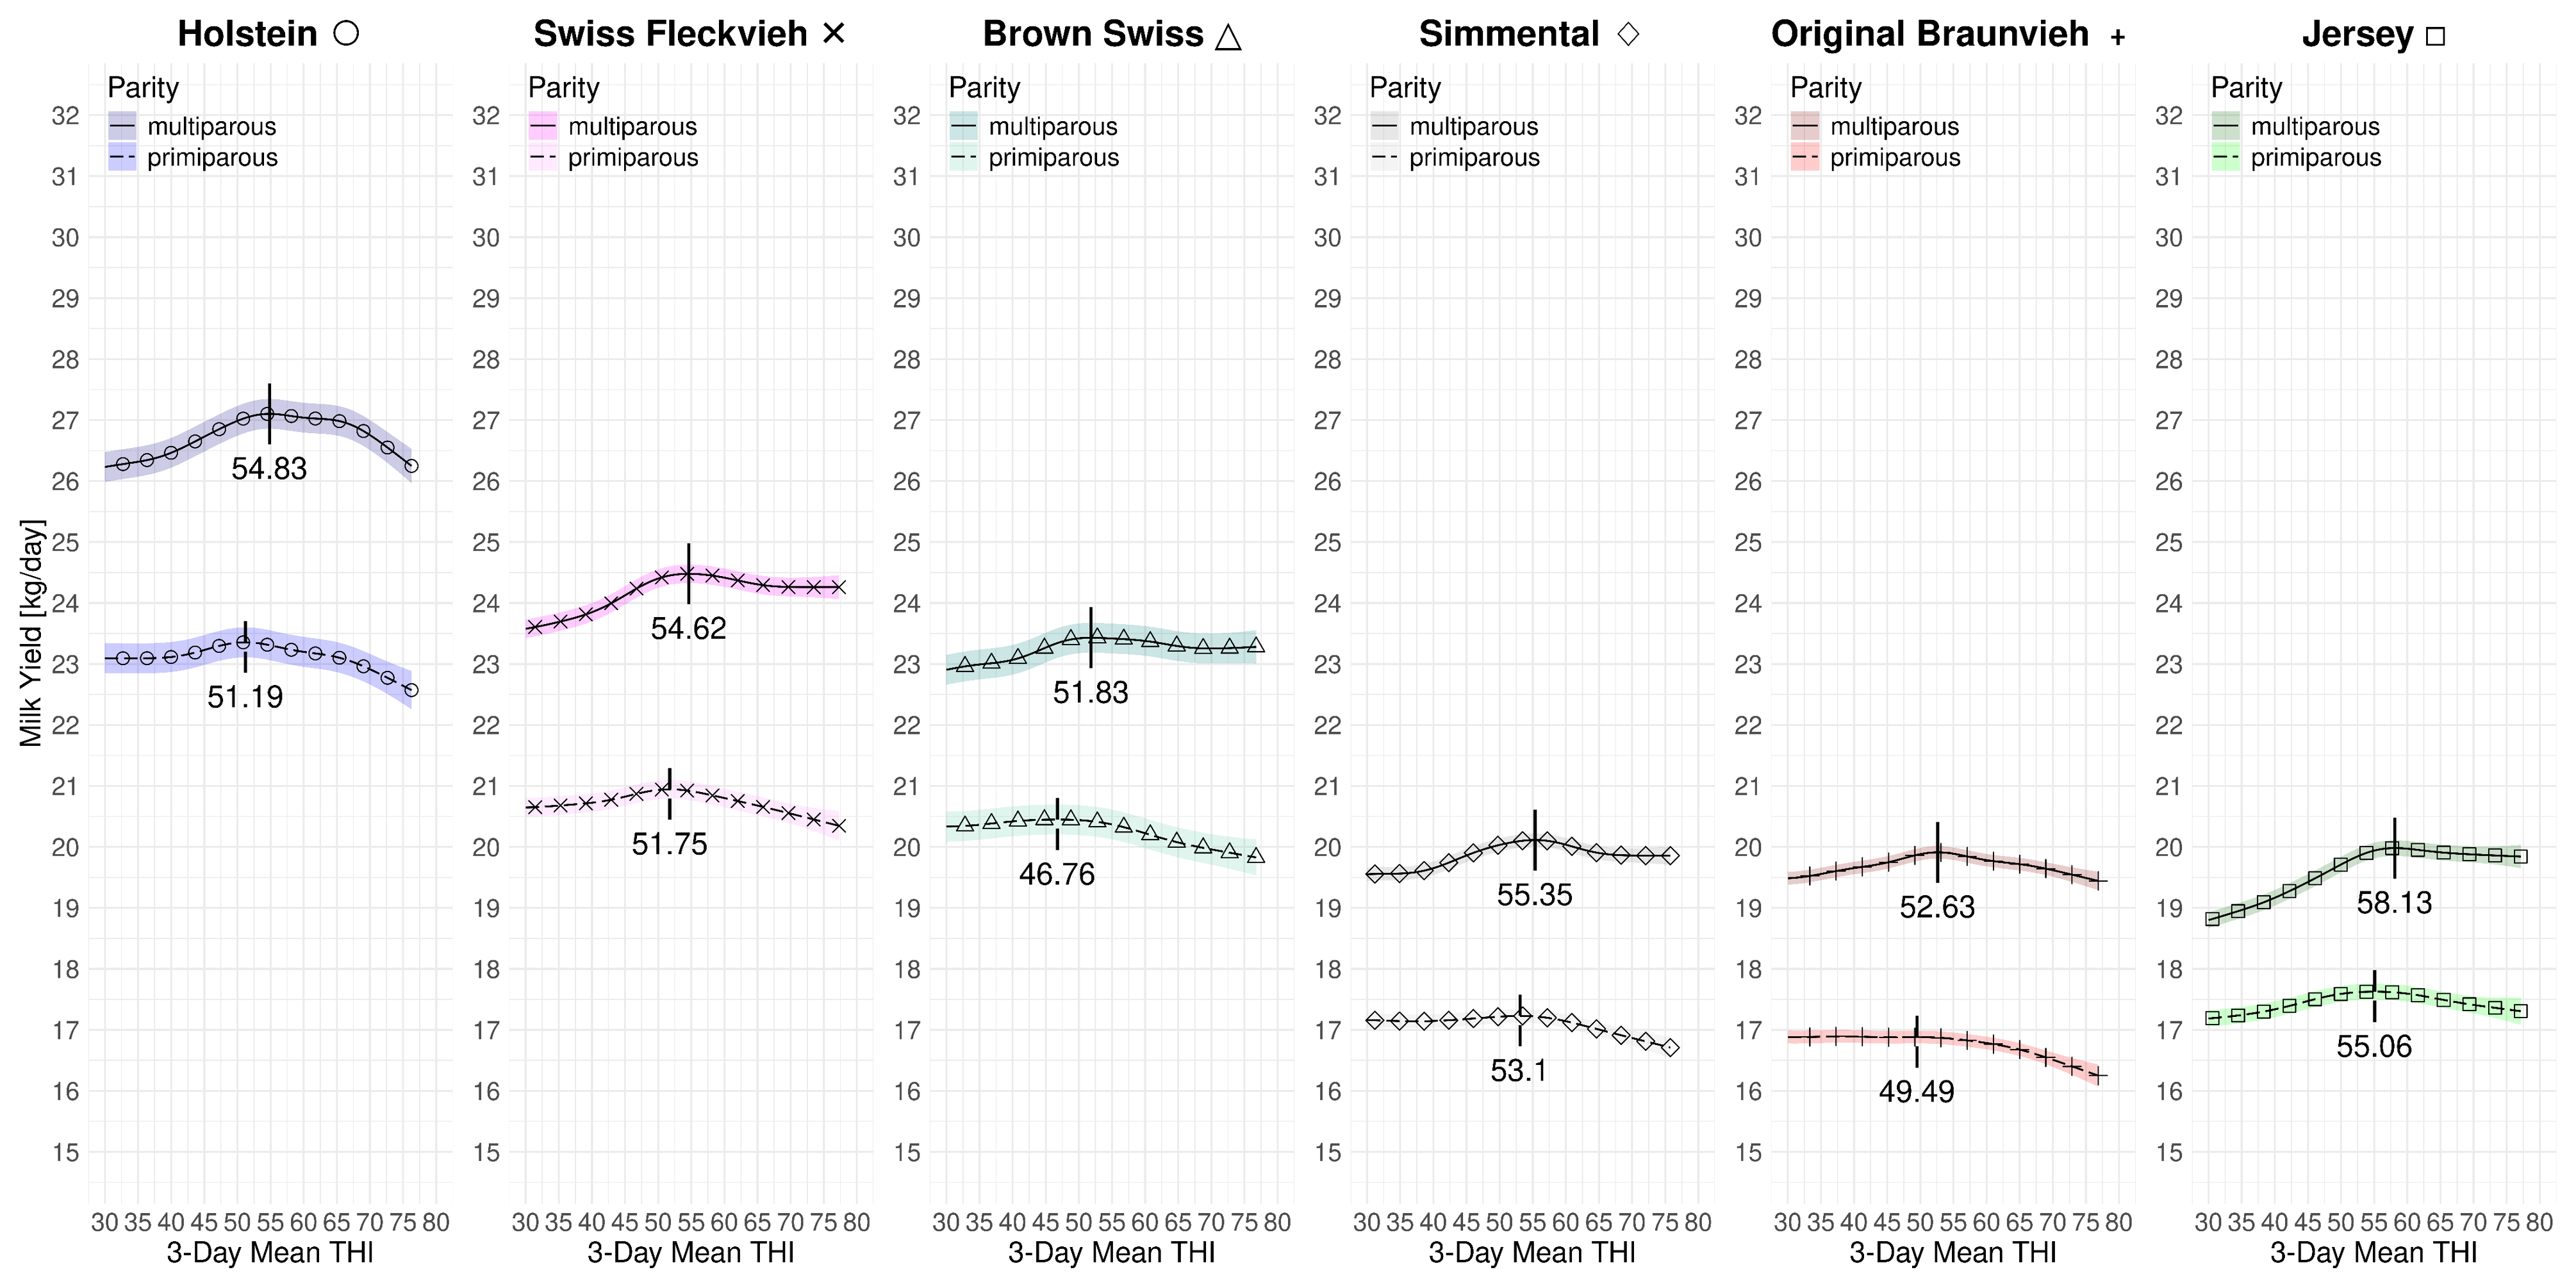
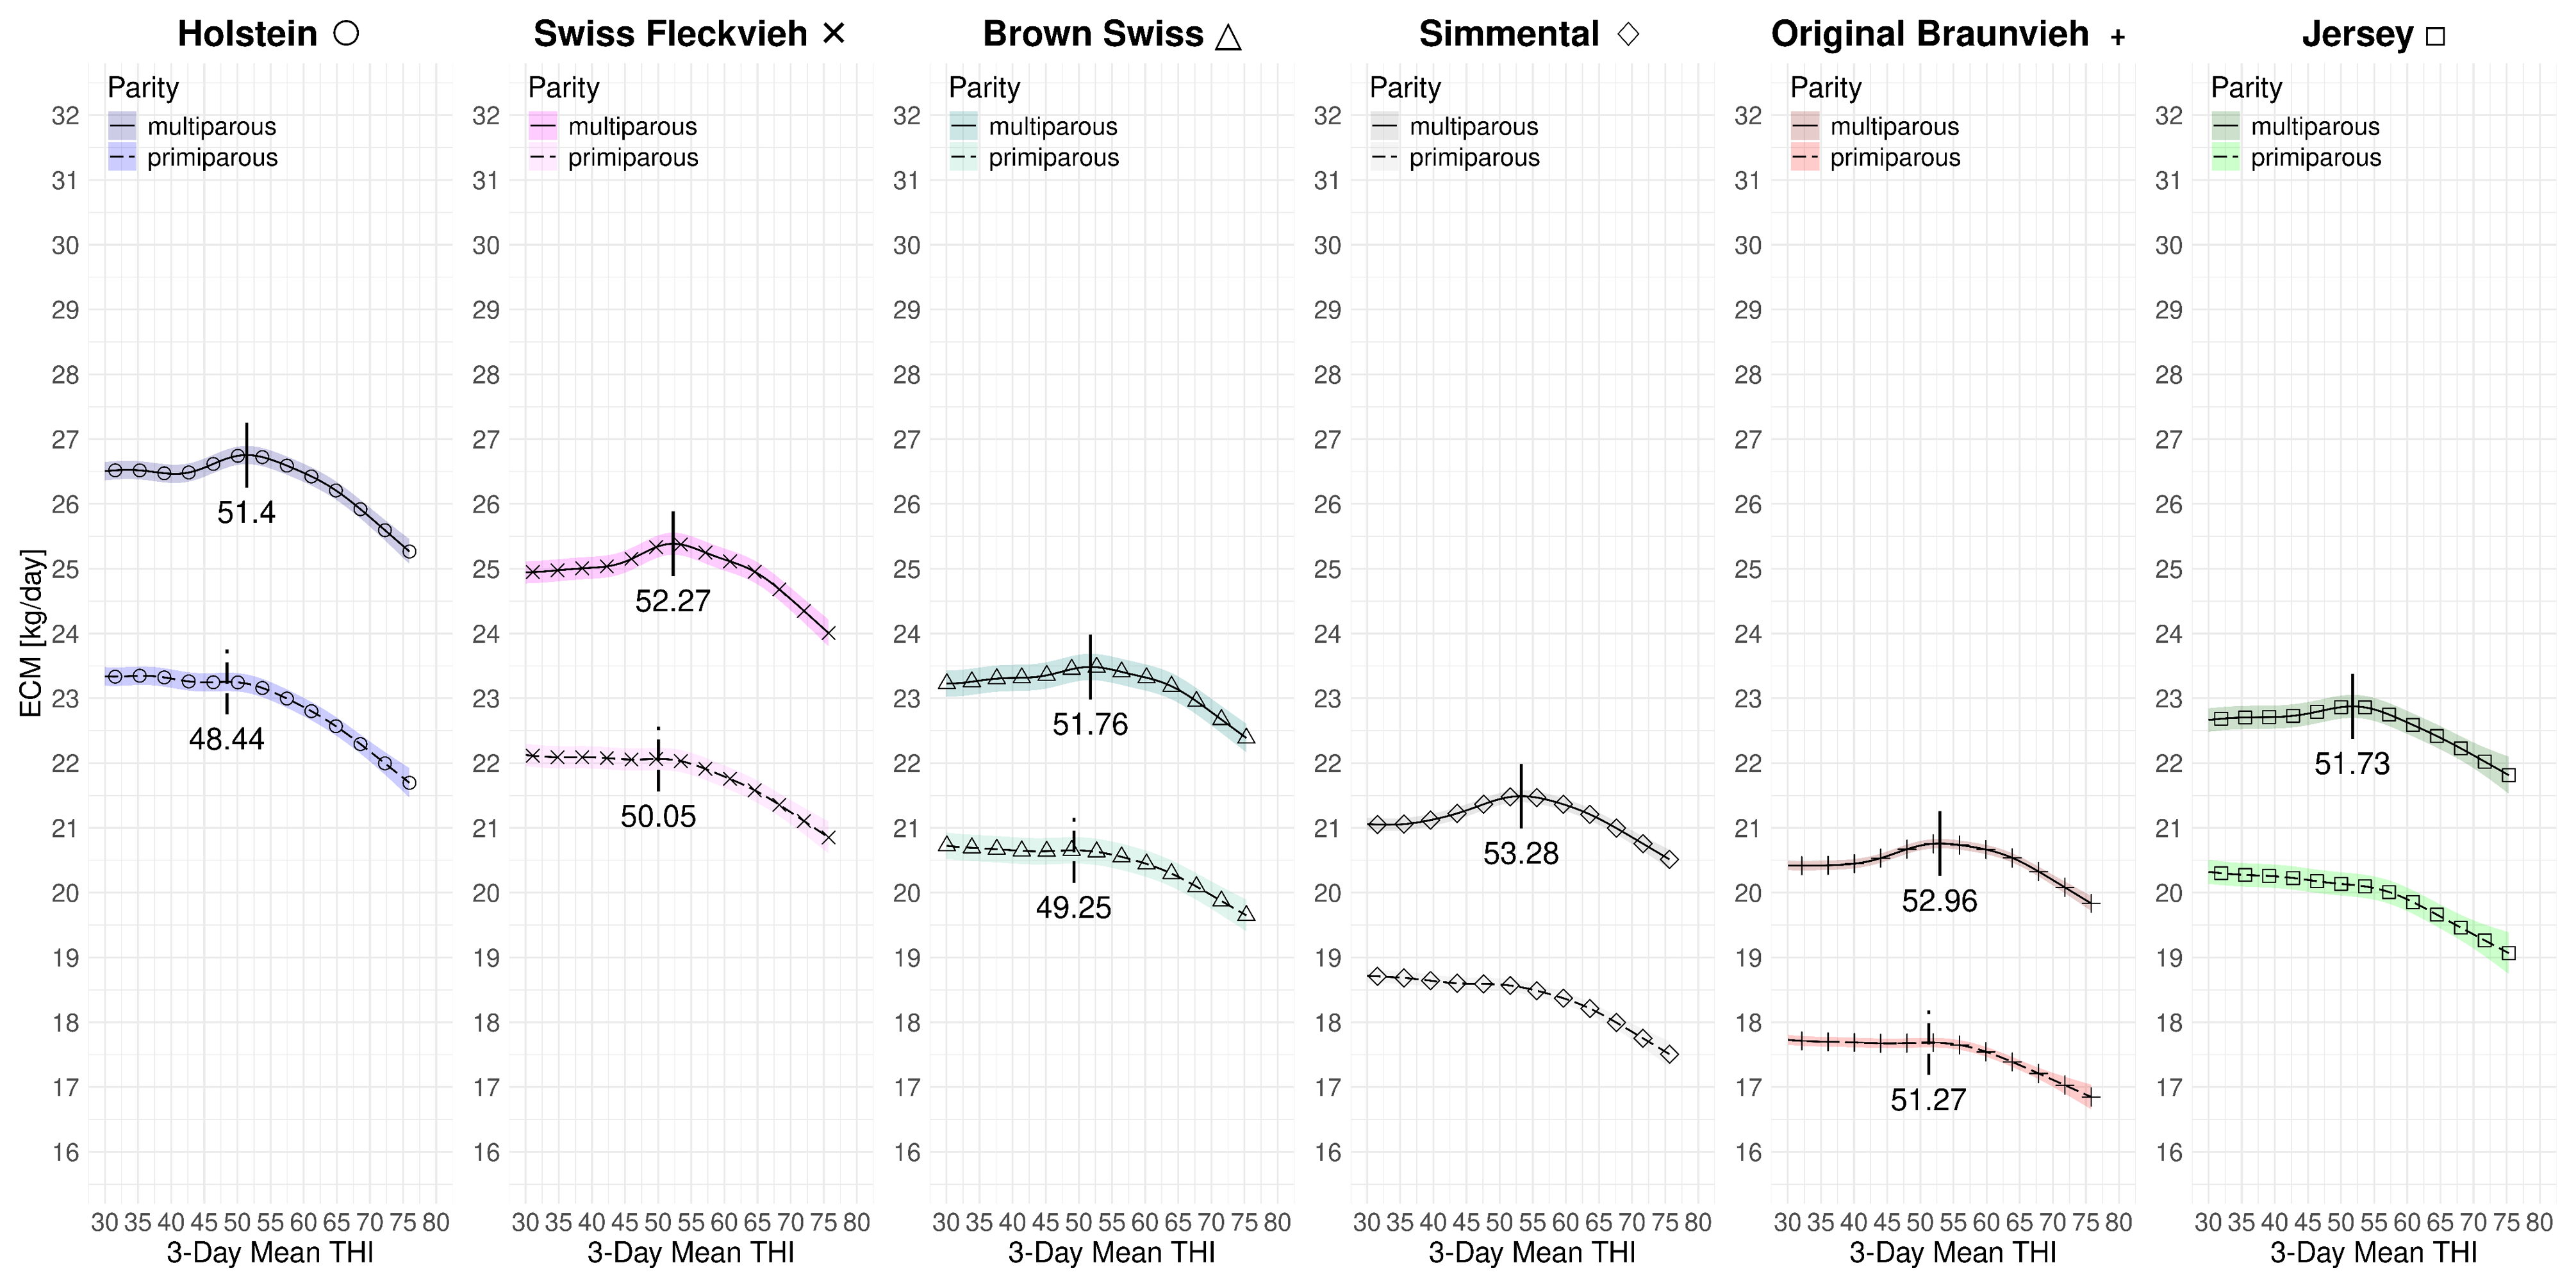
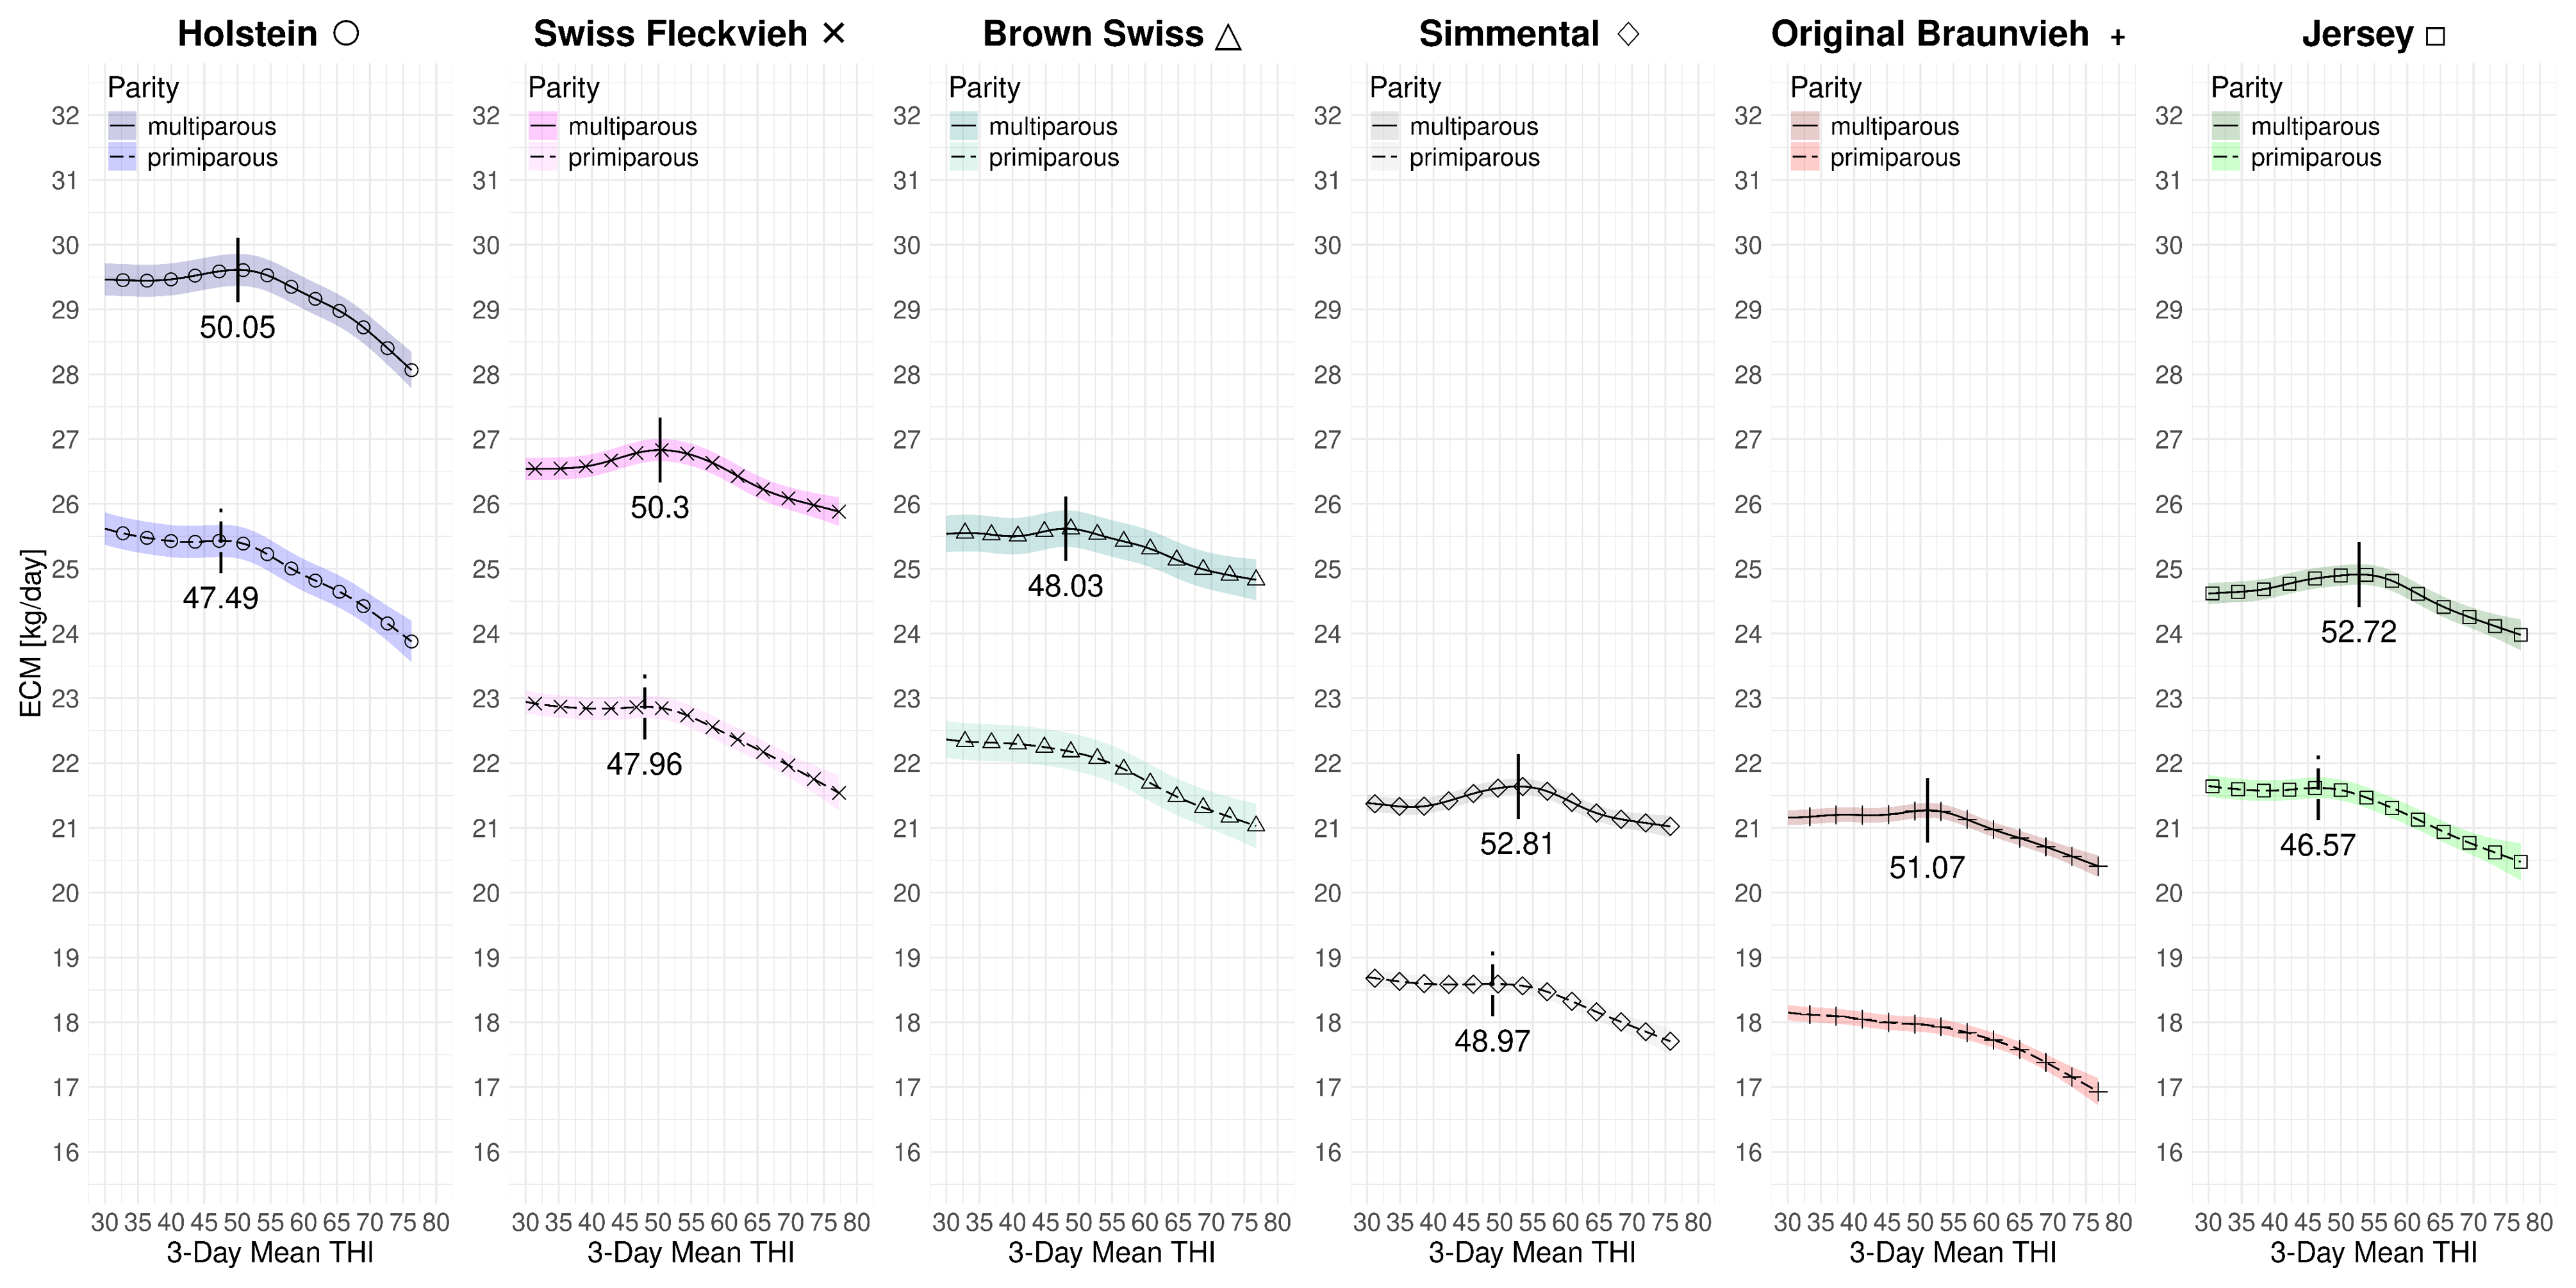
The following sections provide the summarizing figures with the THI curves for the split-period models.

C.1: Milk Yield

Figure C.1: 3-day mean THI effect on milk yield for primi- and multiparous Swiss dairy cows at 2010 levels with data subsamples covering the full time period from 1982-2010.

Figure C.2: 3-day mean THI effect on milk yield for primi- and multiparous Swiss dairy cows at 2023 levels with data subsamples covering the full time period from 2011-2023

C.2: ECM Yield

Figure C.3: 3-day mean THI effect on ECM yield for primi- and multiparous Swiss dairy cows at 2010 levels with data subsamples covering the full time period from 1982-2010.

Figure C.4: 3-day mean THI effect on ECM yield for primi- and multiparous Swiss dairy cows at 2023 levels with data subsamples covering the full time period from 2011-2023.